Is there a case for investing in commercial condom markets in Sub-Saharan Africa? - usaid
←
→
Page content transcription
If your browser does not render page correctly, please read the page content below
Third 20 by 20 Condom Initiative Meeting:
                                          Accelerating Commercial Engagement in Sub-Saharan Africa

                             Is there a case for investing
                          in commercial condom markets
                                 in Sub-Saharan Africa?
                                                                          Brian Smith and Chris Jones
                                                                              September 26, 2018

This publication is made possible by the generous support of the American people through the U.S. President’s Emergency Plan for AIDS Relief (PEPFAR) with the United States Agency for International Development (USAID) under the
Cooperative Agreement Strengthening High Impact Interventions for an AIDS-free Generation, number AID-OAA-A-14-00046. The information provided does not necessarily reflect the views of USAID, PEPFAR, or the U.S. Government.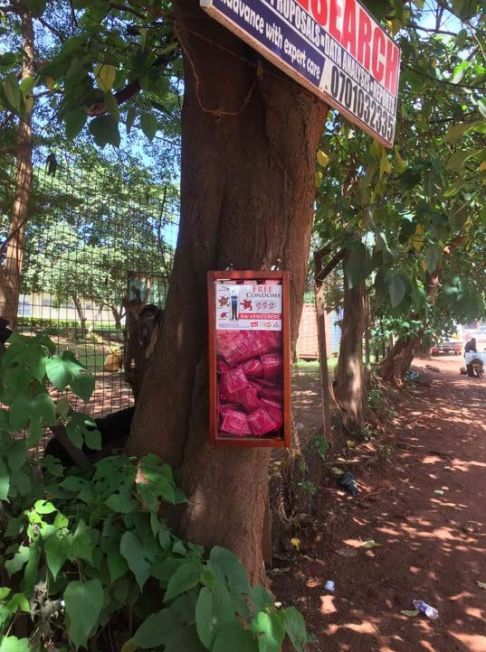
Intro
    Why ask?
    • Strategies to increase condom use in SSA remain important to a number
      of health priorities including HIV prevention, STI prevention, and family
      planning.
    • Possibility of decreasing donor support to condom procurement and
      programming (e.g., behavior change interventions) threatens progress and
      has increased interest in approaches that achieve sustainable high levels
      of condom use without dependence on external donor funding.
    • Decades of public investment in condom markets have created more
      favorable conditions for the commercial sector to play a greater role in
      meeting condom needs sustainably, yet the commercial sector so far
      represents a very small proportion of the total market.

2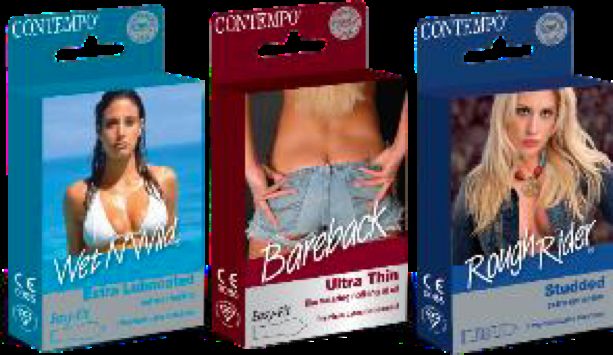
Intro
What did we do?
• Reviewed studies produced for 20 by 20 initiative; researched regulatory
environment through country visits, in-depth interviews, and document
review; modeled condom needs and consumption using UNAIDS condom
needs estimation tool; other in-depth interviews with commercial sector,
donors, civil society; desk review of published reports and gray literature
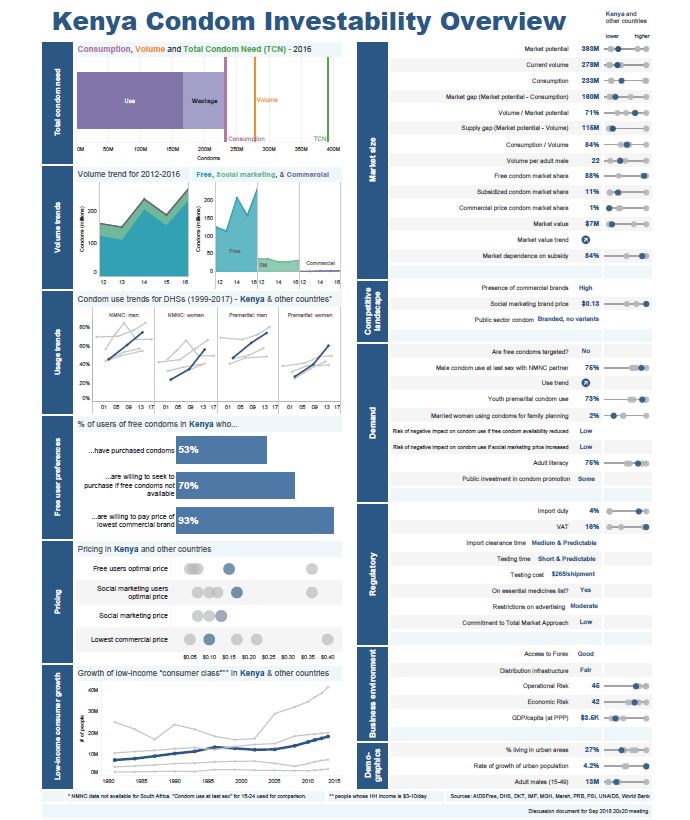
• Developed an “Investability Scorecard” that consolidates data into a range
of indicators that would factor into decisions to invest in condom
businesses in SSA.
• We focused our analysis on the 5 priority countries identified in the most
recent 20 x 20 condom meeting in Namibia at the end of 2015.
3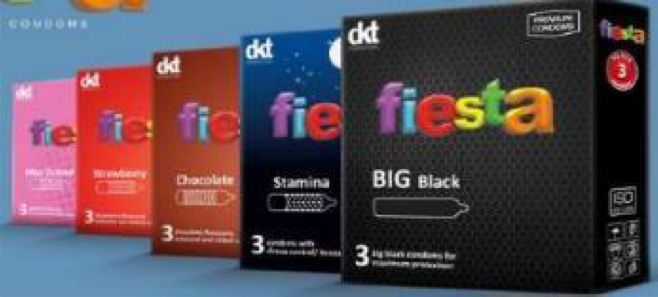
4
Intro
    Key Sources
    •   DHS and Country Behavioral Surveillance Studies
    •   DKT Social Marketing Statistics
    •   AIDSFree Willingness to Pay Study
    •   MGH Landscaping Reports
    •   UNAIDS Condom Needs Estimation Tool
    •   Population Reference Bureau World Population Data Sheet
    •   World Bank and IMF economic data reports
    •   Marsh business risk indexes
    •   Interviews with key representatives from government, commercial sector,
        NGOs, and donors

6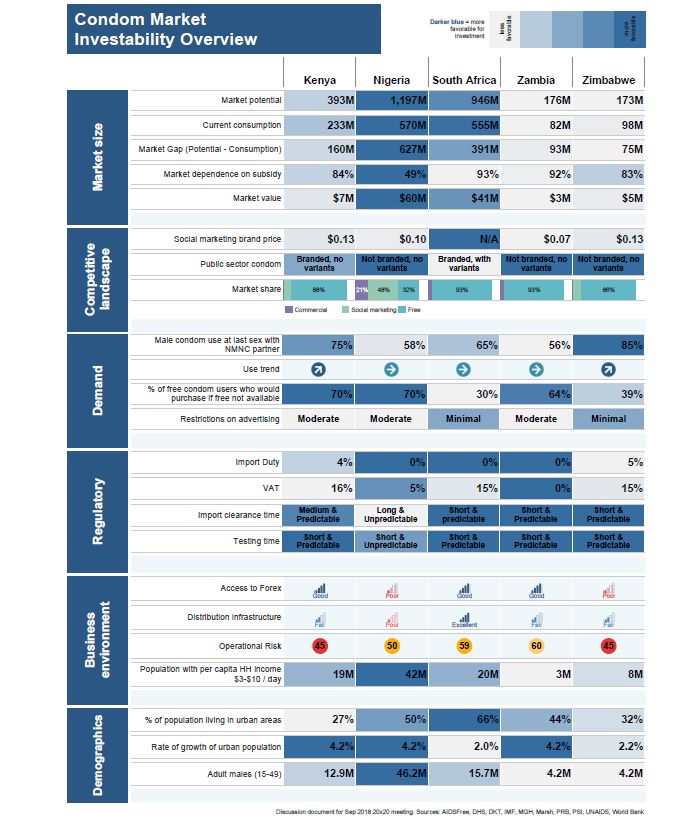
Intro
    How good is the data?
    • Data availability for this type of analysis is a challenge.
    • There is considerable data on condom markets, condom use and factors
      that influence use, but it is not “fit to purpose” – i.e., not collected in a way
      that would inform investment decisions.
    • The data is adequate to convey an overall picture of the prospects for
      investment in condom markets, but investment decisions would require a
      deeper dive and data with improved timeliness, frequency and depth.

7
Intro
    Presentation Outline
    • Factors favorable to commercial expansion
    • Challenges to expanding commercial engagement )
    • Modeling the opportunity in Kenya under different
      scenarios

8
Factors favorable to commercial expansion
    1. ( Total market size and market value for condoms is growing
    2. ( Percentage of people who regularly use condoms is increasing
    3. ( Substantial unmet need – a lot of room for growth
    4. ( Many users already paying for condoms and many are willing to pay more
    5. ( Social marketing brands, which have dominated markets at subsidized prices, are
         losing donor support, increasing prices, and creating opportunity for the commercial
         sector
    6. ( Number of brands in the market has grown – already profitable models, if small-scale (
    7. ( Macro economic and demographic factors associated with higher condom use are
         improving
    8. ( Total Market Approach (TMA) getting traction – governments increasingly aware of
         potential of commercial sector and the need to engage to accelerate contribution of
         commercial sector
9
349             Condom distribution
                   321                    continues to grow
                                          across all five focus
                                          countries

                   665    770

                   66     36
                   113    122

     2012   2013   2014   2015   2016 :
10
                                                  Sources: DKT, MGH
More people are using condoms Favorable
100
% reported condom use
at last high-risk sex
(men)
75
Condom use has
50
grown steadily, if
slowly
25
2000 2004 2008 2012 2016 7
Kenya 7 Nigeria South Africa Zambia Zimbabwe
11
Sources: DHS, SA national surveysCondom use as presented in the Scorecard
Dark lines represent Kenya. Light lines represent other countries
Source: DHSConsumers are spending more for Favorable
condoms
Kenya Condom Market Value
$8
$6
Millions 5
Market value has
increased in large part
$4 due to increases in
social marketing
prices
$2
$0
2011 2012 2013 2014 2015 2016 2017
13Market value in the 20 by 20 selected Favorable
countries
60
Larger commercial
millions USD 6 volumes in Nigeria
and South Africa drive
41 value
Kenya, Zambia, and
Zimbabwe value
driven by social
marketing brands
and/or small
3 commercial sector
7 5
Kenya Nigeria South Africa Zambia Zimbabwe 6Substantial unmet need – Room for growth Favorable
1,200
The number of
Millions of condoms 5
800 condoms needed to
protect at-risk sex
acts is 1.3 billion
400 condoms greater than
consumption
Need Consumption
100%
75%
% of need met
No country is
50% consuming 60% of
condoms needed
25%
0%
15
Kenya Nigeria South Africa Zambia Zimbabwe Source: UNAID Condon Needs Estimation ToolMany users of free condoms are willing to Favorable
pay for condoms
Among regular users of
South
FREE condoms Kenya Nigeria Zambia Zimbabwe
Africa
% who have ever purchased Regular users of
53% 60% 33% 50% 37% condoms were asked
condoms
about use of paid
condoms, how much
% willing to pay price of lowest they would be willing
93% 80% 70% 51%Reduced availability of free condoms in some Favorable
areas may not lead to lower use
South
Kenya Nigeria Zambia Zimbabwe
Africa
Risk of negative impact on
use if free condom Low Low Low High Medium
availability reduced
Assessment based on Willingness-to-Pay study that considered various pricing
scenarios and likelihood that regular free users would switch to purchasing
17
Source: AIDSFree WTP StudyDeclining social marketing means more Favorable
space for commercial brands
250 Sales of subsidized social marketing
brands (millions)
200
Social marketing sales
have declined or
150 plateau’d as programs
evolve in light of
PSI evolved to commercial
100 model in South Africa in 2013 lower funding for
subsidies, shift to
commercial model,
50 and greater focus on
market facilitation
2010 2011 2012 2013 2014 2015 2016
Kenya Nigeria South Africa Zambia Zimbabwe
18
Sources: DKT social marketing statisticsSocial marketing brands increasing prices Favorable
+ $0.30
$0.50
$0.50
Zimbabwe Kenya
$0.45
Protector Plus $0.45 Trust
$0.40 (4-pack) (3-pack) + $0.05
$0.40
$0.35 + $0.05
$0.35
$0.30 $0.30 + $0.05
$0.25 $0.25
$0.20 $0.20
$0.15 $0.15
$0.10 $0.10
$0.05 $0.05
2016 2017 2012 2013 2014 2017
19
Source: PSIPricing as presented in the Scorecard
Kenya
Dark circles represent Kenya. Light circles represent other countries
Source: AIDSFree Willingness to Pay StudyMore consumers with disposable income Favorable
Population in households with per
capita income between $3 and $10/day
21
Sources: https://ourworldindata.org/poverty-at-higher-poverty-linesAn increasingly educated population Favorable
increasingly living in urban areas
South
Kenya Nigeria Zambia Zimbabwe
Africa
Population in urban areas 27% 50% 66% 44% 32%
Rate of increase of urban
4.2% 4.2% 2.0% 4.2% 2.2%
population
Adult Literacy (women) 75% 50% 93% 56% 85%
Urban, more educated populations are generally more likely to use condoms
22
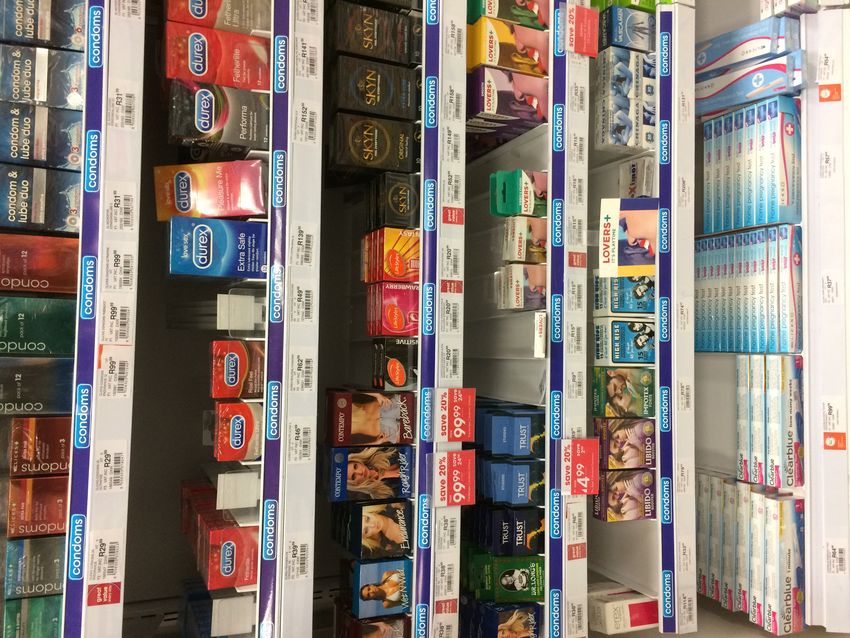
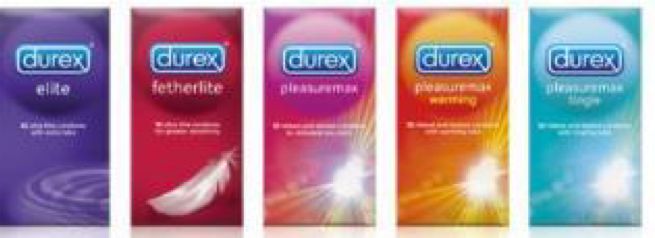
Source: CIA Factbook, DHSMore brands in the market Favorable
All five countries have
dozens of brands and
variants at a variety of
price points
23Challenges to commercial expansion
1. ) Market stewardship (leadership, coordination, market intelligence) have room for
improvement; where coordination bodies meet regularly, commercial sector not always
included.
2. ) Volumes have increased, but dependent on public sector/free condoms
3. Perception that universally available free condoms are a “right” or necessary to achieve )
public health goals; many free condoms, not always targeted to those who can’t pay )
4. ) Governments are wary of limiting access to free condoms; in some cases adding
variants and branding to improve user perceptions, creating greater competition
5. ) Less public funding for traditional condom-focused demand generation
6. ) Regulatory environment not fully aligned with goals of commercial sector expansion
7. ) Limited access to affordable working capital for importer/distributors who bear full risk
for expansion
8. ) Business environment still challenging
24Market volume driven by free condoms Challenges
1,000
750
Total market volume
500 (millions of condoms)
250
Kenya Nigeria South Africa Zambia Zimbabwe
Free SM Commercial
25
Source: DKT, MGHMarket dependent on subsidy Challenges
Kenya Nigeria
49%
84%
South Africa Zambia Zimbabwe
83%
93% 92%
Source: MGHDistribution exceeds consumption in some Challenges
countries
1,200
Large-scale
distribution of free
800 condoms may be
creating “over-supply”,
leading to excess
wastage, and crowding
400
out the commercial
sector, especially
where the public
sector offers branded
variants.
Kenya Nigeria South Africa Zambia Zimbabwe
Need Consumption Distribution
27
Source: UNAIDS Condon Needs Estimation Tool, MGH Landscaping, National ReportsNeed, volume & use as presented in the Scorecard
Kenya
Zambia
Source: UNAIDS Condon Needs Estimation Tool, MGH Landscaping, National ReportsFree condoms not always targeted Challenges
• Free condoms are seldom targeted to those who are unable to pay,
and instead reach the general population, some of whom might
otherwise purchase condoms.
• Periodic flooding of the market with free condoms inhibits
commercial investment and is disruptive to graduating social
marketing brands.
• Monitoring of free distribution can be improved as it is not always
adequate to inform decision-making.
• Data is generally available at the national level, but quality and
consistency weakens further down the distribution chain resulting in
over- and under-supply and increased wastage.
• Public sector has introduced branded free condoms & variants to
address negative perceptions.Attractive, high quality free condom
brands may have a negative impact on commercial sales and may end
29 up being used by people who could otherwise afford to pay.Less funding for demand creation Challenges
The U.S. government
(USG) has been a major
USG funding for Condom Programming supporter of demand
creation for condoms, in
$34
$32 large part through social
Funding (millions) 0
$27 marketing programs
$23
Budget systems do not
$17 $17
track funding for condom
programs or demand
creation
Data here represents
estimated funding to the
2011 2012 2013 2014 2015 2016 0
major country programs
Condom Programming 0 for condoms, much of
which was for social
marketing
30Capital tied up in long pipeline Challenges
Pre-shipment
Production Import permit
testing For importers who
need to pay up front
for condoms
Long lead times from
Cross-border Clearance at production to getting
Shipping
clearance Port condoms into the
market require cash
to be tied up
Streamlining lead
In-country times would lessen
To market
testing demands on cash
31Business environment challenges Challenges
Kenya Nigeria South Africa Zambia Zimbabwe
Access to Forex Good Poor Good Good Poor
Economic Risk 42 58 48 39 33
Political Risk 40 36 33 42 33
Operational Risk 45 50 59 60 45
Corruption Perception 28 27 43 37 22
32
Sources: www.marsh.com/content/marsh/political-risk-map-d3/prm-2018.html#, www.transparency.org/cpiBusiness environment challenges in context Challenges
Political Risk Economic Risk Operational Risk
33
Sources: www.marsh.com/content/marsh/political-risk-map-d3/prm-2018.html#,Modeled Market Projections Scenario Analysis in Kenya
Current Market in Kenya                                                                            Kenya Model
                                       Kenya Market Volumes - Major Segments &

                                                                                              Tier B brands ($0.15-
                                                                                             $0.21 piece), 5,386,047

                                                                  Tier A (SM
       Free, 185,400,000     Other, 44,218,906.04                  brands),
                                                                                                 Tier C ($0.25-$0.44
                                                                  37,125,036
                                                                                                   piece), 879,221

                                                                                                Tier D ($0.51 and
                                                                                               up piece), 828,602

                   • Public Free Distribution constitutes ~81% of Kenyan Condom Market
                   • 83% sold market driven by social marketing brands Trust and Salama
                   • Commercial sector largely sits in the higher value premium market.
                   • For most importers, condoms constitute a relatively small portion of business:
Multiple Brands & Price Points on Market Kenya Model
• Majority of brands currently priced in the
subsidized space, representing 84% of sold
market share (but rapidly changing).
• Over 20 brands available on the market, more
than 60 variants and price points.
Trust Studded Kama Sutra
Leo Rough Rider
Salama
Deluxe Variants Durex
0 40 KES 100 KES 130 KES 165 KES 200 KES 225 250
60 KES KES KES
Fiesta Share Fiesta Variants Wet & Wild
Sure (leaked Trust )
free) )
36
Source: PS Kenya Retail Audit (2017)Kenya Condom Market Value - 2017 Kenya Model
Tier D ($0.51
and up piece),
Tier C ($0.25-
$560,690 • Total sold value of market: ~ $6.7 million
$0.44 piece), • Non Subsidized (commercial) market value: ~ $1.9
$236,517 million
• Value increasing, driven largely by price increases
of Trust, the leading SM brand
• 3 Brand families dominate commercial market
Tier B brands value – Contempo, Durex, and Duluxe brands.
($0.15-$0.21
Tier A (SM
piece),
brands),
$1,115,791
$4,304,591
37Kenya Model
Investment Case Modeling in Kenya
4 scenarios were modeled based on 2017 PS Kenya Retail audit, and Abt Associates WtP data, plus
one ‘aggressive’ scenario modeled combining multiple shifts in market
• Scenario 1: Business As Usual
• Scenario 2: Price of Trust increased to .80 USD / 3 pack.
• Scenario 3: Price of Trust increased to 1.00 USD / 3 pack
• Scenario 4: .20 / condom floor for condom pricing
• Scenario 5: Aggressive market shifts
• Salama (SM brand) disappears from market (in keeping with likely scenario in TZ).
• Price of Trust increases to $.80 in 2019 then $1.00/pack by 2020
• Free condom distribution capped at 200m/year
38Kenya Condom Market Potential – Scenario 3 Kenya Model
Trust pricing adjust to $1.00 package: Value of market shifts
60 - $10.0
Millions
Millions
$9.0
50
$8.0
$7.0
40
Value Condoms Sold
Condoms Sold
$6.0
30 $5.0
$4.0
20
$3.0
$2.0
10
$1.0
- $0.0
2017 2018 2019 2020 2021 2022 2023 -
Tier A (SM brands) Tier B brands ($0.15-$0.21 piece) Tier C ($0. 25-$0.44 piece)
Tier D ($0.51 and up piece) Tier A (SM brands) Tier D ($0.51 and up piece)
39Kenya Condom Market Potential – Scenario 5 Kenya Model
Aggressive market shifts
70 $25.0 • Salama disappears
Millions
Millions
from market
60
$20.0
• Price of Trust
increases to $.80 in
50 2019 then $1.00/pack
by 2020
Value Condoms sold
$15.0
Condom Sold
40
• Free condom
distribution capped
30 at 200m/year
$10.0
20
$5.0
10
- $0.0
2017 2018 2019 2020 2021 2022 2023 %
Tier A (SM brands) % Tier B brands ($0.15-$0.21 piece) Tier C (($0.25-$0.44 piece)
40
Tier D ($0.51 and up piece) Total Market ValuePotential Impact on Importers Kenya Model
Modeled scenario: Assume Importer A, whose brand currently creates
$200,000 value at retail (price to consumer).
• Importer margin is 35%.
• Distributor/Wholesaler margins 15%
• Retailer margins 80%
Scenario Gross Revenue Net Revenue
(Revenue less COGS)
Baseline Scenario $60,750 $15,750.
Scenario 3 – Trust to $1.00 $89,000 $23,000
Scenario 5 - Agressive 156,000 $40,000
41Modeling Summary Kenya Model
Scenario Modeled Impact Modeled Market Increase in
value by 2023 Market Value
(million, annual) by 2023
(million,
annual)
Scenario 1: Business As Usual $9.15 NA
Scenario 2: • Volume share of Trust decreases to 43% of 2018 volumes
Price of Trust increased to .80 • Brands below $0.20/condom increases to 36.2% market share
$12.31 , $3.16
USD / 3 pack. , • Brands above $0.20/condom increases to 10.2%
• 7.4% of trust users shift to free.
Scenario 3: • Volume share of Trust decreases to 35.3% of share
Price of Trust increased to • Brands below $0.20/condom increases to 42.0% of market share
$12.83 , $3.69
$1.00 USD / 3 pack , • Brands above $0.20/condom increases to 10.8% market share
• 8.5% of trust users shift to free
Scenario 4: , Trust gains share from 55% percent to ~63% of user share, largely at the
•
$0.20 /•condom
. floor for expense of lower-priced commercial brands (24% to 14%).
condom pricing • Commercial sector would grow to ~10% of the sold market. $11.19 $2.05
• Many assumptions • are builtofinto
Proportion menthewho modeling, with
would cease using scenario
condoms or opt5forinfree
particular
condoms building in aggressive
shifts in market by multiple sectorincreases
showed negligible (free in
stabilizing,
this scenario.Trust making pricing adjustments.
Scenario 5: • Salama disappears from market
Aggressive market shifts • Price of Trust increases to $.80 in 2019 then $1.00/pack by 2020 $23.79 $14.64
• Free condom distribution capped at 200m/yearScenario Analysis: Kenya Condom Market Value
projections with different assumptions
Summary: Kenyan Condom Market Value - Scenario Analysis (Million $)
2018 2019 2020 2021 2022 2023 (
Commercial $1.91 $2.03 $2.15 $2.28 $2.42 $2.57
Scenario 1 - baseline
SM $4.54 $4.82 $5.11 $5.42 $5.75 $6.10
Scenario 2 - Trust increased to Commercial $1.91 $2.65 $2.81 $2.98 $3.17 $3.36
0.80 SM $4.54 $7.37 $7.82 $8.30 $8.81 $9.34
Scenario 3 - Trust increased to Commercial $1.91 $2.65 $2.81 $2.98 $3.17 $3.36
$1.00 SM $4.54 $7.83 $8.31 $8.82 $9.35 $9.92
Scenario 4 - $0.20 Floor for Commercial $1.80 $1.91 $2.57 $2.73 $2.89 $3.07
condoms SM $4.28 $4.54 $6.80 $7.22 $7.66 $8.12
Scenario 5 - Salama phase out, Commercial $1.91 $3.26 $4.89 $6.41 $7.59 $8.97
Trust inc, free capped at SM $4.54 $7.19 $10.19 $11.54 $13.08 $14.82Thanks.
Contact info: ' brianrodneysmith@gmail.com
chris@jonesglobalinsights.comYou can also read