2019-20 Forecasting & Planning Scenarios - Aemo

Page created by Derek Bates
 
CONTINUE READING
2019-20 Forecasting & Planning Scenarios - Aemo
2019-20 Forecasting &
Planning Scenarios
2019-20 Forecasting & Planning Scenarios - Aemo
Purpose of this workshop

      Scenario                      Policy assumptions
      development                   and inputs
      Provide overview of how       Discuss key inputs that
      the scenarios to be used in   shape the scenarios, and
      2019-20 ISP have been         outline next steps in the
      developed                     ISP process

                                      Designed to understand risks and
       Designed in response
                                                  impacts
      to stakeholder feedback

                                                                         2
2019-20 Forecasting & Planning Scenarios - Aemo
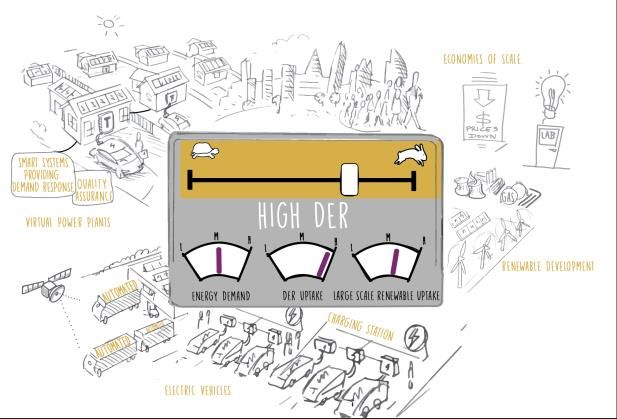
Stakeholder engagement and
consultation process to date

                   5 Feb                   20 Mar                                                        Date TBC
                   Forecasting and         Submissions on                                                Final scenario and
 Deliverables      planning                forecasting and                                               assumptions
                   consultation            planning                                                      report published
                   published               consultation

                          Feb                 Mar                   Apr                  May                  Jun

                       19 Feb              3 Apr                 12 Apr               21 May              3 Jun
                       Stakeholder         Briefing webinar to   Stakeholder          Consumer            ISP Scenario and
 Engagements and                                                                                          Assumptions
                       workshop to         summarise             workshop to          engagement
 consultations         address questions   submissions           explore scenarios    approach and ISP    briefing
                       of clarification                          and resolve issues   workshop
                                                                                                             This Briefing

                                                                                                                              3
2019-20 Forecasting & Planning Scenarios - Aemo
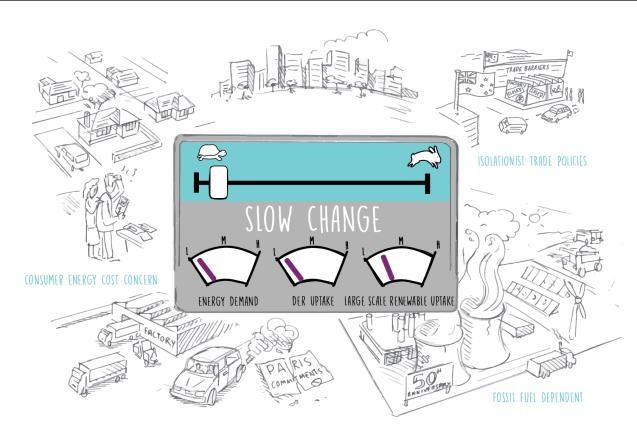
Feedback received from
consultation submissions
 Theme                                                                                                               Frequency   Consensus
  -   The consultation process and the efforts being made to increase engagement with stakeholders are positive      High        High

  1   Emissions reduction modelling needs to explicitly incorporate policies and account for stricter trajectories   High        High

  2 The current scenarios do not sufficiently capture the range of possible energy futures                           High        Medium

      The modelling of generator retirements needs to account for earlier retirements, and be based on more
  3                                                                                                                  High        Medium
      than technical retirement age
  4 Improvements can be made to the Distributed Energy Resources modelling approach                                  High        Low

  5 A commercial discount rate should be used, as opposed to a social discount rate below the WACC                   Medium      High

  6 Increase the transparency and dynamism of Marginal Loss Factor modelling                                         Medium      Medium

  7 The establishment of more Renewable Energy Zones and their modelling                                             Medium      Low

  8 When modelling benefits, incorporate ancillary benefits and services, or establish a market for these services   Low         High

      System strength is an important issue and improvements need to keep being made in terms of how to
  9                                                                                                                  Low         Medium
      incorporate it effectively into the models

 10 Resilience modelling approach: Both HILP and mitigation options                                                  Low         Low

                                                                                                                                             4
2019-20 Forecasting & Planning Scenarios - Aemo
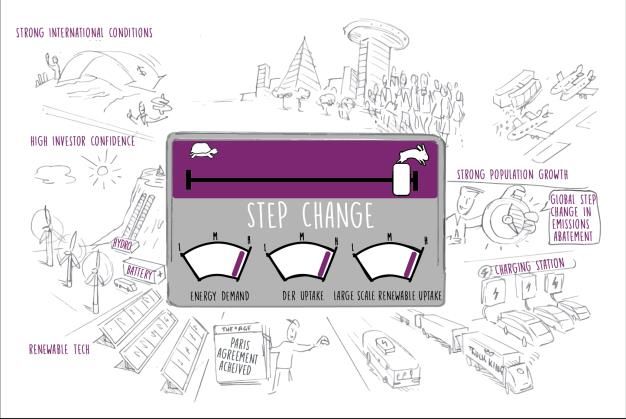
From consultation to publication
• Additional consultation prior to                         Consultation prior to commencement of ISP
  commencement of ISP 2019-20:                             2020-21:
   • June-July 2019
       • Renewable Energy Zone workshop

   • September 2019
       • Tentative timing for stakeholder forum on early
                                                           • Work starts on ISP 2020-21 (early tentative dates)
         draft modelling outcomes                              • August 2019 - October 2019
                                                                   • Generator cost projections for 2020 forecasting
   • December 2019
       • Draft ISP released, seeking feedback                  • November 2019 – March 2020
                                                                   • Consultation, workshops on scenarios, assumptions
                                                                     and inputs for ISP 2020-21
   • January-April 2019
       • Consultation, remodelling                             • April 2020
                                                                   • Final scenarios and assumptions report
   • Mid 2020 (dates to be confirmed):
       • Final ISP released                                    • December 2020
                                                                   • Draft ISP released, seeking feedback
                                                                                                                         5
2019-20 Forecasting & Planning Scenarios - Aemo
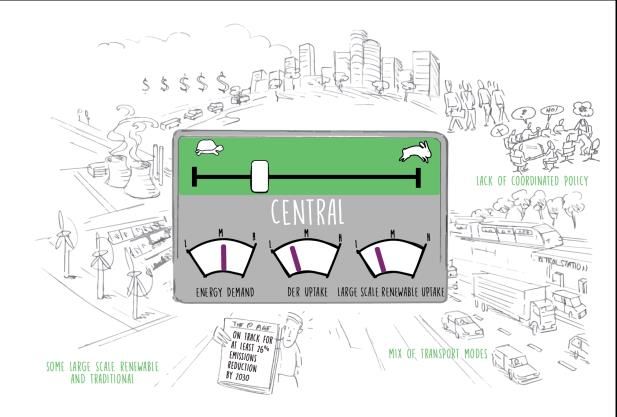
ISP scenario overview
For 2019-20 ISP

                        6
2019-20 Forecasting & Planning Scenarios - Aemo
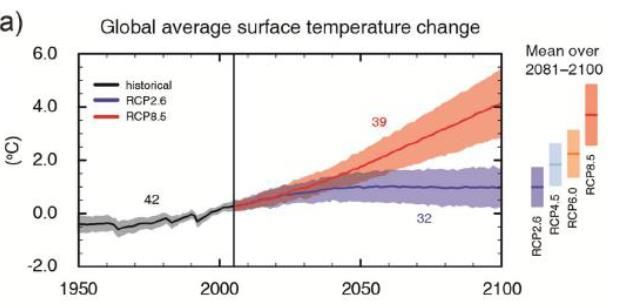
Five scenarios capturing key
 uncertainties
Decentralisation

                                Decarbonisation   7
Scenarios framed by science
based climate pathways…
Climate pathways                                          • Capture the physical symptoms of climate change
                                                          • The most likely current global emissions trajectory is consistent
Adoption of Representative Concentration Pathways (RCP)     with RCP7.0, considering current global commitments to the Paris
                                                            Agreement (e.g. 26% for Australia by 2030)

                                                           Scenario              RCP                   Temperature impacts in
                                                                                                       southern Australia
                                                                                                       (assuming similar trends
                                                                                                       globally)

                                                           Step Change           RCP 2.6               1.7 – 1.8 °C
                                                           Fast Change           RCP 4.5               2.5 – 2.7 °C
                                                           Central               RCP 7.0               3.2 – 4.5 °C
                                                           Slow Change           RCP 8.5               >4.5 °C

                                                                                 * High DER will reflect the conditions of the Central scenario,
                                                                                                                       with higher DER uptake.

                                                                                                                                                   8
…converted into NEM carbon
budgets to 2050…
                                                                Cumulative NEM electricity sector emissions to 2050
                                          4,000
  Cumulative carbon budget to 2050 (MT)

                                          3,500

                                          3,000

                                          2,500

                                                                      Outcome of existing energy
                                                                       policies and closure dates
                                          2,000

                                          1,500

                                          1,000

                                           500

                                             0
                                                  Slow Change        Central                        Fast Change    Step Change     2018 Neutral      2018 Fast

                                                                                                         High DER will reflect the conditions of the Central scenario
                                                                                                                                            with higher DER uptake.     9
…with resultant emission trajectories
determined from modelling
      Scenario            Minimum emissions reduction by 2050
                          (relative to 2005)

      Step Change                               95%
      Fast Change                               90%
      Central                            TBC (26% by 2030)
      Slow Change                               33%
                    *High DER will reflect the conditions of the Central scenario
                                                        with higher DER uptake.

                                                                                    10
Central scenario incorporates
current policy settings
• AEMO proposes to incorporate government environmental and energy
  policies into its Central scenario where:
   (a) there is a current policy commitment with clear articulation of when and how it
   impacts the power system, and
   (b) any of the following criteria are met:
      •   a commitment has been made in an international agreement;
      •   the policy is legislated;
      •   the policy has received funding in a State or Federal government budget;
      •   there is evidence that the policy is highly likely to be implemented.

• Policies which are less certain, but reasonably likely, will be modelled as
  sensitivities.
• AEMO will develop its inputs with respect to government policy in
  consultation with governments and other stakeholders.
                                                                                         11
Central scenario incorporates
current policy settings
Policies                                            Included?

26% emission reduction by 2030                                    In other scenarios, policies
                                                       ✓          that are not legislated will
Victorian renewable energy target (50% by 2030)
                                                                  only be included if consistent
                                                       ✓          with the scenario narrative.
Queensland renewable energy target (50% by 2030)
                                                       ✓          Given there is not yet a
Large-scale renewable energy target
                                                       ✓          specific mechanism for
                                                                  achieving QRET, a sensitivity
Snowy 2.0
                                                       ✓          around the central scenario
Battery of the Nation                               Sensitivity
                                                                  without QRET will also be
                                                                  tested.
Distributed energy resource and energy efficiency
policies                                               ✓
                                                                                                  12
Scenarios narratives
For 2019-20 ISP

                       13
Central scenario          This scenario includes current federal and state energy policies

                   • Global economic growth is in line with ‘central’ estimates.
                   • Gradual improvement in technology – innovation and cost reductions
                     in renewable and consumer technologies
                   • Adoption of EVs is slow as vehicle prices are slow to reduce, and
                     vehicle model availability is limited in the short/medium term
                   • Moderate uptake of consumer DER, with consumers selecting DER to
                     manage energy more affordability
                   • Economics, rather than policy, is driving industry change. Global
                     commitments to climate change do not lead to strong increases in
                     commitments to meet Paris Agreement goals (with countries not
                     wishing to ‘go it alone’).
                   • Coal generation is being retired on schedule, rather than forced to
                     close from policy measures. Energy sector change is evolutionary and
                     gradual
                   • Climate change leads to higher temperatures and more extreme
                     weather conditions, leading potentially to greater frequency of
                     extreme or peakier demands

                                                                                            14
Slow Change
              • Challenging global and local economic conditions lead to greater
                focus on domestic economic growth, with less international trade.
              • International innovation is lower, leading to slower cost reductions of
                renewable energy / energy storage devices
              • Weak economic conditions lead to higher project financing costs and
                closure of some industry
              • Less capacity for and interest from consumers to control energy bills
                resulting in lower Distributed Energy Resources (DER) investment with
                no forthcoming policy support to compensate
              • Adoption of electric vehicles (EVs) is limited as vehicle prices remain
                high and Australia does not strategically promote manufacturers to
                deliver models suitable for Australian conditions
              • Generation technology transition is limited. Renewable investment
                slows. Thermal fleet is maintained at least to technical life based on
                positive economic case for continued operation. Limited political,
                commercial and social support for taking action on climate change.
              • Climate change leads to higher temperatures and more extreme
                weather conditions, leading potentially to greater frequency of
                extreme or peakier demands

                                                                                          15
High DER         This scenario includes current federal and state energy policies

           • Global economic growth and renewable generation policies are
             in line with ‘central’ estimates
           • Emissions commitments in line with Central Scenario
           • Highly digital society leads to strong innovation of easy to use,
             interactive and engaging consumer technologies. Consumers
             embrace broad technology innovations, driving significant
             industry change through DER uptake
           • Society values a stronger role for community, self-sufficiency and
             sustainability. Consumers recognise the role they, rather than
             Government policy, must have in achieving energy
             transformation
           • Economics of DER and a supportive policy environment underpin
             the pace of change
           • Physical and technological infrastructure to support DER
             proliferates, especially with regards to EVs and virtual power
             plants (VPPs)
           • Controllable home devices lead to a stronger role for at-home
             energy management to optimise own energy use and identify
             community energy aggregation opportunities
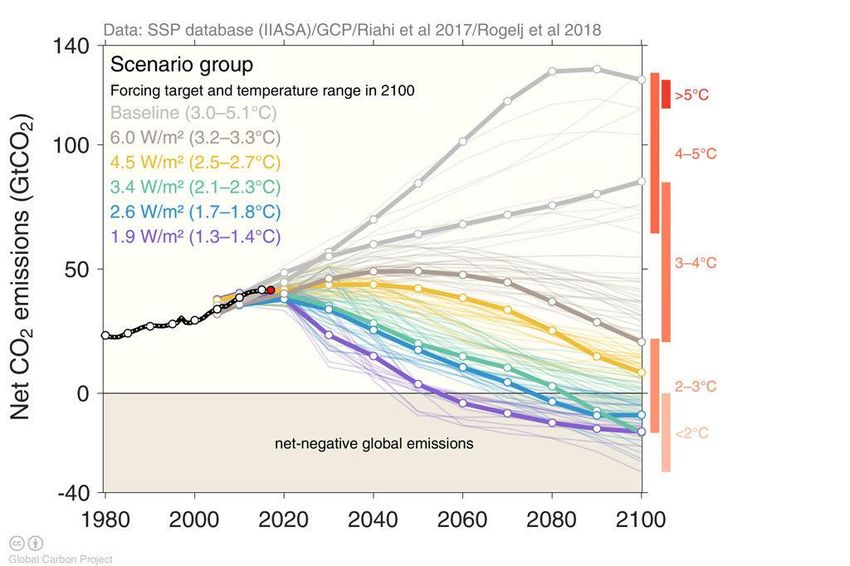
                                                                                  16
Fast change scenario
                       • Global economic growth is in line with ‘central’ estimates with
                         significant increases in international commitments to
                         decarbonise. [Despite this, global temperatures still rise just
                         above 2 degrees by 2100]
                       • Technology innovations lead to cost reductions across large- and
                         small-scale technologies in accordance with a decarbonising
                         global economy
                       • Moderate/High uptake of consumer DER, as policy settings are
                         even handed between large-scale and distributed technologies.
      FAST CHANGE      • Fast adoption of EVs as policy support catalyses infrastructure
                         investments and supportive environment for consumers (model
                         availability, new electricity tariffs)
                       • Stronger focus on renewable generation leads to some
                         opportunities to withdraw coal ahead of technical life
                       • Increased energy policy bipartisanship towards national energy
                         solutions in the longer term lead the market to deliver solutions
                         at the large scale.

                                                                                             17
Step Change      This scenario represents strong climate action, with a step change
                  in approach triggered by a major climate, political or social event.

              • Strong population growth from increased quality and duration of
                life, and migration. Australia’s resources, manufacturing and
                service industries all profit from this growth and a greater digital
                economy.
              • Very strong international coordination of climate action, with
                rapid increases of climate commitments to avoid critical climate
                change
              • Greater innovation in digital trends and consumer cost structures
                lead to stronger consumer energy management
              • Technology innovation leads to lower solution costs for large and
                small scale technologies. Fast rate of development of renewable
                generation and higher economic growth enables increased DER
                investments
              • Strong electric vehicle penetration and intelligent transport
                systems are widely adopted, and integrated into the electricity
                grid. Hydrogen-fuelled vehicles are also part of the mix.
              • Strong bipartisanship towards clean energy solutions, with
                accelerated coal retirements both a function of economic rational
                behaviour and policy settings to decarbonise

                                                                                       18
Emission reduction and
climate change
Spread of electricity sector decarbonisation objectives for each scenario

                                                                            19
Method
The emissions scenarios were developed using the following process:
1. Global emissions trajectories were established consistent with the scenario narratives.
2. The global trajectories were translated to Australian trajectories using methodologies broadly
   consistent with the Climate Change Authority 1 (considering global per-capita emissions).
3. The Australian trajectory was adjusted consistent with the scenario narrative to reflect the
   electricity sector’s contribution (leading, parallel, lagging).
4. Assumes that demand from the electrification of other sectors (transport, gas) would be
   delivered through “zero-emissions” supply.
5. The trajectory was converted to a cumulative budget to allow optimised transition over time.

1.   http://climatechangeauthority.gov.au/reviews/targets-and-progress-review-3 (Appendix C)

                                                                                                    20
Context
• AEMO has relied on the analysis conducted by various sources to determine an appropriate
  application of decarbonisation to the NEM
• Australian trajectories align with a theme of global action.
• It is possible that global outcomes may occur with or without Australian alignment.

• The electricity sector is currently known to be a lower cost source of emissions reduction.
• The electrification of other sectors may reduce emissions outside this analysis.
• There may reach a point where emissions reductions are lower cost in other sectors.

The purpose is to develop a range of scenarios to inform the development of the NEM

                                                                                                21
Global Emissions Trajectories
                            • Scenarios with
Science Based Method                                                                        Actual emissions reduction trajectories will be
                                                                                                              confirmed via the modelling

Slow Change Scenario (RCP8.5)                 2030       2050      Central Scenario (RCP7.0)                             2030           2050
Slowing global action, Australia lags, NEM parallel                Current trajectory, Australia parallel, NEM parallel
Global Emissions relative to 2005             168%       250%      Global Emissions relative to 2005                     143%           188%
Australian Emissions relative to 2005         TBC        72%       Australian Emissions relative to 2005                           N/A
NEM Emissions relative to 2005                TBC        67%       NEM Emissions relative to 2005                            At least 26%
Average temperature rise                        >4.5oC by 2100                                                            reduction by 2030
                                                                   Average temperature rise                               3.2-4.5oC by 2100

Fast Change Scenario (RCP4.5)                 2030       2050      Step Change Scenario (RCP2.6)                         2030           2050
Hastening action, Australia parallel, NEM leading                  Action taken to keep under 2 oC warming, Aus leads, NEM leading
Global Emissions relative to 2005             128%       124%      Global Emissions relative to 2005                     100%           51%
Australian Emissions relative to 2005         TBC        18%       Australian Emissions relative to 2005                 TBC            -12%
NEM Emissions relative to 2005                TBC        10%       NEM Emissions relative to 2005                        TBC            5%
Average temperature rise                       2.1-2.7oC by 2100   Average temperature rise                                1.7-1.8oC by 2100

                                                                                    * High DER will reflect the conditions of the Central scenario,
                                                                                                                          with higher DER uptake.     23
Other key inputs that shape
the scenarios
For 2019 Forecasting

                              24
Participant sentiment towards Central assumption choices
                     Assumptions                                        Choices

                     Global action          RCP 2.6               RCP 4.5               RCP 6.0            RCP 8.5

        Emissions
        summary
                     National action           Lagging                      Par allel                  Leading            Additional participant comments
                     Electr icity
                                               Lagging                      Par allel                  Leading
                                                                                                                          • Emissions summary:
                     sector action
                                                                                                                             – Some emissions targets and policies should be
                                          Decelerating relative                                   Accelerating relative
                                                                                                                               assumed
                     Solar PV
                                                                                                                             – Consider ability for gas to operate as a
                                                                       GenCost Base
                                               decreases                                               decreases

                     Wind                 Decelerating relative                                   Accelerating relative
                                                                                                                               transactional fuel
      Large-scale                              decreases
                                                                       GenCost Base
                                                                                                       decreases
       renewable
        build cost
      trajectories   Pumped hydr o        Decelerating relative
                                               decreases
                                                                       GenCost Base               Accelerating relative
                                                                                                       decreases
                                                                                                                          • Large-scale renewable build cost trajectories:
                                                                                                                             – Important to consider changes in plant life,
                     Batter y             Decelerating relative
                                               decreases
                                                                       GenCost Base               Accelerating relative
                                                                                                       decreases
                                                                                                                                especially plant life extension and factors that
                                                                                                                                will act a barrier to exit such as site remediation
                                              CSIRO - Low             CSIRO - Medium                  CSIRO - High
                                                                                                                                and redundancy costs
                     Rooftop PV
                     and batter y
                                             Energeia - Low          Energeia - Medium              Energeia - High

      DER uptake
                                              CSIRO - Low             CSIRO - Medium                  CSIRO - High
                     Electr ic vehicles
                                             Energeia - Low          Energeia - Medium              Energeia - High

         Demand
                     Consumption                 Low                        Medium                       High
        summary

                            Key:     Netw orks Gener ators Developer s Gover nment Consumer                   Other                                                                   25
Consolidated view of assumption choices
                   Assumptions                                                    Choices
                                        3                         20                       9
                                                                                                    RCP 7.0
                   Global action               RCP 2.6        2        RCP 4.5         2       RCP 6.0                RCP 8.5

      Emissions                         13                                 12                            1                           Commentary on key decisions
                   National action                Lagging              4           Par allel                      Leading
      summary

                                        2                                  24                            5
                                                                                                                                     • Emissions summary, global action
                   Electr icity
                   sector action
                                                  Lagging              2           Par allel                      Leading               – While stakeholder feedback suggested RCP4.5
                                                                                                                                          as the preferred pathway, consideration of current
                                                                           19                        10

                   Solar PV                  Decelerating relative
                                                  decreases
                                                                                 GenCost Base                Accelerating relative
                                                                                                                  decreases
                                                                                                                                          estimates regarding the effectiveness of current
                                                                           23                        5
                                                                                                                                          policies globally to meet long term emissions
    Large-scale    Wind                      Decelerating relative
                                                  decreases
                                                                                 GenCost Base                Accelerating relative
                                                                                                                  decreases               abatement outcomes has led to RCP7.0.
     renewable
      build cost                        6                                  16                         8
    trajectories   Pumped hydr o             Decelerating relative
                                                  decreases
                                                                                 GenCost Base                Accelerating relative
                                                                                                                  decreases          • Emissions summary, national action
                                        5
                                                                           15
                                                                                                     11
                                                                                                                                        – Electricity sector is lagging as economic
                   Batter y                  Decelerating relative               GenCost Base                Accelerating relative
                                                  decreases                                                       decreases               decisions rather than emissions reduction
                                                                                                                                          objectives influence investment action on
                                        5                                  21                            3

                   Rooftop PV
                                                  CSIRO-Low                      CSIRO-Medium                    CSIRO-High               coordinated investments towards renewable
                   and batter y         6
                                                Energeia-Low
                                                                           9
                                                                                Energeia-Medium
                                                                                                     2
                                                                                                                Energeia-High
                                                                                                                                          energy and earlier action towards coal closures.
    DER uptake
                                        3                                                             3
                                                                           14
                                                  CSIRO-Low                      CSIRO-Medium                    CSIRO-High
                   Electr ic vehicles                                      10                        1
                                        6
                                                Energeia-Low           1        Energeia-Medium                 Energeia-High

                                        4                                  26
       Demand
                   Consumption                      Low                            Medium                           High
      summary

                                                                  Key:          Suggested choice             Consider ed choice
                                                                                                                                                                                               26
Distributed Energy
Resources
For 2019 Forecasting

                       27
DER trajectories: Rooftop PV
                                            Effective Rooftop PV Capacity                                                                                 Rooftop PV Penetration
                           45,000                                                                                                10

                                                                                                                   Millions
Rooftop PV Capacity (MW)

                           40,000                                                                                                9

                           35,000                                                                                                8

                                                                                                                                 7
                           30,000

                                                                                                      Rooftop PV installations
                                                                                                                                 6
                           25,000
                                                                                                                                 5
                           20,000
                                                                                                                                 4
                           15,000
                                                                                                                                 3
                           10,000
                                                                                                                                 2
                            5,000                                                                                                 1

                               0                                                                                                 0

                              Slow Change    Central    Fast Change   High DER   Step Change                                          Slow Change   Central    High DER   Fast Change   Step Change

                                                                                               Total eligible households in NEM regions by 2050 is approximately 11-13 million
                                                                                                                                                                                                      28
DER trajectories: Embedded battery systems
                                    Battery Capacity (MWh)                                                                                Battery Penetration
            45,000                                                                                                 10

                                                                                                      Millions
            40,000                                                                                                 9

            35,000                                                                                                 8

                                                                                                                   7
            30,000

                                                                                           Battery Installations
                                                                                                                   6
Total MWh

            25,000
                                                                                                                   5
            20,000
                                                                                                                   4
            15,000
                                                                                                                   3
            10,000
                                                                                                                   2
             5,000
                                                                                                                    1
                0                                                                                                  0

                     Slow Change   Central   Fast Change   High DER   Step Change                                       Slow Change   Central    High DER       Fast Change   Step Change

                                                                                    Total eligible households in NEM regions by 2050 is approximately 11-13 million
                                                                                                                                                                                            29
EV trajectories
                                          Electric Vehicle energy consumption                                                          Electric Vehicle penetration
                        45,000                                                                                      14

                                                                                                         Millions
Energy Consumed (GWh)

                        40,000
                                                                                                                    12
                        35,000
                                                                                                                    10
                        30,000

                                                                                                Electric vehicles
                        25,000                                                                                      8

                        20,000                                                                                      6

                        15,000
                                                                                                                    4
                        10,000
                                                                                                                    2
                         5,000

                            0                                                                                       0

                            Slow Change       Central    Fast Change   High DER   Step Change                            Slow Change   Central    High DER     Fast Change   Step Change

                                                                                                             EV fleet share between approximately 20% to 60% of vehicles by 2050
                                                                                                                                                                                           30
Generation technologies
and their costs
For 2019-20 ISP

                          31
Key technology costs in Central
scenario
                                 6000

                                 5000
Technology Capital Cost ($/kW)

                                 4000

                                 3000

                                 2000

                                 1000

                                   0

                                        Black Coal (supercritical PC)   Brown Coal (supercritical PC)   OCGT   CCGT                   Large scale Solar PV
                                        Solar Thermal (8hrs Storage)    Battery storage (2 hrs)         Wind   Pumped Hydro (6 hrs)   Pumped Hydro (12 hrs)

                                                                                                                                                              32
Relative cost reductions in the
           Central Case
                                                                                                                    1600%

                                                                    Relative technology capital costs (% of wind)
                                                                                                                    800%

                                                                                                                    400%

                                                                                                                    200%
                                0%

                                                                                                                    100%
                               -10%
Cost reduction since 2019-20

                                                                                                                     50%
                               -20%

                                                                                                                     25%
                               -30%

                               -40%

                               -50%

                               -60%

                                      2029-30   2039-40   2049-50                                                           2019-20   2029-30   2039-40   2049-50
                               -70%

                                                                                                                                                                    33
Relative technology cost changes
across scenarios
             Large Scale Solar PV                                  Wind
2000                                2000
1800                                1800
1600                                1600
1400
1200
       Slow Change →                1400
                                    1200
1000                                1000
 800                                 800
 600                                 600
 400                                 400
 200                                 200
   0                                   0

                Solar Thermal       Baseline cost scenarios:
                                    •  Mix of 4 degree and 2 degree CSIRO GenCost baselines
6000

5000                                Scenario dispersion:
4000
                                    •  Delayed technology cost reductions: Slow Change
3000
               Fast Change         •  Hastened technology cost reductions::
                                          •    Fast Change
2000                                      •    Step Change
1000
                                    Key technologies affected:
   0
                                    •   Wind
                                    •   Solar PV
                                    •   Solar Thermal
                                                                                              34
You can also read