ITALY'S PERFORMANCE IN THE FRAMEWORK OF THE 2020 EUROPEAN TARGET - Ing. Sergio Dondolini
←
→
Page content transcription
If your browser does not render page correctly, please read the page content below
ITALY’S PERFORMANCE IN THE FRAMEWORK OF THE
             2020 EUROPEAN TARGET
                     Rome, 20/11/2014
            PIN Talk – Road Safety Toward 2020

               Ing. Sergio Dondolini

                 General Directorate of Road Safety
ROAD SAFETY IN ITALY

In Italy, in 2013, 181.227 injury crashes occurred, causing 3.385
fatalities and 257.421 injuries

More than 9 fatalities every day - 1 fatality every 2,5 hours

The estimated social cost is over 27 billions Euro

                             General Directorate of Road Safety     2
ROAD SAFETY IN ITALY: TRENDS 2001 – 2013
                              400.000                                                                                                   7.500

                                                                                                                                        7.000

                              350.000
                                                                                                                                        6.500
  N° of Crashes or Injuries

                                                                                                                                        6.000

                                                                                                                                                N° of Fatalities
                              300.000
                                                                                                                                        5.500

                                                                                                                                        5.000
                              250.000
                                                                                                                                        4.500

                                                                                                                                        4.000
                              200.000
                                                  2010 target: 3 548                                                        -52.3%
                                                                                                                                        3.500
                                                      fatalities
                              150.000                                                                                                   3.000
                                           2001   2002   2003   2004   2005   2006    2007   2008   2009    2010   2011   2012   2013
                                Crashes    263.1 265.4 252.2 243.4 240.0 238.1 230.8 218.9 215.4 211.4 205.6 186.7 181.22
                                Injuries   373.2 378.4 356.4 343.1 334.8 332.9 325.8 310.7 307.2 302.7 292.0 264.7 257.42
                                Fatalities 7.096 6.980 6.563 6.122 5.818 5.669 5.131 4.725 4.237 4.090 3.860 3.650 3.385

                                                                   Crashes           Injuries       Fatalities

From 2001 a 2013 there was a 52.3% reduction in fatalities

                                                                       General Directorate of Road Safety                                                          3
EVOLUTION OF ROAD FATALITIES IN EUROPE (2001 - 2010)
0%
Variazione % del numero di morti 2001-2010
-3,0%
-10%
-6,3%
-20%
-23,2%
-30%
-29,4%
-33,1%
-40%
-37,2%
-38,8%
-39,6%
-39,8%
-40,3%
-40,8%
-42,4%
-42,4%
-42,9%
-43,9%
-45,4%
-50% -45,9%
-47,1%
-47,7%
-48,5%
-50,4%
-51,1%
-54,3%
-54,4%
-55,1%
-60%
-57,6%
-60,8%
-60,9%
-70%
With reference to the ambitious target set by the European Union in the White Paper on
Transport in 2001 (-50% road fatality reduction by 2010), Italy reached a reduction equal
to - 42.4% in 2010, in line with the European average of 42.9%
General Directorate of Road Safety 4
ROAD FATALITY TRENDS IN EUROPE (2010 - 2013)

                                       Italy                 Source: ETSC, 2014
   * Provisional data

                        General Directorate of Road Safety               5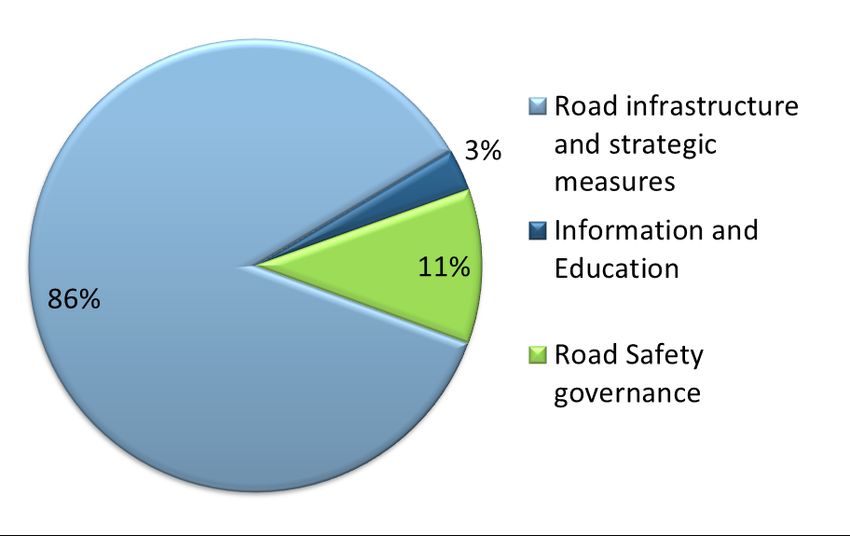
MAIN DRIVERS OF CHANGE

Since 2002, Italy has undergone a process of improving road safety thanks to a new
systematic and structured approach

 Adoption and implementation of the National Road Safety Plan 2001-2010

• 5 Implementation Programs

• 1.561            co-financed
  interventions

• 3.150 measures thus broken
  down into 3 main categories

                              General Directorate of Road Safety               6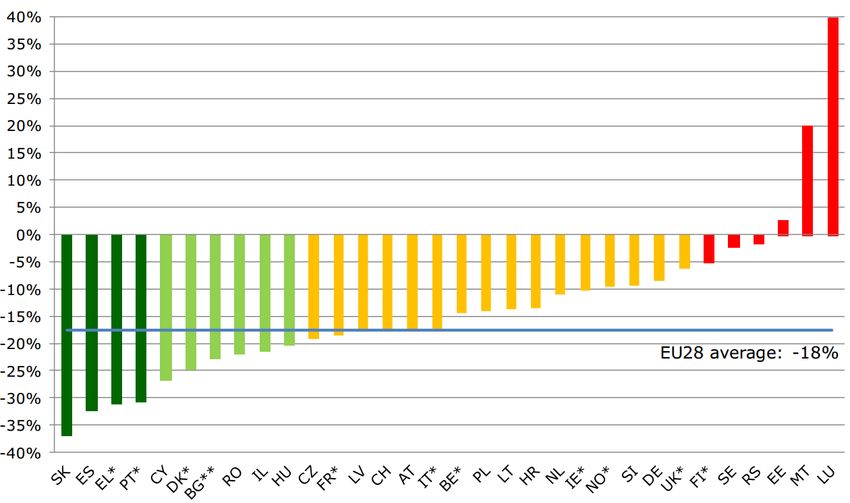
MAIN DRIVERS OF CHANGE

Careful and rigorous regulatory action of risky behaviours

 Some examples:
 • Introduction of penalty point system

 • Increasing the power of investigation of Police and tougher penalties
   such as for driving under the influence of alcohol or drugs

 • Introduction of specific measures such as: "zero alcohol" for young
   drivers (from 18 to 21 years), for novice drivers and for professional
   drivers (transport of persons or goods)

                               General Directorate of Road Safety           7
MAIN DRIVERS OF CHANGE
Public awareness and information campaigns on road safety issues
General Directorate of Road Safety 8MAIN DRIVERS OF CHANGE
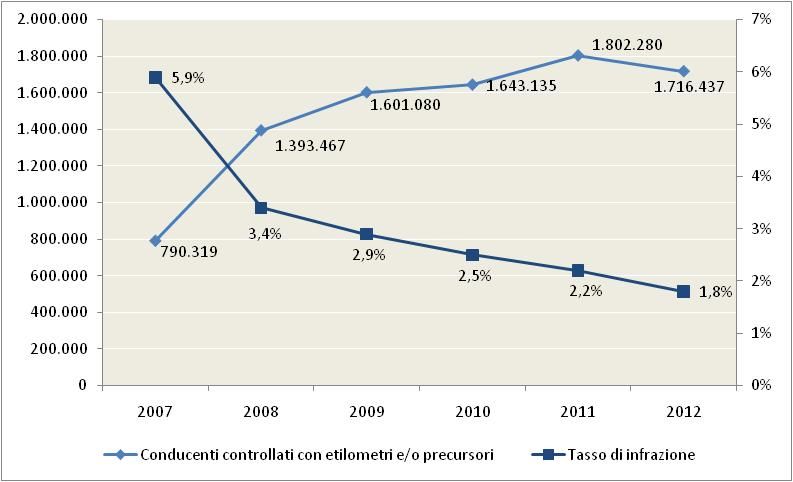
Intense collaboration with the National Police body leading to a significant increase
in the number of police alcohol checks
Alcohol checks
Positive rate
Compared to 2006 the number of alcohol checks in 2010 increased by 7 times.
In 2006, 241,932 checks were performed, compared to 1,716,437 in 2012
General Directorate of Road Safety 9MAIN DRIVERS OF CHANGE
• Control activities on heavy vehicles through Mobile Centers for vehicles inspection
(CMR)
• Services carried out by the staff of Department of Land Transports in collaboration
with the Police
2007 2008 2009 2010 2011 2012 Variation
2007-2012
(% )
Services carried 1.630 1.714 1.932 2.404 2.189 2.148 32%
out
Vehicles checked 20.613 25.548 26.246 34.879 31.996 33.057 60%
number of 23.785 24.975 26.064 37.224 33.934 29.718 25%
violations
General Directorate of Road Safety 10PNSS Horizon 2020: The Development Process
General
Target
Categories at
Monitoring
risk
Specific
Implementation
targets
Risk
Measures factors
Strategies
General Directorate of Road Safety 14PNSS Horizon 2020: General Target
Italy, as in 2001, has adopted the overall objective defined by the European Commission,
namely: 50% reduction in the number of fatalities on roads by 2020
4.500
• Assuming a linear trend, to
achieve the final target of -50%
4.114
4.000 fatalities by 2020, we need a
3.860
3.753
decrease of 206 fatalities per year
• It represents a reduction of -5% in
3.500
3.385 2010-2011, while in 2019-2020
-206 fatalities
N° of Fatalities
the expected reduction is -10%
3.000
• The observed reduction rate is
2.500 (considering last 4 years) -6.3%.
• However, the needed average
reduction rate is -6.7% per year to
2.000
reach the target
1.500
2010 2011 2012 2013 2014 2015 2016 2017 2018 2019 2020
Linear trend target 2020 Fatalities
General Directorate of Road Safety 15PNSS Horizon 2020: The Seven Strategies
The intervention areas taken into account, consistent with the guidelines provided by
the European Commission, are:
•Improving education and training of road users
•Strengthening the road rules application
•Improving the road infrastructure safety
•Improving the safety of vehicles
•Promoting the use of modern technology to improve road safety
•Improving emergency services and post-accident assistance
•Strengthening Road Safety Governance
General Directorate of Road Safety 16PNSS Horizon 2020: The Higher Risk Categories
The overall target has been integrated with specific targets for the higher risk categories
identified based on results of an analysis that took into account, for each category:
•Total number of deaths and injuries
•Historical trend in the number of deaths and injuries (some categories show reduction
trends lower than others, or even increase of trends)
•Comparison with the situation in other European countries
•Specific level of risk (per unit of trip)
The analysis have led to the identification of the following categories:
•Pedestrians
•Motorcycle and moped riders
•Cyclists
•Work related traffic injuries
In addition, due to their important social value Children (0-14 years)
Vision zero
General Directorate of Road Safety 17NUMBER (%) OF FATALITIES AND INJURIES IN 2013 PER TYPE OF ROAD
Urban roads
Motorways
Rural roads
% Fatalities % Injuries
General Directorate of Road Safety 11VULNERABLE ROAD USERS: Pedestrians, Cyclists, Motorcyclists
• The distribution of fatalities
shows that 49% are
vulnerable road users
• The majority of fatalities
occurred on urban roads
General Directorate of Road Safety 12PNSS Horizon 2020: Definition of the Specific Targets
To set the specific targets both the historical series of accident data for each category,
and the trends and fatality rates of the risk groups in Countries having the highest safety
levels have been considered
Category of users at risk Reduction
Target
1 - Children (0-14 years) -100%
2 – Powered Two Wheelers -50%
3 - Cyclists -60%
4 - Pedestrians -60%
5 – Work related traffic injuries -50%
General Directorate of Road Safety 19SOME MAJOR RISK FACTORS
• Speed: is a risk factor in 30% of fatal accidents
• Use of alcohol and drugs
• Absence or not use of protection devices
Fatal accident risk
General Directorate of Road Safety 13PNSS Horizon 2020: Risk Factors associated with Higher risk
categories
Several specific risk factors are associated with each of the higher risk categories
Fattori di rischio
Mass and shape of vehicles
Stanchezza, stress, distrazione
Fatigue, stress, distraction
use of di
ambientalifactors
Massa e forma dei veicoli
protective equipment
dispositivi
Mancanza di esperienza
Lack of experience
drugs
Environmental
droghe
Absent or not
Vulnerabilità,
Alcholeand
protezione
Visibility
Visibilità
Velocità
Speed
Fattori
Alcool
Categorie a rischio
11 -–Children
Bambini(0-14
(finoyears)
a 14 anni) X X X
22 –– Powered
2 Ruote Two Wheelers
a motore X X X X X X X
33 -–Cyclists
Ciclisti X X X X X X X
4 – Pedoni X X X X X X
4 - Pedestrians
5 – Utenti coinvolti in X X
5incidenti
– Work related traffic injuries
in itinere
General Directorate of Road Safety 20PNSS Horizon 2020 - Example: Specific Strategies for Cyclists
Strategy Why?
Speed reduction in urban areas To reduce the (high) injury risk for cyclists
Information campaigns Tackling risk behaviors such as alcohol and drug use during
driving, non-use of protective systems, compensation of the
lack of experience and awareness on correct behaviors at
level crossings for cyclists.
To raise awareness of car drivers to purchase vehicles safer
for vulnerable road users
Protection for vulnerable road users To increase the visibility and protection of cyclists
(infrastructure)
Research / legislation Need to introduce new rules for better visibility of cyclists and
for the mandatory use of protective systems
General Directorate of Road Safety 21PNSS Horizon 2020 – Measures
• One or more measures have been identified for each strategic line. The
selection of the measures was based on:
• International Good Practices
• Measures financed by the previous Plan found to be effective
• For each measure, specific indicators have been defined to monitor the
achievement of the specific objectives
• For each measure identified, a “Measure file” that provides information on
the effectiveness of measures and examples of application have been
carried out, useful as a reference in the implementation phase of the Plan.PNSS Horizon 2020 – Example of Measure files
Linea Strategica 9
Linea Strategica 3 Gestione della sicurezza delle infrastrutture stradali
Aumento dei controlli
Attività di Valutazione di Impatto sulla Sicurezza
Azioni per contrastare il mancato uso dei sistemi di Stradale (VISS) su infrastrutture appartenenti alla rete
ritenuta sia per gli adulti che per i bambini principale e non
• Sarebbe opportuno definire un progetto dettagliato
della campagna che includa la preparazione, la Le Linee Guida per la gestione della sicurezza delle
realizzazione e il monitoraggio della campagna infrastrutture stradali del MIT la prevedono per tutti i
stessa “progetti di infrastruttura” che comportino effetti sui
• L’enforcement sull’uso delle cinture di sicurezza può flussi di traffico. La VISS:
avvenire attraverso postazioni di controllo con • è effettuata durante lo studio di fattibilità o durante
agenti opportunamente formati a condurre verifiche la redazione del progetto preliminare, ai fini
sull’uso (corretto) delle cinture di sicurezza e dei dell’approvazione di quest’ultimo.
sistemi di ritenuta per bambini. • consente di analizzare i diversi effetti in termini di
• Tali azioni hanno la funzione di incrementare l’uso sicurezza stradale per la porzione di rete stradale i
dei sistemi di ritenuta cui flussi sono influenzati dalle diverse alternative
progettuali.
• Sarebbe opportuno integrare la campagna di
enforcement con una campagna informativa
Efficacia
Efficacia La VISS si è affermata a livello internazionale come una
La ricerca evidenzia un incremento dell’uso delle cinture buona pratica nella gestione della sicurezza delle
del 21% durante il periodo delle campagna di infrastrutture. La sua efficacia dipende, dalle condizioni
enforcement e del 15% nel periodo successivo. L’effetto pre-intervento della rete stradale e dall’intervento
principale sull’incidentalità è una riduzione della gravità proposto.
degli incidenti stradali in termini di persone gravemente
ferite o decedute.
Fase 1 Fase 2
Ambito Categorie di utenza coinvolta
Ambito Nazionale/Locale Tutte
Categorie di utenza coinvolta
Locale
Tutte
General Directorate of Road Safety 22WORK IN PROGRESS
• Comprehensive reform of the Highway Code: the Council of Ministries of July 26
2013 approved a bill to reform the Highway Code that goes towards the elaboration
of a “lighter code“ including (both in terms of drivers than of state powers towards
road owners and managers):
General principles
Prescriptions about behaviors
Sanctions
• The activities for this reform will be an opportunity for the introduction of measures
aimed at improving road safety
General Directorate of Road Safety 23AND MORE...
• Full automation and computerization of the process of accident data collection
from national and local police forces. The process started with the Carabinieri police
body. Integration with other information currently available in the databases of the
Department of Transports: database of drivers and database of vehicles. Moreover it
will be developed a link between hospital data and database of drivers .
• Testing the actual effectiveness of Advanced Safe Driving Courses on road safety:
The Ministry has promoted an agreement with the Centers that organize these
courses
The trial will finish at the end of 2014
• Monitoring of the implementation of regional and local road safety programs and
interventions of the PNSS 2001-2010: results obtained through evaluation of
effectiveness / efficiency in order to allow the identification of best / good practices
in different sectors
General Directorate of Road Safety 24THANK YOU FOR YOUR ATTENTION
General Directorate of Road SafetyYou can also read