Journal Investment - Cantor Fitzgerald Ireland
←
→
Page content transcription
If your browser does not render page correctly, please read the page content below

June 2018
    Investment
    Journal

       Featured this Month:
       Core Equity Portfolio: The investment case for
       our preferred names

       Stockwatch: Our views on Vodafone and Vinci

       Core Funds Range: Latest updates on our
       range of investment funds, ETFs & trusts

       Ethical Investing: Green Effects providing
       sustainable investment returns

       Trading Calls: We see value in Coca Cola,
       Adidas, ASML and Tullow Oil

       Investor Interview: Bertrand Cliquet, Lazard
       Asset Management Limited

                                                                                                        R

Cantor Fitzgerald Ireland ltd (Cantor) is regulated by the Central Bank of Ireland. Cantor Fitzgerald
Ireland ltd is a member firm of the Irish Stock Exchange and the london Stock Exchange.
Cantor Fitzgerald
          a global presence with local expertise

                                                                                Moscow

    north aMeriCa                                                                                                       asia
              Atlanta                                                                                                   Beijing
        Birmingham                                                                                                      Hong Kong
              Boston                                                                                                    Singapore
            Chicago                                                                                                     Seoul
               Dallas                                                                                                   Tokyo
              Denver
            Houston                                                                        Dubai
           Las Vegas
        Los Angeles       Central &
           Memphis            south
               Miami        aMeriCa                                             Tel Aviv
      New York (HQ)            Bogota                      europe
         Puerto Rico      Mexico City                      Cork
       San Francisco    Rio de Janeiro                     Dublin            Johannesburg                             Sydney
              Seattle       Sao Paulo                      Limerick
             Toronto                                       Copenhagen
                                                           Istanbul
                                                           London
                                                           Paris
                                                           Geneva

                                           Cantor Fitzgerald Ireland is part of leading global financial services firm Cantor
                                           Fitzgerald. With a proud history of stockbroking and servicing our clients in Ireland
                                           since 1995, Cantor Fitzgerald Ireland provides a full suite of investment services,
                                           primarily in personalised share dealing, pensions and wealth management, debt
                                           capital markets and corporate finance. We are recognised as a primary dealer in
                                           government bonds. our clients include private individuals and corporate entities,
                                           financial institutions, investment funds, credit unions and charities.
                                          Cantor Fitzgerald, a leading global financial services group at the forefront of
           financial and technological innovation has been a proven and resilient leader for over 70 years. Cantor is a
           preeminent investment bank serving more than 7,000 institutional clients around the world, recognised for its
           strengths in fixed income and equity capital markets.
           at Cantor Fitzgerald Ireland we pull together the expertise and experience of analysts and investment professionals
           from across three continents. an office network that spans from new York to Hong Kong provides us with a uniquely
           global perspective on the investment goals of our clients, which we service through our local offices in Dublin, Cork
           and limerick.

           www.cantorfitzgerald.ie

2   Cantor FItzgerald Ireland InvEStmEnt Journal June 2018
Contents
      Welcome                                                                        4

      asset allocation                                                               5
      Asset Allocation                                                               6
      Core Portfolio                                                                 9
      Chart of the Month                                                            12

      Investment opportunities                                                     13
      Stock Watch
          Vodafone                                                                  14
          Vinci                                                                     15
      Core Investment Funds                                                         16
      Core ETFs & Trusts                                                            18
      Trading Calls                                                                 20
      Interview                                                                     21
      Green Effects Fund                                                             23

      latest news                                                                  25
      Market Round-Up                                                               26
      Corporate Finance News                                                        28

      Performance data                                                             31
      Investment Returns                                                            32
      Long Term Investment Returns                                                  33
      Bond Returns                                                                  34

                                Cantor FItzgerald Ireland InvEStmEnt Journal June 2018   3
WelCoMe...
                            The old maxim “Sell in May, Go Away” is a well-known idiom in financial markets. Though it does not
                            always hold true, historically it has paid off more times than not. This time it was different. Equity
                            markets had been weak in the lead-in to May driven by a substantial tick up in volatility in 2018 relative
                            to 2017. May actually started off well with some conciliatory signs on tariffs and a retracement in bond
                            yields globally. However the end of May saw the “Italian Job” in full effect.

                            “i am not interested in preserving the status             a tale of two halves
    William Heffernan,      quo, i want to overthrow it”
    Senior Investment                                                                 as we move into the second half of the year it is
    Analyst                 niccolo machiavelli may have lived over five              a good time to take stock of the year so far. Firstly,
                            hundred years ago but his ideas and political             as we had expected, 2018 has seen the return of
                            thoughts still resonate today in Italian politics.        volatility with a bang. So far in 2018 the S&P has
                            Italy has a long and colourful history of political       had 33 days with a move larger than 1%. the
                            turmoil, unstable coalition governments and               equivalent number for all of 2017 was 8. the vIX
                            untimely elections. after the premature departure         has gained more than 30% 4 times this year with
                            of matteo renzi in December 2016, a reformist             the average level at 19. For the whole of 2017 the
                            beloved by the Eu and financial markets, recent           comparable numbers were 3 times and 12. the
                            Italian elections resulted in a proposed coalition        underlying causes of this volatility have varied but
                            government between the league (right-of-                  in general have rotated around tariff threats,
                            centre, anti-establishment, anti-Eu) with the 5           weaker global growth (particularly in Europe) and
                            Star      movement           (left-of-centre,     anti-   significant bi-directional movements in bond
                            establishment, anti-Eu). In the last week of may          yields. all have contributed to spooking equity
                            their attempt to form a government was                    investors at various points this year. this picture
                            scuppered by the Italian President, Sergio                is vastly different from where we stood at the end
                            matarella, who rejected their nomination for              of 2017. at that point in time the story was one
                            Finance minister, Paolo Savona, an avowed anti-           of synchronised global growth, with European &
                            Euro disciple. all of this turmoil resulted in a major    Em economies joining in, excellent earnings
                            move up for Italian bond yields, a widening in            growth and no political volatility. We expect this
                            general periphery spreads and a substantial               trend of volatility to continue for the remainder
                            compression in core yields as investors sought            of the year. uS tariff exemptions are scheduled to
                            safety in bunds. Equities felt the effects too with       run out over the next month or so and rhetoric is
                            European equities in particular feeling the brunt.        likely to be dialled up if China or Europe pushes
                            Despite forming a government, the coalition is            back on uS demands. there are also mid-term
                            fragile and a second election may occur in the            elections in the uS in november with the
                            near future. this could result in voters moving           increasingly likely possibility that the republicans
                            back to centre parties. However, it is also possible      lose control over both houses. Expectations for
                            that this is portrayed as a further sign of the           Fed and ECB hikes have been pushed out further,
                            establishment not listening to the will of the            which should act as a support for equities. But as
                            people, resulting in an increased backlash.               we highlighted at the beginning of the year, 2018
                            adding to the volatility was the removal of               is set to be the year where stock picking comes
                            Spanish Prime minister mariano rajoy. So far we           back to the fore.
                            have not seen much contagion from this to other
                            periphery countries. But if the situation drags on,
                                                                                      William Heffernan,
                            it is unlikely to be positive for equities. In the
                                                                                      June 2018
                            medium term it may influence the ECB decision
                            to stop QE this September and could ultimately
                            influence Fed policy, who would be adverse to
                            moving rates up an accelerated pace while
                            anxiety abounds in Europe.

4     Cantor FItzgerald Ireland InvEStmEnt Journal June 2018
asset
allocation
                                June 2018

     Asset Allocation                              6
     Core Portfolio                                9
     Chart of the Month                           12

Cantor FItzgerald Ireland InvEStmEnt Journal June 2018   5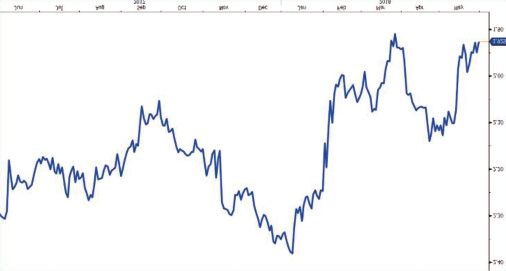
aSSEt alloCatIon

    asset alloCation
                               How we’re positioned
                               our current asset allocation is reflective of our outlook across the various asset classes, detailed below.
                               It is based on a medium risk investor of middle age.
                               For any investor who applied the adage of ‘Sell in may and Go away’ to their portfolio, they would be
                               left ruing the wisdom of their actions. as explicitly outlined in our may Investment Journal that ‘We
    David Beaton,              maintain our current exposure to risk assets’, Cantor clients would have benefitted from the average
    Chief Investment           4% returns generated by global equity markets during may.
    Officer
                               these gains were achieved as a result of a number of factors which we highlighted last month as
                               being critical for market direction. these included uS earnings season, uS/China trade tensions and
                               critically any move in uS bond yields.
                               regarding the uS first-quarter earnings season, the year-on-year growth rate of 24.5% marked the
                               strongest quarter since Q3 2010. While this was a particularly impressive result, it did raise the question
                               as to sustainability of this rate of growth in the remaining quarters of 2018. accordingly, the market
                               reaction was somewhat muted suggesting that a lot of the good earnings news was already reflected
                               in uS equities, which while positive on the month, underperformed their European counterparts.
                               also providing solace for investors during may was the about turn in trade hostilities between the uS
                               and China. Following negotiations between representatives from both the uS and China, the risk of a
                               trade war had in the words of uS treasury Secretary mnuchin “been put on hold”. While the exact
                               meaning of this was not clarified by either party, this détente at least defuses, for the time being, a
                               situation that had the potential to escalate into a globally damaging dispute. as a result equity markets
                               breathed a massive sigh of relief which was reflected in a firmer tone into month end.
                               more impressively during the month, financial markets withstood the risks posed by a substantial
                               increase in uS bond yields and the spectre of a renewed crisis in Europe.
                               Since the start of February, uS bond yields had been increasing as expectations for higher uS interest
                               rates increased despite a slight softening in some economic data releases. While the move higher in
                               yields was appreciable, the fact that until may the yield on the uS 10-Year note had failed to breach
                               the psychological 3% level, supported equity markets. During may however the 3% level was surpassed
                               with yields hitting a 13 year high of 3.11% however after a brief period of weakness, risk assets
                               remained resilient.
                               Closer to home, another risk for markets emerged in the shape of political uncertainty in Italy, which
                               saw Italian 10-Year Bond yields increase to 2.33% from 1.79% at the start of the month. the formation
                               of an anti-euro, anti-European coalition government led by a politically inexperienced university
                               professor, coupled with threats to break Eu fiscal rules unsettled investors in Italian assets (equities
                               and bonds). as the third largest member of the euro-zone, but critically the most indebted primary
                               member, the prospect of a new euro-zone crisis is something that needs to be monitored closely.
                               For the moment however, the issue is being perceived as an Italian-specific one with little contagion
                               to other periphery member states such as Spain or Portugal. as a consequence, European equity
                               markets (ex-Italy) registered impressive gains during the month boosted by some weakness in the
                               euro.
                               the key focus for markets in the month ahead will be the uS Federal reserve meeting on 12th & 13th
                               June at which the uS central bank is expected to increase interest rates by another 0.25% which would
                               represent the 7th such increase since it ceased its QE programme in october 2014. of particular
                               interest will be comments from Chair Jay Powell about the outlook for inflation which will provide
                               clues as to the pace of any further rate increases. any indication that the pace of tightening will quicken
                               in the coming quarters could place further upward pressure on bond yields (lower prices) and
                               downward pressure on equities.

6     Cantor FItzgerald Ireland InvEStmEnt Journal June 2018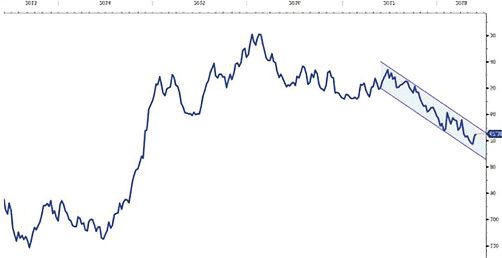
Equally the ECB meeting on 14th June will be watched carefully. While no changes in policy will be
announced, the meeting is expected to provide the platform for updated economic forecasts which
in turn may give some clues as to the timeframe or strategy for an exit from QE.
the final focus point on the month will be the Eu Council of ministers meeting on 28th & 29th June
at which the key issue of the Irish border in the context of Brexit will be discussed.

Our Views
equities
We were impressed last month by the ability of equity markets to withstand the move higher in uS
bond yields above a level (3%), a level at which most commentators expected an equity market sell-
off. While the move higher in uS bond yields is worrying from an equity market perspective, other
key bond market indicators remain favourable for risk assets. In particular, the yield differential
between uS 10 Year notes and High Yield debt remains contained at 3.35%. By way of comparison,
at the time of the last pronounced market sell-off in the first quarter of 2016, this spread stood at
close to 9%.
Equally, equity markets were boosted by the moderation in tensions between the uS and China
over a possible trade war which had the potential to spread into a full-blown global trade war. While
the news of a truce is to be welcomed, there is a risk that this matter could re-emerge later in the
summer should China fall short of uS expectations and fail to increase the level of uS purchases.
In recent presentations we have been giving to certain client groupings, we have been highlighting
the fact that the uS economy is, in our opinion, at the late stages of the economic cycle compared
to Europe which is arguably in mid- to late-mid cycle. this view on the uS economy is based on the
fact that unemployment is approaching all-time lows, m&a is at multi-year highs, credit conditions
are tightening and uS equity markets, despite multi-year high earnings growth still look expensive
relative to Europe in particular.
While these late-cycle signs warrant close monitoring we remain constructive on the economic
outlook for the next number of quarters and we therefore remain positive on risk assets overall. We
do however continue our preference for Europe over the uS but appreciate that Brexit related risks
and the political situation in Italy are risk factors that need to be considered.
Equally, central bank policy action in the uS will be a critical for the continued positive performance
in equity markets. any suggestion of a faster than expected pace of monetary tightening has the
potential to move bond yields higher which could have a detrimental impact on equity markets.
notwithstanding these potential risks we maintain our current overweight allocation to equities as
we near the half-way point of the year. In particular we favour technology, Industrials, materials,
Infrastructure, Consumer Discretionary and Financials.
Bonds
the focus in bond markets during may was on the uS and Italy as yields on the respective bonds
saw moves higher but for differing reasons. In the uS the move higher to an intra-month high of
3.11% from an end-of-april level of 2.95% was the result of expectations for a total of four interest
rate increases from the Federal reserve during 2018. While economic data remains positive, it has
started to show signs of softening in recent weeks, so we maintain of the view that there will be
just three rate increases in total this year and we therefore see uS yields drifting below their month-
end closing level of 2.85%.
the focus on Italian bond yields was the result of the establishment of an anti-euro, anti-European
coalition which has threatened to implement fiscal policies that will breach Eu fiscal rules. as the

                                       Cantor FItzgerald Ireland InvEStmEnt Journal June 2018             7
aSSEt alloCatIon

    asset alloCation                                                                          ContInuED

                                third largest economy in the single currency bloc, and with the second highest debt to GDP level
                                (only Greece is worse), the risk of political and fiscal instability in the country was poorly received by
                                markets. For the moment this is very much an Italian story with little or no collateral impact on other
                                Eu member states, however it is a development that needs to be monitored closely in the coming
                                weeks and months.
                                Given the increased volatility in yield moves across the sovereign bond spectrum, we remain
                                underweight sovereign debt and maintain our preference for corporate debt.
                                Currencies
                                the rally in the uS dollar which commenced in april, continued during may with the euro/uS dollar
                                cross moving below the 1.18 level. this continued move higher in the ‘greenback’ was prompted by
                                increased expectations for an additional three interest rate increases by the uS Federal reserve
                                following a drop in the unemployment rate to 3.9%. also impacting the move higher in the uSD
                                were dovish comments from ECB President mario Draghi following some softer Eu data prints.
                                While market expectations for three further rate hikes in the uS (in June, September and December)
                                have increased, we continue to forecast just two more increases in June and September as we see
                                the move higher in uS bond yields and tighter credit conditions acting as headwinds for the uS
                                economy, thereby removing the necessity for a third increase.
                                accordingly, we see the recent rally in the uS dollar as largely completed, while an increasing focus
                                on the uS deficit along with political uncertainty ahead of the november mid-term elections will
                                also act as dollar headwinds. allowing for the recent rebound in the uS dollar, we now see the
                                currency trading in a range of between 1.18 and 1.22 over the coming quarters against the euro.
                                regarding euro/sterling, we maintain our negative sterling bias predicated on the continued lack
                                of resolution to the Irish border issue in the uK’s talks with the Eu, a further deterioration in uK
                                economic data releases which has all but eliminated the possibility of an interest rate increase in
                                2018, and ongoing friction within the Conservative Party.
                                We maintain our call for a move lower in sterling during 2018 to the 0.92/0.93 level.
                                Commodities
                                oil: oil (Brent crude), enjoyed its third month in a row of gains adding 6% during may to $80 a barrel.
                                as highlighted in our may Journal comment, the focal point for oil markets in may would be the
                                decision on the ongoing participation in the Iran nuclear agreement by the uS. Despite
                                protestations by the other co-signatories to the agreement (France, Germany, uK, China and russia)
                                President trump was true to his word and withdrew the uS from the agreement. While not dead in
                                the water, uncertainty over Iran’s future access to oil markets saw crude prices continue their assent.
                                also adding upward pressure to oil was supply disruption from venezuela as political uncertainty
                                intensified.
                                While this move to a 2018 high for the commodity leaves our year-end target range of $60 to $70
                                off-side, we remain of the view that increased supply from the uS as well as a potential move by
                                Saudi arabia to take up any slack from an Iranian shortfall will see oil prices moderate during the
                                summer months. We have already seen some evidence of this with oil retracing on the news that
                                Saudi arabia and russia may be increasing production to counterbalance any shortfall.
                                Gold: the precious metal declined 2% during the month to bring the pull-back from its 2018 high
                                to 5%. the continuing trend of subdued inflations across major economies coupled with recent
                                dollar strength and higher uS bond yields have all weighed on the commodity. We maintain our
                                neutral stance on the commodity and see limited upside potential in the absence of higher inflation
                                or a significant geo-political event.

8    Cantor FItzgerald Ireland InvEStmEnt Journal June 2018
aSSEt alloCatIon

Core portFolio 2018
                   Equity markets enjoyed a positive performance during May as an easing of trade tensions between
                   the US and China, coupled with a more conciliatory tone between the US and North Korea
                   supported ‘risk-on’ sentiment. Equally, an impressive reaction by equity markets to higher US bond
                   yields added to a more positive market dynamic. This was reflected in a positive performance for
                   our Core Portfolio which gained 3.8% during the month, leaving the year-to-date performance
                   showing a gain of 6.4% compared to a gain of 2% for the portfolio benchmark. The Cantor Equity
                   Core Portfolio is a collection of our preferred equity names in the US, UK and Eurozone and is
David Beaton,
                   benchmarked against leading indices in each region. The return of the portfolio and the benchmark
Chief Investment
                   are calculated in euro terms which include dividends. The portfolio has enjoyed substantial annual
Officer
                   returns since its inception, as highlighted in the table below.
                   the positive performance on the month was due to a number of very strong performances by a number
                   of our portfolio constituents. amongst these were oil and gas group royal Dutch Shell which
                   maintained its strong year-to-date performance by gaining 2.9% as uncertainty about Iranian and
                   venezuelan oil supply forced benchmark crude oil prices higher. also contributing to the positive
                   monthly performance was a strong performance from insulation and panels group Kingspan which
                   enjoyed a gain of 5.6% while CrH gained 7.08% on continued positive reaction to its recently
                   announced €1bn share buyback programme.
                   the uS technology holdings in the Core Portfolio registered positive returns with the best performing
                   of these being amazon and PayPal Holdings which gained 4.05% and 10% respectively.
                   Elsewhere in the portfolio there was a strong performance from airline group ryanair which gained
                   5.38% despite the almost customary attempts by CEo michael o’leary to talk-down the outlook for
                   fares and profitability.

                           Year                Core portfolio returns                 s&p         eurostoxx50       uK index
                           2014                            15.60%                    29.60%           4.90%           7.90%

                           2015                            14.00%                    12.30%           7.40%           -1.40%

                           2016                            1.66%                     15.34%           4.83%           2.85%

                           2017                            8.10%                      6.98%           9.95%            7.6%

                   *Total Returns in € terms. *Source: CFI Research / Bloomberg

                                                                          Cantor FItzgerald Ireland InvEStmEnt Journal June 2018   9
Core portfolio at 31st May 2018
Closing price total return euro (%) Fwd p/e div Yield
stocks
31/05/2018 Year to date FY1 (x) FY1
Glanbia 15.84 4.4% 18.5x 1.5%
aIB 4.674 -11.7% 13.3x 3.1%
ryanair 16.345 9.8% 14.0x 0.6%
Inditex 27.01 -5.7% 24.0x 2.9%
lloyds 63.21 -6.4% 8.6x 5.3%
Bank of Ireland 7.07 3.2% 12.0x 2.8%
allianz 199.35 -6.0% 10.4x 4.8%
iShares European Bank EtF 18.47 -7.5% 11.8x 4.4%
Facebook 191.78 8.7% 22.5x 0.0%
PayPal 82.07 11.5% 35.1x 0.0%
alphabet 1100 4.4% 21.4x 0.0%
amazon 1629.62 39.3% 79.7x 0.0%
Smurfit Kappa 35.4 25.6% 14.4x 2.7%
Siemens 122.5 -3.0% 15.1x 3.4%
CrH 31.6 6.9% 15.9x 2.2%
Kingspan 39.6 9.3% 22.1x 1.0%
royal Dutch Shell 2677 7.6% 13.5x 5.2%
DCC 7215 -2.5% 19.7x 1.9%
GlaxoSmithKline 1524 15.4% 14.4x 5.2%
vinci 83.72 -0.1% 16.0x 3.1%
Current Price as at 31/5/2018. Source: Bloomberg. *SIP = Since Inclusion in Portfolio
Cantor Core Portfolio Return 6.40%
Benchmark Return 2.00%
Relative outperformance 4.40%
10 Cantor FItzgerald Ireland InvEStmEnt Journal June 2018Cantor Core portfolio in brief
Below we give a brief overview of the investment case for our Core Portfolio names.
siemens Facebook amazon GlaxosmithKline
Siemens are currently engaged in a With over 1.2 billion users per day Facebook We added amazon to our equity core GlaxoSmithKline remains one of the more
restructuring program entitled “vision 2020” is at the cutting edge of the continued shift portfolio on February 21st with a 5% attractive stories within the Pharma space
which we believe will revolutionize their of advertising budgets to mobile and online weighting. the company holds a dominant in our view. In the wake of its asset swap
business model. they have already begun platforms, where advertisers can obtain position within the rapidly growing online deal with novartis, the company is better
to spin off some of their lower margin superior impact from each dollar spent. In retailing space, while also expanding its diversified, exposed to attractive growth
businesses. this streamlined model will be addition, the company has a suite of other Cloud Computing business and media areas, in particular vaccines and HIv
more effective in terms of cost control and businesses which have yet to be monetised entertainment unit. We see substantial treatments.
margin generation in the future. fully, thereby offering ample growth for the further upside for the stock and view its
management has guided optimistically for next 10 years and beyond. valuation of 20.6x FY17e Ev/EBItDa as
the remainder of 2017. attractive
paypal alphabet allianz royal dutch shell
PayPal is the leading name in the mobile alphabet, the parent company of internet one of Europe’s leading insurers, allianz is Shell’s management are in the process of a
payments space – an area which we expect giant Google is the number one online benefitting from the recent rise in global multi-year pivot of operations toward
will continue to gain prominence in coming advertising company in the world. Google bond yields which boost its investment natural gas and away from crude. the
years. the company has established a generates 98% of revenue from advertising returns and help balance the company’s company is on target to complete $30
position throughout the variety of areas on both its Search website and Youtube. liabilities. allianz recently announced a €3 billion worth of disposals by 2018, aiding
where consumers need to exchange tight cost controls and innovative billion share buyback programme and the this transition and dramatically improving
money, like point-of-sale, online check-outs, development of new technologies should dividend yield of 4.9% remains well covered Free Cash Flow. this should support the
and consumer to consumer. help maintain alphabet at the top of the and attractive. maintenance of the attractive dividend,
internet-based industry for many years to which offers an expected yield of 6.9%,
come. despite the continued depressed oil price.
aiB inditex stoxx 600 Banks etF Crh
We recently replaced verizon with aIB Inditex’s short lead time model gives it European financials have already rallied this CrH is one of the world’s leading cement
which further increased our overweight numerous competitive advantages over its year as data has improved but we believe companies and is primed to benefit from
allocation to financials. aIB is Ireland's peers which have become increasingly the sector can move on further after years any increase in infrastructure spending on
largest mortgage provider with a strong important as consumers move their of underperformance. With the decline in behalf of the trump administration. Its
capital position and a dividend policy in purchasing online. Inditex has managed this political risk stemming from the French and greater revenue exposure to the uS than
place. shift very well and have continued to Dutch elections, European yields should peers should allow it outperform in the near
increase margins and sales when their peers move higher due to the better economic term supported by the strong uS housing
are struggling. We would expect Inditex to data and higher inflation. Banks should market and potential trump policy.
maintain this trend going forward. profit in such circumstances.
dCC Glanbia Vinci Kingspan
DCC is one of Europe’s leading fuel suppliers Post the spinoff of Glanbia’s Dairy Ireland vinci is a market leader in the European Kingspan is set to benefit from the on-
with a historical capacity for accretive m&a business, its two remaining wholly owned infrastructure space and the ideal way to going structural shift towards more energy
growth. the excellent management have businesses, Glanbia Performance nutrition play the ongoing European economic efficient construction in commercial and
proved multiple times in the past they are (GPn) and Glanbia nutritionals (Gn) are recovery. vinci owns infrastructure assets residential real estate. It remains a high
capable of adding value through m&a with both high margin and operate within high across Europe including toll roads, rail and conviction multi-year growth story in our
superior execution and integration skills. growth segments of the food sector. airports. these are likely to see increased opinion which currently trades at 19x FY17e
this has led to consistent earnings Glanbia has a strong balance sheet and has traffic in coming years. vinci is also likely to earnings. It is a highly cash generative, with
upgrades over the past few years and we significant firepower to grow earnings see earnings upgrades due to new contract a strong balance sheet and a very
would expect this trend to continue. through accretive bolt-on acquisitions. wins and m&a. . experienced management.
smurfit ryanair Bank of ireland lloyds
Despite the recent positive re-rating in ryanair remains the lowest cost operator a rising yield environment helped by lloyds’ FY16 results came in ahead of
Smurfit in 2017, it still trades at an within the European low Cost Carrier (lCC) reducing political risks in Europe is a market expectations across nearly all
unjustifiable discount relative to its closest sector, which gives it a competitive supportive backdrop for European financial metrics and management were
peers, mondi and DS Smith in our opinion. advantage on fares, and should enable it to financials. Bank of Ireland should re-instate positive on the outlook for 2017. lloyds is
It announced price increases in 2017, due capture market share from less efficient a dividend in 2018 relating to 2017’s now a more simplified, low risk, uK focused
to rising raw material costs and strong operators in Europe. It currently trades at financial year as asset quality continues to bank and the asset quality of the bank
demand which should protect operating just 12.2x FY18e earnings, which we view as improve, as its capital base strengthens, and remains very strong despite of Brexit risks. It
margins. It trades at 12x FY17e earnings and attractive given the airline’s ambitious as mortgage lending growth picks up. It has a strong capital base, offers investors a
offers a dividend yield of 3.3%. growth plans under the best-in-class currently trades at just 0.83x FY17e Price/ 5.4% dividend yield and trades at 1.07x
management team. Book. FY17e Price/ Book.
Cantor FItzgerald Ireland InvEStmEnt Journal June 2018 11aSSEt alloCatIon
Chart oF the Month
reaching Boiling point?
Over the past year oil has appreciated by circa 70%, as Brent moved above $80 a barrel and WTI
moved above $72. We are now a long way from the ultra-low oil price environment of late 2015,
early 2016. We can attribute this upward momentum to the simple fundamentals of supply vs
demand. With global growth remaining strong, the ball is well and truly in supply’s court.
Dave Fahy,
Investment Analyst there have been a myriad of supply factors pushing prices up in the past year. oPEC’s production
cuts, introduced at the end of 2016, have been explicitly followed to the letter. adding to this certain
members face their own headwinds in maintaining production levels. Iran is the most obvious
example. last month mr trump decided to reinstate sanctions on what is one of the largest oil
producing nations in the world. as a consequence international companies will face penalties from
doing business with Iran. We anticipate a loss of 500k barrels a day (b/d) by next year. venezuela is
having an even greater effect on supply levels. Political and economic turmoil under the President
nicolas maduro has sent oil production from over 2m b/d a year ago to circa 1.5m b/d today, with
estimates that this will fall to 1.2m by year end. this downward trend does not look like abating
anytime soon as the probability of an all-out collapse increases. as anticipated these higher prices
have led uS shale producers to turn on taps with rig counts and overall production rising quickly.
We anticipate that it will increase by over 1.2m b/d this year and a further 1.5m b/d in 2019. However
this is not sufficient to offset the lost supply and the rising demand. at the Permian basin, which is
on course to become the largest oil patch in the world, transportation infrastructure is at max
capacity with development not likely until the back end of 2019. this is also driving the spread
between Brent and WtI. Finally adding to supply concerns is the fact that the International maritime
organisation is introducing regulation which will require the use of less sulphur rich oil by 2020.
So where do we see oil going from here? oPEC and non oPEC ministers will meet on the 22nd of
June. With importing nations vocal against rising prices, Saudi arabia has already hinted oPEC
production will increase, possibly by 1m b/d, in order to offset lost production. the Saudis have
previously cited $80 (Brent) as a favoured price, particularly given the potential IPo of Saudi aramco.
russia among others has spoken about $60 being fair value. regardless the major producers need
to avoid stymieing demand. We maintain our original outlook of between $60 and $70 (WtI), albeit
with a bias towards the upper end, with volatility remaining high. We would also expect the Brent-
WtI spread to remain elevated.
oil priCe
Source: Bloomberg as at 30/05/2018
12 Cantor FItzgerald Ireland InvEStmEnt Journal June 2018Investment
opportunities
June 2018
Stock Watch
Vodafone 14
Vinci 15
Core Investment Funds 16
Core ETFs & Trusts 18
Trading Calls 20
Interview 21
Green Effects Fund 23
Cantor FItzgerald Ireland InvEStmEnt Journal June 2018 13InvEStmEnt oPPortunItIES
stoCKWatCh
Vodafone Current Price: 191.82 GBp
On the back of strong FY18 results and confirmation of the acquisition of Liberty Global’s (“LG”)
assets, CEO Vittorio Colao has announced he is stepping down in October. After spending a
decade transforming the business into a European focused converged telecoms provider, how
Pierce Byrne, CFA, does his exit affect the investment case for Vodafone?
Investment Analyst
While we believe mr Colao’s exit is a loss to the second factor to drive price action will be
vodafone, we don’t think it alters the strategy progress on the integration of the lG assets
significantly in the medium term. nick read, and progress of the merger of the Indian
the current CFo, has been part of the senior business. vodafone’s operational efficiency
management team in vodafone for the past has been outstanding over the past number
number of years and has been integral in the of years and continued progress on the
implementation of the strategic decisions integration of European operations, improved
thus far. an internal appointment is less likely margins based on its network quality and
to alter long term strategic decisions. speed as well as growth from its select global
exposure should provide incremental
the stock sold off on the back of the news
catalysts.
and has remained at sub 200p levels. there
have been limited catalysts post results to vodafone remains our favoured name in the
cause the price to rerate and with the stock telecoms space. the fundamental reason to
going ex-dividend in early June it is unlikely own vodafone remains its ability to generate
to move significantly prior to this. outside of cash flow that is paid out to shareholder. the
this there are two sources for a rerating. Firstly, stock is currently yielding close to 6% and as
telecoms will benefit from a cyclical rotation operations grow in Europe this should
into more defensive names as the business support further dividend growth paid from
cycle matures. While we see further upside in free cash flow.
equity markets, it must be acknowledged that
we are 9 years into a bull market.
VodaFone priCe
Source: Bloomberg. Prices as of 30/05/2018
14 Cantor FItzgerald Ireland InvEStmEnt Journal June 2018Vinci Current Price: €83.72
Vinci, the world’s largest infrastructure company, operates toll roads, airports, stadiums and
construction projects all over the world. Organic growth in airports and roads, coupled with a
buoyant French construction sector and ongoing reforms under President Macron, should drive
William Heffernan, double digit earnings growth along with its excellent balance sheet, high degree of operational
Senior Investment leverage and strong cash flow should also allow management to growth the business through
Analyst M&A.
after strong FY and quarterly results, there this generates 83% of revenue and 27% of
remains decent upside on vinci. It is currently EBItDa and is poised to benefit from an
trading at €83.70, implying 20% upside our uptick in European construction activity,
own price target of €101 and 14.3% to the especially in France due to the
Street price target of €95.68. the investment implementation of the Grand Paris Express
case for vinci remains robust. through its Program. overall EPS growth expectations
Concessions division (toll roads, airports, stand at 27.25% cumulatively for the next
railways and tunnels) it retains exposure to three years.
the European growth story. this segment
Further upside is possible in the medium
accounts for 17% of Group revenue but 72%
term. vinci is coming to the end of an above
of EBItDa and retains high degrees of
trend capex cycle. With capex declining and
operational leverage i.e. any growth in traffic
a very healthy balance sheet (FCF yield 7.3%,
goes straight to the bottom line. these assets
€7bn in cash and net debt/EBItDa under 2x),
are already built and have low maintenance
it is likely management will continue to
costs. It should also be noted that rates on
acquire assets. It recently acquired 12 airports
most of these assets are linked to inflation and
to add to its portfolio. management have also
that the revenue streams are also somewhat
confirmed that it intends to redistribute
defensive in nature, which will help in a
capital to shareholders which would imply
volatile environment. the other major
dividend increases (currently 3.1%) and
segment of the business is Contracting, which
potentially buybacks.
is its construction and engineering division.
VinCi priCe
Source: Bloomberg. Prices as of 30/05/2018
Cantor FItzgerald Ireland InvEStmEnt Journal June 2018 15InvEStmEnt oPPortunItIES
inVestMent Funds
our Core Funds range is a selection of funds that our investment committee feels could compliment
portfolios and enhance diversification. the Core Funds range offers investment options across
multiple asset classes and markets. Funds selected have undergone a comprehensive screening
process by our investment committee and are reviewed regularly.
Niall Sexton,
Core investment Funds
Portfolio Equity Funds
Construction Morningstar
SEDOL Name Risk Rating (1 - 7) Currency TER % Yield %
Rating!
Analyst Global Equity
B5TRT09 Veritas Global Equity Income !!
!! 5 EUR 1.13 3.71
European Equity
B9MB3P9 Threadneedle European Select !
!!
!!!
!!!! 5 EUR 0.83 0.98
UK Equity
B3K76Q9 J O Hambro UK Opportunities !!!!
!!
!
!!! 5 GBP 0.82 2.99
US Equity
BYR8HR0 Old Mutual North American Equity !!!!
!!!
!!
! 6 EUR 0.89 0.00
Bond Funds
SEDOL Name Risk Rating (1 - 7) Currency TER % Yield %
Corporate Bond
B3D1YW0 PIMCO GIS Global Investment Grade Credit !!
!!!
!!!! 3 EUR 0.49 3.25
Government Bond
0393238 BNY Mellon Global Bond !!!
!!
! 4 EUR 0.65 0.00
High Yield
B1P7284 HSBC Euro High Yield Bond !!!!
!!!
!!
! 4 EUR 1.35 2.83
Diversified Bond
B39R682 Templeton Global Total Return !!!
!!
! 4 EUR 1.44 7.40
Alternative Funds
SEDOL Name Risk Rating (1 - 7) Currency TER % Yield %
Absolute Return
BH5MDY4 Invesco Global Targeted Return - 3 EUR 0.86 0.00
BLP5S79 Old Mutual Global Equity Absolute Return - 4 EUR 0.81 0.00
B694286 Standard Life GARS - 4 EUR 0.90 0.00
Multi - Asset Allocation
BD6K5N2 M&G Dynamic Allocation !!
!!!!
!!! 4 EUR 0.93 0.65
Source: Bloomberg. Prices as of 31/05/2018.
16 Cantor FItzgerald Ireland InvEStmEnt Journal June 2018Fund performance
Equity Fund Performance
Name 1 Month % 3 Month % YTD % 1 Year % 3 Year % 5 Year %
Global Equity
Veritas Global Equity Income 3.13 4.60 0.72 -2.44 2.42 6.58
European Equity
Threadneedle European Select 2.63 3.25 1.21 2.31 2.83 9.48
UK Equity
J O Hambro UK Opportunities 2.33 7.44 2.26 0.29 5.41 7.22
US Equity
Old Mutual North American Equity 7.45 5.48 6.55 11.77 8.90 13.13
Bond Fund Performance
Name 1 Month % 3 Month % YTD % 1 Year % 3 Year % 5 Year %
Corporate Bond
PIMCO GIS Global Investment Grade Credit -0.41 -0.73 -2.40 -1.17 1.88 2.67
Government Bond
BNY Mellon Global Bond 2.55 3.15 2.01 -2.31 0.30 2.89
High Yield
HSBC Euro High Yield Bond -1.13 -1.26 -1.56 0.56 3.20 4.33
Diversified Bond
Templeton Global Total Return -3.72 -2.52 -2.79 -4.05 -1.12 -0.36
Alternative Fund Performance
Name 1 Month % 3 Month % YTD % 1 Year % 3 Year % 5 Year %
Absolute Return
Invesco Global Targeted Return -0.69 -1.19 -1.25 -3.78 0.10 -
Old Mutual Global Equity Absolute Return 0.21 0.44 2.19 9.10 5.13 4.96
Standard Life GARS -2.08 -3.92 -4.74 -3.80 -2.62 0.65
Multi - Asset Allocation
M&G Dynamic Allocation -1.82 -1.92 -1.03 3.44 3.48 6.36
Source: Bloomberg. Prices as of 31/05/2018.
Cantor FItzgerald Ireland InvEStmEnt Journal June 2018 17InvEStmEnt oPPortunItIES
etFs & trusts
our Core EtF and Investment trust range is a selection of active and passive collective funds which
are listed on primary exchanges. this range offers a selection of the listed investment options
available across multiple asset classes and markets.
Core etFs & trusts
Niall Sexton, Equity ETFs & Trusts
Portfolio
Ticker Name SEDOL Currency TER % Yield % UCITS
Construction
Analyst Global Equity
SDGPEX iShares Global STOXX 100 Select Dividend ETF B401VZ2 EUR 0.46 3.53 Yes
European Equity
SX5EEX iShares Euro STOXX 50 ETF 7018910 EUR 0.16 2.65 Yes
UK Equity
CTY City of London Investment Trust Plc 0199049 GBp 0.44 3.98 No
US Equity
SPY5 SPDR S&P 500 UCITS ETF B6YX5T0 USD 0.09 1.59 Yes
Emerging Market Equity
JMG JPMorgan Emerging Markets Investment Trust Plc 0341895 GBP 1.17 1.11 No
Bond ETFs & Trusts
Ticker Name SEDOL Currency TER % Yield % UCITS
Corporate Bond
IEXF iShares Euro Corporate Bond Ex-Financials ETF B4L5ZG2 EUR 0.20 1.37 Yes
Government Bond
IEGA iShares Core Euro Government Bond ETF B4WXJJ6 EUR 0.20 0.65 Yes
High Yield
IHYG iShares Euro High Yield Corporate Bond ETF B66F475 EUR 0.50 3.69 Yes
Commodity ETFs & Trusts
Ticker Name SEDOL Currency TER % Yield % UCITS
Precious Metals
SGLD Source Physical Gold ETF B599TV6 USD 0.29 0.00 No
Commodity
OILB ETFS 1 Month Brent ETF B0CTWC0 USD 0.49 0.00 No
Source: Bloomberg. Prices as of 31/05/2018.
18 Cantor FItzgerald Ireland InvEStmEnt Journal June 2018Fund performance
Equity Performance
Name 1 Month % 3 Month % YTD % 1 Year % 3 Year % 5 Year %
Global Equity
iShares Global STOXX 100 Select Dividend ETF 0.20 2.10 -0.35 1.05 3.09 8.49
European Equity
iShares EuroSTOXX 50 ETF -2.17 1.28 -0.62 -1.11 1.76 7.90
UK Equity
City of London Investment Trust Plc 2.12 7.00 0.93 3.19 5.82 7.99
US Equity
SPDR S&P 500 UCITS ETF 5.21 3.95 4.17 10.36 8.42 14.61
Emerging Market Equity
JPMorgan Emerging Markets Investment Trust Plc -0.69 -3.70 -2.78 10.05 13.20 8.28
Bond Performance
Name 1 Month % 3 Month % YTD % 1 Year % 3 Year % 5 Year %
Corporate Bond
iShares Euro Corporate Bond Ex-Financials ETF -0.23 -0.25 -0.51 0.36 1.55 2.68
Government Bond
iShares Core Euro Government Bond ETF -1.19 -0.05 -0.30 0.35 1.01 3.43
High Yield
iShares Euro High Yield Corporate Bond ETF -1.16 -0.54 -1.11 0.92 2.54 3.80
Commodity Performance
Name 1 Month % 3 Month % YTD % 1 Year % 3 Year % 5 Year %
Precious Metals
Source Physical Gold ETF -0.86 -1.31 0.33 2.46 2.78 -1.62
Commodity
ETFS 1 Month Brent ETF 5.89 21.42 21.29 59.21 -3.26 -11.42
Source: Bloomberg. Prices as of 31/05/2018.
Cantor FItzgerald Ireland InvEStmEnt Journal June 2018 19InvEStmEnt oPPortunItIES
tradinG Calls
Coca Cola adidas
management’s recent Capital markets Day was well received by adidas is the second largest sporting good company with
analysts with management guiding for annual 7-9% EPS growth leading market share in Europe & russia. It has increased its
over the next five years. It also highlighted its increased focus presence in the uS over the past 3 years, consistently taking
on cash flow discipline and revenue growth. Coca Cola is share off nike. It also has a significant presences in the high
pivoting towards no-calorie drinks with increased focus on growth markets of the future including China. recent results
flavoured water and Em markets. were strong and category dynamics remain in favour of adidas.
Current price: $42.68 Current price: €195.30
Buy in level: Current level Buy in level: Current level
exit level: $45.08 target exit level: €207.50
1 month 3 month Ytd 1 month 3 month Ytd
returns -1.23% -2.15% -6.97% returns -5.66% 5.69% 15.08%
p/e div Yield p/e div Yield
20.33x 3.59% 24x 1.58%
Bloomberg as of 30/5/2018. Prices as of 30/5/2018. Bloomberg as of 30/5/2018. Prices as of 30/5/2018.
asMl tullow oil
aSml is a leading chip manufacturing equipment maker tullow remains a high beta, leveraged play on oil. In the short
building lithography machines used by global semi-conductor term, movements in tullow’s stock price will reflect oil price
manufacturers. the company has a dominant and increasingly fluctuations. oil remains highly volatile as multiple factors are
patent specific share of the Euv lithography market which having an effect on the supply side. oPEC is due to meet on the
should lead to margin increases, high operational leverage and 22nd of June, with it looking likely production will increase,
continuing growth in margins however the extent is unknown. We expect WtI to be volatile,
remaining at the upper end of the $60-$70 range in the near term.
Current price: €169.30 Current price: £2.59
Buy in point: €158.00 - €160.00 entry level: £2.45 - £2.50
exit point: €171.00 - €173.00 target exit level: £2.70
1 month 3 month Ytd 1 month 3 month Ytd
returns 7.84% 4.78% 17.02% returns 10.89% 34.85% 22.22%
p/e div Yield p/e div Yield
29.72x 0.89% 12.81x 2.70%
Bloomberg as of 30/5/2018. Prices as of 30/5/2018. Bloomberg as of 30/5/2018. Prices as of 30/5/2018.
20 Cantor FItzgerald Ireland InvEStmEnt Journal June 2018InvEStmEnt oPPortunItIES
inVestor interVieW
Bertrand Cliquet, CFa ,
Portfolio Manager/Analyst
Lazard Asset
Bertrand Cliquet is a Portfolio Manager/Analyst on the
Management Limited
(London) Global Listed Infrastructure and Global Equity
Franchise teams. Before joining Lazard in 2004,
Bertrand worked for Goldman Sachs International as a
Research Analyst. Earlier, he worked in the Mergers and
Acquisitions group at Deutsche Bank, focusing on the
utility and retail sectors. He also did an internship at
Enskilda Securities in Paris, where he worked as an
analyst covering the retail sector. Bertrand has been working in the investment field since
1999. He attained a business degree from HEC in Paris, with a major in Finance.
1. What are the benefits of investing in like to you in reality? how does your
infrastructure equities relative to other universe (preferred) differentiate from
sectors? the generic wider infrastructure
universe?
Infrastructure equities provide a compelling
diversification benefit, provided the assets Infrastructure companies will have different
have unique characteristics that will sensitivity to interest rates. However, it
distinguish them clearly from an average usually is a misconception that they are
company. this is why we have coined the bond proxys. on the one hand, preferred
term Preferred Infrastructure that gathers a infrastructure companies with a strong
restricted number of infrastructure assets. inflation-linked tariff mechanism will be
they will possess long-lived, highly protected in a rising bond yield environment
predictable cash flows that have the added if bond yields increase due to a spike in
benefit of a strong inflation protection. We inflation. on the other hand, if a bond yield
believe that this is an essential element for increases as a result of an increase in the real
the consistency of the risk metrics of the bond yield, there are a number of
portfolio markedly lower than equities. adjustment mechanisms, especially for
regulated utilities. Indeed, regulators fulfilling
2. relative to global equities and other
their regulatory duty have to strike the right
sectors how have infrastructure equities
balance between consumers and capital
performed historically?
providers. as a result, essential services
Preferred infrastructure companies have companies that operate in highly regulated
historically provided a risk profile assets will see their returns fall in a falling
substantially lower than equities, with Beta bond yield environment (Cf uK Water
of 0.5-0.6, very consistently. return-wise, the companies) or rising in rising interest rate
key feature is the alpha opportunities that environment (Italy’s national Grid of
have been available, irrespective of the electricity, terna, during the 2011 Italian
market environment. this has enabled us to Sovereign crisis). as such, most of them are
reach at or above market returns, albeit with more akin to floating rate notes than bond
lower risk. proxys.
3. there are some misconceptions about However, some pockets of the infrastructure
the infrastructure space (underperfor- sector have not seen returns fall with bond
mance in a rising rate environment, yields. this is particularly the case for uS
overleveraged). What does a good regulated utilities. the market has
infrastructure company (inflation pass interpreted this lag in the return adjustment
through, good management etc.) look as a windfall, assuming long term benefit to
Cantor FItzgerald Ireland InvEStmEnt Journal June 2018 21shareholders, rather than an ultimate benefit to Infrastructure is likely to benefit from very strong
consumers. the consequence is that for those stocks, fundamental support as the sector undergoes a
the market has reflected meaningfully higher combination of ageing infrastructure (post WW2
valuation levels, leaving them highly bond yield infrastructure renewal – or victorian times water pipes
sensitive. in the uK) and a transformation into a greener society
that implies huge changes ranging from wind farm
4. What environment does infrastructure perform
and other renewables connection to a power grid,
best in? (a mix of defensive and growth qualities)
self-generation of electricity by water companies to
moderate markets and bear markets are environments power waste water treatment plants or waste to
where relative performance should be best. We expect energy facilities. this is likely to underpin long term
infrastructure to lag sector specific driven bull markets returns consistent with our inflation +5% target, the
(dot com bubble for instance) and in general sharply market being subject to its usual more erratic
rising markets. movements.
5. Considering how late we are in the cycle, what are
the biggest challenges facing some of your top
conviction names in this space?
Lazard Global Listed Infrastructure Equity Fund
Key Facts
Ticker (Bloomberg) LZGIEID ID
Benchmark Index Developed Core
Infrastructure 50/50 Index
Currency EUR
TER % 1.16%
Distribution Yield 3.18%
Fund Size €1,602,429,055
No. Of Holdings 25
Source: MorningStar
Source: Bloomberg
This is a financial promotion and is not intended to constitute investment advice. The value of investments and the income
from them can fall as well as rise and you may not get back the amount you invested. High yielding assets may carry a
greater risk of capital values falling or have limited prospects of capital growth or recovery. Investment in high yield securities
involves a high degree of risk to both capital and income. Yields from bonds reflect in part the risk rating of the bond issuer.
Investment in lower rated bonds increases the risk of default on repayment and the risk to capital of the fund. The Fund
invests in financial derivative instruments ("FDIs"). While the use of FDIs can be beneficial, they also involve risks different
from, and in certain cases, greater than, the risks presented by more traditional investments. FDIs may be subject to sudden,
unexpected and substantial price movements that are not always predictable. This can increase the volatility of the Fund’s
Net Asset Value. FDIs do not always totally track the value of the securities, rates or indices they are designed to track. The
use of FDIs to gain greater exposure to securities, rates or indices than by a direct investment increases the possibility for
profit but also increases the risk of loss. The Fund is also subject to the risk of the insolvency or default of its counterparties to
FDI investments. In such events the Fund may have limited recourse against the counterparty and may experiences losses.
Issued and approved in the United Kingdom by Lazard Asset Management Limited, 50 Stratton Street, London W1J 8LL.
Incorporated in England and Wales, registered number 525667. Lazard Asset Management Limited is authorised and
regulated by the Financial Conduct Authority.
22 Cantor FItzgerald Ireland InvEStmEnt Journal June 2018InvEStmEnt oPPortunItIES
Green eFFeCts Fund FaCtsheet
JunE 2018
Fund objectives
the objective of the fund is to achieve long term capital growth through a basket of ethically screened stocks. the fund invests in a
wide range of companies with a commitment to either supporting the environment or demonstrating a strong corporate
responsibility ethos. Sectors such as wind energy, recycling, waste management, forestry and water-related businesses all feature
prominently within the fund. the fund can only invest in the constituents of the natural Stock Index (naI) which was set up in 1994
and currently consists of 30 global equities.
Key information Green eFFeCts Fund naV sinCe inCeption
Morningstar Rating ★★★★★
€250
Fund Inception Oct 2000
NAV €210.60 €200
Minimum Investment €5,000 €150
Dealing Frequency Weekly, Daily from 11/6/2018
€100
Investment Manager Cantor Fitzgerald Ireland Ltd
€50
Custodian Northern Trust
Administrator Northern Trust €0
Sales Commission 3%
TER % 1.24% Source: Cantor Fitzgerald Ireland Ltd Research
Investment Mgt Fee 0.75%
esMa risK ratinG
*Prices as of 31/5/2018
Source: Bloomberg & Cantor Fitzgerald Ireland Ltd Research
lower risk 1 2 3 4 5 6 7 higher risk
Fund & share Class information
€64m
Typically Lower Rewards Typically Higher Rewards
Fund Size
Fund ISIN IE0005895655 larGest seCtor exposure %
Fund Sedol 0589565 Medical Devices 15.13
Recycling 13.79
Bloomberg GEFINVL ID
Wind Energy 10.61
Domicile Ireland Consumer Goods 6.84
Technology 6.40
Structure UCITS Fund Water Related 6.15
Retail 6.03
historic Yield Forestry 2.30
0 1 2 3 4 5 6 7 8 9 10 11 12 13 14 15 16
*Fund Yield 1.35%
Fund yield is historic based on full year 2017 dividend GeoGraphiC exposure %
income received. The fund does not distribute income to
Pan-Europe pe
36.24
investors. All dividend income is reflected within the NAV
America ca
28.57
price of the fund.
Asia sia
18.32
Europe pe
15.39
total number of holdings Australia lia
0.81
South Africa ca
0.66
Number of holdings 30
0 5 10 15 20 25 30 35
Market Capitalisation exposure
CurrenCY exposure %
Large: > €3bn 60%
SD
Medium: €500m - €3bn
USD 27.56
37% JPY PY
18.32
Small: < €500m 3% EUR UR
15.39
GBP GBP
15.09
DKK KK
7.87
NOK OK
7.06
SEK EK
6.22
BRL RL
0.90
0 5 10 15 20 25 30
Cantor FItzgerald Ireland InvEStmEnt Journal June 2018 23InvEStmEnt oPPortunItIES
Green eFFeCts Fund FaCtsheet
Continued
top 15 positions Sector Exposure Compared to a Traditional Global
SMITH & NEPHEW 8.71%
Equity Fund
VESTAS 7.87%
the fund does not invest in banks, oils, mining, metals or large cap technology stocks. From a
TOMRA SYSTEMS 7.06% performance and relative returns perspective this is something that all investors should bear in
SHIMANO 6.56% mind when considering investing in the fund. the overriding investment theme from a sectoral
perspective remains that of alternative energy, water, waste management and similar companies
KINGFISHER 6.38% with a strong corporate social responsibility (CSr) focus in both their culture and work practices.
SVENSKA CELLULOSA 6.22%
MOLINA 5.20%
Performance As of 31/5/2018.
1 Month YTD 1 Year 3 Year* 5 Year*
EAST JAPAN RAILWAY CO. 4.48% Green Effects 4.11 3.27 2.70 5.24 10.59
KURITA 4.10% mSCI World € 4.40 3.78 8.02 6.08 12.40
MAYR MELNHOF 3.55% S&P 500 € 6.18 5.09 10.12 8.70 15.37
Euro StoXX 50 -2.31 -0.31 -0.86 2.02 7.99
UNITED NAT FOODS 3.47%
Friends First Stewardship Ethical 5.81 6.49 12.11 6.30 12.23
ORMAT 3.36%
new Ireland Ethical managed 1.10 2.40 7.70 5.80 9.50
STEELCASE 3.23%
Source: Cantor Fitzgerald Ireland Ltd Research, Bloomberg and Northern Trust.
RICOH 3.18%
ACCIONA 3.08%
Annual Returns
Source: Cantor Fitzgerald Ireland Ltd Research
2000 2001 2002 2003 2004 2005 2006 2007 2008 2009
Fund sector exposure vs MsCi World 6.42% -38.47% 31.28%
2.40% -11.25% -30.00% 9.71% 14.38% 23.95% 22.52%
Sectors GE MSCI
Consumer Discretionary 15% 13% 2010 2011 2012 2013 2014 2015 2016 2017 2018
Consumer Staples 10% 10% 13.47% -19.61% 16.02% 19.87% 18.42% 15.72% 6.62% 6.8% 4.11%
Energy 0% 6%
Financials 0% 17%
Manager’s Commentary
the Green Effects Fund nav price ended may at €210.60 which was a return of +4.11% for the
Health Care 16% 13% month. Danish Wind turbine manufacturer, Vestas Wind systems, reported solid Q1 earnings
Industrials 33% 11% and maintained its full year 2018 guidance. the group expects to achieve at least €400m of free
cash flow during the current year while order book remains rebust driven by solid order growth
Information Technology 6% 16%
in South america, asia and Europe. revenue for the quarter hit €1.69bn while profits were €126m.
Telecomunications Services 0% 3% Kingfisher, the uK home improvement group, had a less positive update during the month with
Open Ended Fund 1% 0%
like for like sales dropping more than forecasts. tomra systems, the recycling vending machine
group, presented an upbeat outlook at an analysts meeting in late may. the groups reverse vending
Utilities 7% 3% machines help over 35bn used beverage containers to be captured annually while over 750,000
Materials 4% 5% tonnes of metal are recovered every year by its metal recycling machines. other news of note
during the month was the particularly strong move in the uS Dollar against the Euro (lower
Real Estate 2% 3% euro/usd) as the ECB noted a weakening in the economic outlook in Euro. Brent oil traded above
Cash 5% 0% $80 during the month as sanctions against Iran added to supply constraints.
Source: Cantor Fitzgerald Ireland Ltd Research
email: greeneffects@cantor.com
24 Cantor FItzgerald Ireland InvEStmEnt Journal June 2018You can also read