1st Quarter Commentary - April 2021 - MARKET COMMENTARY - Horizon Kinetics
←
→
Page content transcription
If your browser does not render page correctly, please read the page content below
MARKET COMMENTARY

1st Quarter Commentary
April 2021

MARKET COMMENTARY
1st Quarter 2021 April 2021
The Large TPL and Bitcoin Positions
Page 1: It’s All About TPL and Bitcoin (almost)
Introduction
Page 2: Concentrated Positions, ‘Locking in
As many of you might imagine, we’ve been getting Profits’ and ‘Trimming’
many more questions in recent weeks about the Page 2: Objective Considerations & the Magic
Texas Pacific Land Corp (TPL) and bitcoin positions. Formula for Outperforming
Interestingly, we also received a great many
Page 5: Subjective Considerations & Why No
questions about them only a year ago, when the
One Uses the Magic Formula
share prices were much lower than many clients felt
comfortable with. Now there’s some discomfort with
Page 7: Texas Pacific Land Corp.
– or, at least, curiosity about – their being so high. Page 12: ‘Trimming’ for Diversification & Risk
Reduction
The questions fall into several categories.
Page 12: On Judging Size Risk
Some are in the valuation category: having Page 15: How the Interpret the TPL Presentation
appreciated so much, TPL and bitcoin must be
Page 17: All the ‘Bad’ Oil News Questions
very expensive; perhaps it’s time to take profits
or trim the positions. Page 19: Bitcoin…Our Inflation ‘Bet’…Are We
Still Value a ‘Value Shop’?
Some are about portfolio balance: is it wise to let
Page 22: Hard Asset and Asset-Light Inflation
a position become so large? Perhaps it’s time to
Beneficiaries
take profits or trim the positions.
Page 23: The Risk You Don’t See; 3 Important
Some questions are in the business risk category. Things People Miss About Inflation
For TPL: what are the implications of the fracking Page 32: From the What is NOT Research or
ban by the Federal government; what risk is Information Dept.
posed by the fossil fuel divestment movement?
For Bitcoin: what if the government bans
cryptocurrency?
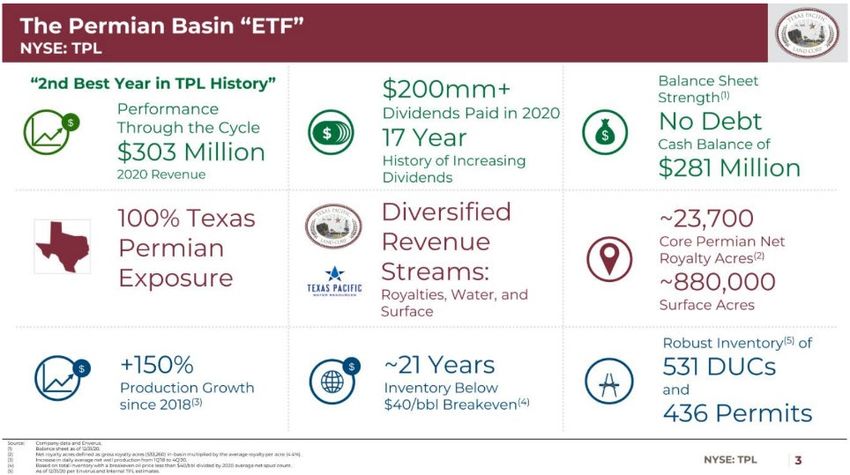
There have even been questions, though more upbeat, about the investor presentation that TPL issued
in March. That document was so compendious, at 30-plus detailed slides, that some clients have asked
us how to understand it, what message to take from it. Granted, there were prior complaints that the
company did not provide sufficient information. Maybe, from the company’s perspective, this falls into
the You Asked for It, You Got It category.
The short answer to the underlying concern behind these questions is that we were not perturbed when
TPL and bitcoin were lower, and we’re not perturbed now that they’re higher.
As to why we’re so comfortable with them, I’d like to address the questions properly. Because TPL and
bitcoin have become so large, even dominant, in many portfolios, they deserve a truly responsive answer,
one that really explains the why and the what’s what. That will take more discussion than the usual
company review, because it also encompasses more universal and important portfolio management and
risk practices that aren’t much discussed in polite company.
© 2021 Horizon Kinetics LLC ® Page | 1 of 33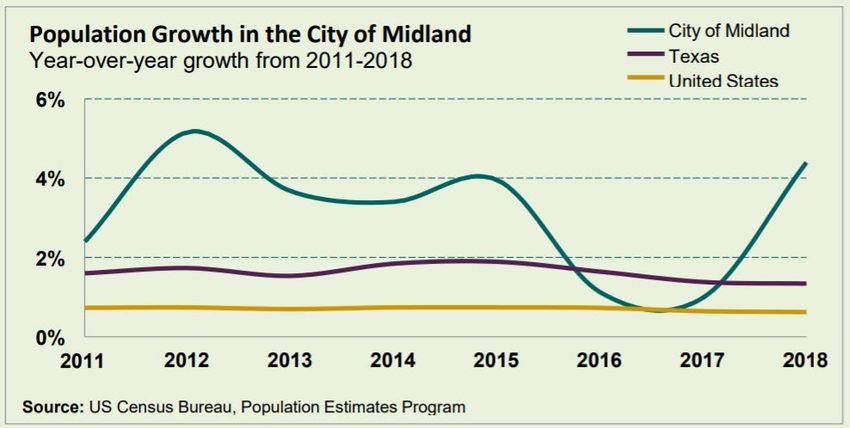
MARKET COMMENTARY
1st Quarter 2021                                                                                    April 2021

 I’ll begin with TPL, which is generally the much larger position. But we’ll start with the basics. They are so
 basic, in fact, that one can’t actually manage a portfolio without making a decision about this. It might be
 that the decision is made reflexively, without a second thought, but it’s a decision nonetheless. This is the
 foundational issue of position size and holding periods. I hope to add clarity to these considerations that
 everyone makes, whether they know it or not.

 On Concentrated Positions, “Locking in Profits” and “Trimming”
 Objective Considerations and The Magic Formula for Investing Success
 The topic of concentrated positions can be complex and controversial. But it is rarely controversial in
 practice, because so few portfolio managers ever challenge it. Both Modern Portfolio Theory and standard
 practice consider it necessary that various tactics be undertaken to continually reduce portfolio
 concentration and volatility. Importantly, portfolio risk, by convention – even if this seems counterintuitive
 – is not measured by a decline in value. Rather, it is measured as relative price volatility; that is, relative to
 an accepted benchmark. For instance:
      A portfolio that declines by 1% when the S&P 500 is up 5% is considered very risky, even though it
      barely lost value.
      A portfolio that is up 10% when the market is up 15% is considered poorly managed, even though that
      is a very decent return on an absolute basis.
      Even a portfolio that is up 30% when the market is up 10% might be considered risky.
      And a portfolio that is down 10% when the market is down 12% is considered safe or conservative,
      even though it lost 10%. In an institutional setting, a manager with a year such as this added to his or
      her performance record could be well rewarded.

 Let’s hold that line of discussion in abeyance for the moment and move to a more uplifting topic. We at
 Horizon Kinetics can provide you with the secret to long-term outperformance. We’ll really give it to you,
 and it’s pretty much guaranteed to work. Anyone can do it. Why, you might ask, would we give away
 something so valuable? Because anyone can do it; it’s just that they won’t. You’ll get the secret formula in
 a moment, but first an exercise in the proper technique. We’re going to practice on pennies. We’ll learn
 how to select, out of a large group of average pennies, the talented penny, the smart one.

 Take 100 pennies and then flip them all. Whichever of them land 'heads', those are the smarter pennies.
 The rest are disqualified. Then take the remaining 50 or so smarter pennies and flip them again, and again
 discard the average pennies. After about a half-dozen rounds, you will identify the smartest penny, the
 only one that 'knew' how to keep landing heads.

 Now, how do you distinguish the smart penny from the smart portfolio manager? The one who was just
 identified by some screening app for a statistically exceptional 5-year performance record? Is that manager
 actually smarter? Perhaps she was exploiting a temporary market sector inefficiency. The key question is:
 does she understand why what she was doing during that particular period was successful, so that she can
 alter her approach when that inefficiency, that advantage, ends? Or does she not understand that there
 was a temporary inefficiency at work? If she doesn't, then she might keep applying the same security
 selection criteria even as that opportunity set begins to be exhausted.

© 2021 Horizon Kinetics LLC ®                                                                             Page | 2 of 33
MARKET COMMENTARY
1st Quarter 2021                                                                                    April 2021

 An example might be selecting for lower price-to-sales ratios
 among a certain class of growth companies during a several-year             Free: the secret formula for beating
 period of market share expansion. Once those companies begin                the market.
 to saturate their markets, sales growth will slow and profit
 margins will contract, so that the same strategy will begin to yield        You can try this at home.
 more-uneven and less-stellar results with every passing year. The
                                                                             Contraindicated for office use.
 alternative is that the manager does understand that the game is
                                                                             (Field-tested in live institutional
 up, so to speak, and seeks a new inefficiency to exploit. (Seeking
                                                                             settings.)
 a new inefficiency, by the way, as self-aware and wise as that
 would be, is seriously frowned upon in the institutional investing
 world. It is actually cause for dismissal, since it is considered to be “style drift”, a term for abandoning one’s
 investing principles and guidelines.)

 Back to the secret formula for beating the market. All you have to do is create a portfolio of stocks of your
 choosing, using whatever selection criteria you like; it’s up to you. There are only two rules.

 First, you have to choose a large enough number of equally-weighted stocks so that they encompass a
 normal distribution of possible outcomes – the good, the bad and the middling. Financial statisticians might
 agree that 35 or so names are sufficient. Second, don't trade it. You can make no changes, you can’t
 harvest your winners and double up on your losers, etc., etc. Here’s how this will play out.

 Most of the stocks will vary slightly around whatever median appreciation rate the stock market will get. If
 the median expected return is 6%, some stocks will be up 7%, some up 5%, and so forth, and they'll average
 out to about 6%. (As a touchstone, bear in mind that over the past 20 years — as surprisingly low as this
 might seem –- the S&P 500 has appreciated by only 6% a year; that’s it.) However, a couple of stocks out
 of the 35 will be downside outliers: one might go down 20% each year, the other down 25% each
 year. There will also be a couple of upside outliers: one might go up 20%/year, the other up 25%/year.

 At the end of year one, the downside and upside outliers cancel
 each other exactly, one up 20%, one down 20%, and one down 25%,             Bear in mind that over the past 20
 one up 25%. The balance of the portfolio will produce the median            year— as surprisingly low as this
 return the first year, which is 6%.                                         might seem –- the S&P 500 has
                                                                             appreciated by only 6% a year;
 Year 2, though, is different. The downside outliers start Year 2 with       that’s it.
 a less-than-equal weighting. If they started off at 3.0% each, now
 they're only 2.40% and 2.25% weightings, because they declined. In Year 2, when they decline by another
 20% and 25%, they will have a smaller negative impact on the portfolio than in Year 1. For the positive
 outliers, they will start Year 2 not at 3.0%, but at 3.60% and 3.75%. They will have a somewhat larger
 positive impact on the portfolio that year. At the end of Year 2, the positive outliers' impact on the portfolio
 will outweigh the impact of the negative outliers. Not by a huge amount, but measurably.

 You see where this is going. Each year, the negative outliers become smaller weights, and even though
 they’re doing horribly, they matter less and less. Eventually, they’ll be a rounding error. If the two 'smart
 penny' stocks keep outperforming, they will eventually come to dominate the portfolio. They’ll expand from

© 2021 Horizon Kinetics LLC ®                                                                             Page | 3 of 33
MARKET COMMENTARY
1st Quarter 2021                                                                                  April 2021

 equal 3% positions to 5% positions in a few years, which doesn’t seem like a lot. But in year 10, if all the
 other stocks in the portfolio appreciate their 6% per year, these two stocks will be 22% of the portfolio, and
 the annualized portfolio return will be 7.4% instead of 6%. The portfolio will be worth 13% more than the
 indexed portfolio.

 Now, you could ‘trim’ them here; lock in profits. But by Year 15,
 without changes, the annualized portfolio return will be 8.4%            The conventional constantly
 instead of 6%, and those two stocks will be 37% of the portfolio.        rebalanced stock portfolio can
 The portfolio will be worth 40% more than the indexed portfolio.         maintain wealth on an inflation-
                                                                          adjusted or purchasing power
 Go to Year 20, and the portfolio will be worth twice the indexed         basis, but it can’t create wealth.
 portfolio. The key is that the performance of the portfolio will begin
 to converge on the performance of those two outperforming stocks. In a certain number of years, even if
 your other stocks don’t do so well, your portfolio will outperform the market. It might take a decade, but
 it will happen. And once the crossover point is reached, the outperformance will be dramatic.

 The conventional, con-
 stantly      rebalanced
 stock portfolio can
 maintain wealth on an
 inflation-adjusted or
 purchasing power ba-
 sis, but it can’t create
 wealth. Here’s a story
 about that very thing,
 from one of my first
 years as a portfolio
 assistant in a private
 bank.

                                                             When Microsoft came public in 1986, some of
                                                             the senior portfolio managers at this very large
                                                             institution were able to be allocated some
                                                             shares at the IPO price. Microsoft was a hot IPO,
                                                             so this was a minor coup. The first trades were
                                                             more than 20% above the IPO price. By year-end
                                                             the share price was up over 80%. I very much
                                                             doubt that any of those portfolio managers still
                                                             held the shares by year-end. They locked in their
                                                             profits and were most pleased; fist-bump time
                                                             (though that was not the Private Bank style; it
                                                             was more ‘knowing smile time’).

© 2021 Horizon Kinetics LLC ®                                                                          Page | 4 of 33
MARKET COMMENTARY
1st Quarter 2021                                                                                    April 2021

      Selling those Microsoft shares wasn’t about understanding the business model or its economic
      potential; it was about ‘locking in’ the profit to benefit that year’s relative performance results – that
      was the value of the price gain – because all they had to go on was the price and relative performance.
      Microsoft shares appreciated 600x over the next 15 years. Had they held on, the Private Bank could
      have become THE Private Bank.

 Subjective Considerations and Why Almost No One Uses the Magic Formula
 The magic formula works. But here’s why it isn’t done; it just brings on a catalog of problems.
      −    As this strategy begins to succeed over a period of years, the portfolio will become more
           concentrated and volatile. What if those two stocks are down one year while the market is up? As
           a fund or portfolio manager, you will be asked to justify why you don't sell the two 'losers’ (that’s
           how it’s pronounced, with a disdainful emphasis on the “L”) why you don’t take action to remediate
           an obviously poor choice?
      −    You will be objectively measured to be a bad portfolio manager until such time that you decisively
           outperform, a date that you know will be many years and many lost bonus opportunities in the
           future.
      −    Some clients will expect you to 'work' for your return. But in your case, you haven’t made a single
           trade in 10 years. You will be asked to justify the value you’re adding.
      −    You will doubt yourself, and want to trade. You will believe that you can add value by selecting
           another superior stock. BUT, if you recall the smart penny portfolio, only the two ultimately
           successful stocks in your portfolio can self-identify: they know which ones they are, but you don't.
           You will find that it's the easiest thing in the world to trade; just have to press the “Enter” key. You
           will miss it terribly. Not so easy to not trade; let’s call it informed inactivity.
      −    Even as, in future years, your static portfolio begins to match or exceed the benchmark, just as the
           discipline is beginning to pay off, you will be asked ever more forcefully to ‘trim’, or 'lock in some
           profits’ – which would, of course, undermine the strategy.

 A Legendary Story About a Magic Formula Investor
 We’re hardly the first people to arrive at this conclusion about holding an undervalued investment for as
 long as it takes to realize its true value. John Templeton, perhaps the greatest contrarian investor of all
 time, owes his fame to this approach. Ironically, he would have been fired several times over for
 underperforming the market, had he worked for any creditable investment firm. The Templeton Growth
 Fund underperformed the S&P 500, cumulatively, for its first 14 years, through 1968. Ask yourself:
 wouldn’t you have fired him? (But he worked for himself, so only he could fire himself.)

 Another irony is that although he managed the Templeton Growth Fund, he was a tried-and-true value
 investor. He started this fund at the end of 1954. Subsequently, although he only outperformed in about
 half the years, he ended up with one of the greatest investment records of all time, spanning 37 years to
 the end of 1991, when he retired. Cumulatively, over the course of those 37 years, the Fund generated a
 return of 17,862%, which was more than three times that of the S&P 500 return of 5,243%. There might be
 no one else who ever tripled the return of the S&P 500 over that span of time.

© 2021 Horizon Kinetics LLC ®                                                                             Page | 5 of 33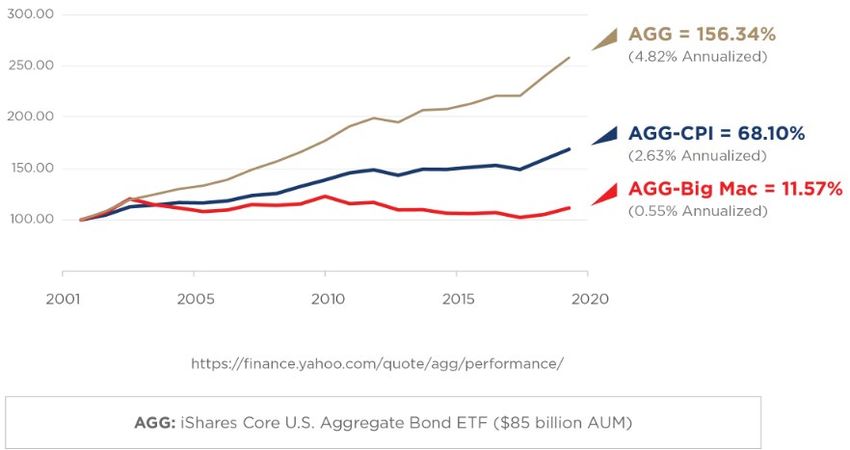
MARKET COMMENTARY
1st Quarter 2021                                                                                            April 2021

 How does one reconcile this? Templeton             Templeton Growth Fund vs. S&P 500
 focused on a couple of big trends, and he                     Templeton Growth Fund                   S&P 500
 stayed with them, and that gave him his                    Ann’l Return     Cumul. Return   Ann’l Return   Cumul. Return
 edge. One trend is that he was the first           1955         7.04%                          31.41%
 outside investor to discover the Japan stock       1956         4.64%                           6.48%
 market. He noticed, in the 1950s, that             1957       (16.92)%          (6.94)%       (10.72)%          24.93%
 Japanese companies were growing at higher          1958        48.81%          38.48%          43.15%           78.84%
 rates, for the most part, than elsewhere in        1959        14.00%          57.87%          11.95%        100.02%
 the world, yet had very low P/E ratios, which      1960        13.84%          79.72%           0.45%        100.92%
 he found attractive. He stayed with Japan for      1961        18.29%         112.59%          26.88%        154.93%

 a very, very long time. He took this approach      1962       (13.52)%         83.85%           (8.66)%      132.85%
                                                    1963        (5.14)%         74.40%          22.76%        185.85%
 with his other investments as well.
                                                    1964        28.59%         124.26%          16.43%        232.82%
                                                    1965        22.14%         172.25%          12.46%        274.29%
 One way to characterize his almost singularly
                                                    1966        (5.30)%        157.82%         (10.02)%       236.79%
 differing world view is that he would find
                                                    1967        13.74%         193.24%          23.89%        317.25%
 something interesting, and which he came to
                                                    1968        37.76%         403.97%          11.04%        463.31%
 know well, and stayed with it. For the             1969        19.66%         503.05%           (8.40)%      415.99%
 preponderance of the market, particularly          1970        (6.44)%        463.49%           3.94%        436.32%
 the index and asset allocation-model               1971        21.93%         587.06%          14.30%        513.01%
 investors, every quarter, or certainly every       1972        68.56%       1,058.11%          19.00%        633.16%
 year, they gravitate from the set of               1973        (9.92)%        943.23%         (14.69)%       525.46%
 investments that were popular that year to         1974       (12.07)%        817.31%         (26.47)%       359.90%
 those that are popular in the next year. One       1975        37.60%       1,162.22%          37.23%        531.12%
 reason this is not a very successful strategy is   1976        46.74%       1,752.18%          23.93%        682.15%
 that it implies the manager has to know a          1977        20.37%       2,129.47%           (7.16)%      626.15%
 great deal about a lot of investments,             1978        19.21%       2,557.77%           6.57%        673.86%
 whereas John Templeton only had to know a          1979        26.84%       3,271.12%          18.61%        817.88%
 great deal about a few investments, and he         1980        25.89%       4,143.90%          32.50%       1,116.19%

 understood them very well. He simply left          1981        (0.24)%      4,133.71%           (4.92)%     1,056.35%
                                                    1982        10.81%       4,591.37%          21.55%       1,305.54%
 them alone and let compounding do the rest.
                                                    1983        32.91%       6,135.30%          22.56%       1,622.63%
                                                    1984         2.17%       6,270.60%           6.27%       1,730.64%
 Compounding, when allowed to work, can be
                                                    1985        27.79%       8,040.99%          31.72%       2,311.32%
 astoundingly powerful. But it takes a long
                                                    1986        21.24%       9,527.66%          18.67%       2,761.51%
 time to work; it can’t be done in fits and         1987         3.11%       9,827.08%           5.25%       2,911.74%
 starts.                                            1988        23.60%       12,169.87%         16.61%       3,178.74%
                                                    1989        22.56%       14,937.95%         31.67%       4,317.12%
                                                    1990        (9.05)%      13,577.02%          (3.09)%     3,986.81%
                                                    1991        31.33%       17,862.03%         30.74%       5,243.31%

                                                    Source: Fund Documents

© 2021 Horizon Kinetics LLC ®                                                                                     Page | 6 of 33
MARKET COMMENTARY
1st Quarter 2021                                                                                  April 2021

 Texas Pacific Land Corp.
 Which brings us to Texas Pacific Land Corp. Depending on when an account purchased it, it might now be
 a very, very large position. It is up 22x in the past eight years. If that extraordinary level of return seems
 outrageous, it’s really a picture of the power of compounding. But you can get it only if you don’t interrupt
 it. Here’s why only a vanishingly small proportion of professional investors can capture that bounteous
 result:
 −    Between August 2014 and January 2015, peak to trough, TPL shares fell 54% (the S&P 500 was down
      11%).
 −    From May to August 2015, the shares fell 33% (the S&P 500 was down 12%).
 −    Between November 2015 and January 2016, TPL fell 28% (the S&P 500 was down 11%).
 −    Between September and December 2018, TPL fell 50% (the S&P 500 was down 19%).
 −    From April to October 2019, TPL shares were down 37% (the S&P 500 was down 11%).
 −    Now we come to current events – you’ll remember this one – between February and March 2020, the
      TPL shares fell 61% (the S&P 500 was down 34%).
 −    Wait, there’s one more…between June and September 2020, the shares fell by 37% (the S&P 500 was
      down 16%).

 Ask yourself, really, what kind of glutton for punishment, what Quixotic head-in-the-sand nincompoop
 would keep holding a stock like that? How many opportunities were there to get out and rebalance?

         As an aside, last week I came across an email from one of our relationship managers. It was
         dated December 2014, when TPL was about $120/share. It’s about $1,600 now. He asked, on
         behalf of a significant institutional client of ours, “Client just asked for an update on TPL, given
         the pullback and how much the cash flows are affected by the lower oil and natural gas prices.
         Have we done any new analysis, given the lower price? Not sure how I should advise.” Yup.
         that’s the thing.
 It is a reasonable question, though – ‘Ok, I get it, we held on, the company has done well, but it is up 5x,
 10x, 20x. When is enough? Isn’t it overvalued by now?’

 The only thing that entirely reasonable question is missing is information about other than the price. About
 the nature of the business, its operating progress, and its potential. A share price pattern in isolation, as we
 saw just above, can’t tell you enough; in fact, it can tell you precisely the wrong thing. In the case of TPL,
 with a sufficient amount of additional information, I think you’ll find the answer is pretty clear.

 One way to think about the large-scale price increases in TPL shares over time is in relation to the stages of
 its business development. One wouldn’t suggest that Microsoft’s no-doubt meteoric increase in market
 value between its from-the-dorm-room stage (when it first secured its contract with IBM for the PC
 operating system) to the time of its IPO was a signal that there was no additional sales growth or economic
 value to be had. That was simply the first phase of its commercial lifecycle, just getting to critical mass as
 a business.

© 2021 Horizon Kinetics LLC ®                                                                           Page | 7 of 33
MARKET COMMENTARY
1st Quarter 2021                                                                                April 2021

 Stage 1 for TPL, the corollary to that early stage for Microsoft,               Trust’s Royalty Share of
 would be the first 125 years of TPL’s existence, during which it               rd
                                                                               3 Party Oil & Gas Production
 was essentially unchanged. It just received a relatively                        Oil             Nat’l Gas
 constant, modest stream of revenues from grazing fees and                     (barrels)     (000 cubic feet)
 easements on its surface acreage, royalties on oil and gas          2021      438,000        5,913,000
 production on properties it had divested in 1955, and periodic
                                                                     2014      260,829        1,370,377
 land sales. Grazing leases were in effect on over 95% of the
                                                                     2013      217,682        1,065,458
 Trust’s then roughly 2 million surface acres. Most of this
                                                                     2012      135,561          721,560
 revenue was allocated to share repurchases, which had been
                                                                     2011      128,170          572,506
 ongoing since 1888.                                                 2010      118,220          499,615
                                                                     2009      123,935          419,440
 Stage 2 commenced roughly 8 to 10 years ago, when advances
 in drilling technology suddenly made available the vast, but           2003      120,883         410,514
 very deep, oil and gas reserves of the Delaware Basin that had         1995      107,203         504,177
 been uneconomic to reach. A public signal of that change was           Source: Company reports
 the June 2013 announcement of a joint venture between
 Chevron and Cimarex to combine contiguous acreage in the region in order to facilitate capital expenditure
 plans in the many billions of dollars. 1 That was the starting gun. From those multi-billion-dollar drilling
 plans, one could readily deduce the very large volumes of oil and gas these companies expected to produce
 that would be sufficient to provide the level of profit they expected to earn over a period of decades. Those
 volumes would translate into royalty revenues to TPL, and the scale on which this would take place was
 simply enormous in comparison to what TPL was at the time.

 Between Stage 1 and Stage 2, all that happened was that
 a $90 million micro-cap company in the year 2001               A public signal of the beginning of Stage 2 of
 experienced an initial growth phase and graduated into         TPL’s growth phase was the June 2013
 the mid-cap range: TPL ended 2010 with a $350 million          announcement of a joint venture between
 market cap. Yes, its market value rose 3.9x, but one can’t     Chevron and Cimarex to combine contiguous
 ignore that its revenues rose 2.6x, and its dividend was       acreage in the region in order to facilitate
 raised 2.5x. It had also repurchased over 25% of its           capital expenditure plans in the many billions
 shares during this period. Therefore, on a per-share basis     of dollars.1 That was the starting gun.
 – which is the only figure that really matters – revenues
 and dividends rose about 3.5x. Not so very different than the stock’s market value. Armed with this financial
 information in addition to the stock price, you couldn’t really say it was more expensive.

 Stage 3 of TPL’s business life cycle commenced at year-end 2020, just several months ago. With a market
 cap of $5.6 billion, it was 16x larger than the $350 million at year-end 2010. On the other hand, revenues
 were 15x higher.

 1
  https://www.prnewswire.com/news-releases/cimarex-announces-joint-development-agreement-with-chevron-in-
 culberson-county-texas-212814821.html

© 2021 Horizon Kinetics LLC ®                                                                         Page | 8 of 33
MARKET COMMENTARY
1st Quarter 2021                                                                                April 2021

 Total dividend payments increased from $0.20/share in 2010 to $10/share in 2020. 2 And repurchases had
 reduced the share count by another 15%, so revenues on a per-share basis were about 17x higher than a
 decade earlier. Armed with this information, you couldn’t really say that TPL was more expensive.

 The more important thought – strange as it might seem in the absence of additional data – is that TPL might
 well be more undervalued now than it was 10 years ago, given the information available then. Let’s
 enumerate some of the factors, none of which a price chart can tell you.
     −   Today, at the beginning of Phase 3, TPL’s business includes not only oil & gas royalties and land
         easements, but one-third of revenues now come from water provision and recycling. That was only
         6% of revenues in 2015, when it was a new line of business. It is expanding rapidly.
     −   Water is only one element of what now appears to be a self-diversifying aspect of TPL’s assets.
          o   A number of companies have established or made plans to establish utility-scale solar energy
              plants in Texas, including West Texas. These can occupy hundreds or even thousands of acres.
              There is an easement revenue opportunity for TPL.
          o   The same might apply to carbon capture/storage projects. This past year, Occidental Petroleum,
              one of the major developers in the Delaware Basin, announced an $800 million such project,
              which would be the largest of its kind in the world. It would withdraw CO2 from the atmosphere,
              to be used in the drilling process and which would permanently store that CO2 within the rock.
              Occidental hopes that this technology can made drilling carbon neutral or even carbon negative.

 2
     Total dividends paid in 2020 were $26/share, but $16 of that was from 2019 earnings.

© 2021 Horizon Kinetics LLC ®                                                                         Page | 9 of 33
MARKET COMMENTARY
1st Quarter 2021 April 2021
Construction begins next year and has the goal of sequestering up to 1 million metric tons per
year. Up to 1,000 workers will be employed in the
construction phase. This is an example of the type of
additional land use and reserve base activity that is TPL has been accorded among the
taking place in the counties where TPL has surface highest ESG scores. It is likely to be
acreage and royalty interests. a sought-after addition to any ETF
o Texas has also drawn interest from cryptocurrency that would like to increase its own
miners who have in mind purchasing excess or flared ESG rating. One should therefore
natural gas in order to create cheaper electric power. expect to find TPL in an expanding
Any such gas that is sold instead of flared produces variety of ETFs.
revenues, some of which might accrue to TPL.
− Moreover, the company recently reached the $11 billion market capitalization threshold for S&P 500
inclusion. That is not to say that TPL will be included in the S&P 500, but as of January 2021, it
converted from a Trust, which was ineligible for S&P 500 or other index membership, to a C-Corp,
which is eligible.
− Various indexes have already begun to buy TPL shares. So far, it is in 23 ETFs.
o These include the large iShares Core S&P Total U.S. Stock Market ETF (ITOT), the Vanguard
Energy ETF (VDE) and, interestingly, both the Schwab U.S. Mid-Cap ETF (SCHM) and the Schwab
U.S. Large Cap ETF (SCHX). It is even in an ESG ETF. This might be surprising; it is also important.
o TPL has been accorded among the highest ESG scores (for Environmental, Social and
Governance factors). It actually scores higher than MasterCard and the securities exchanges,
which are all data processing businesses. This is yet another benefit of the royalty business
model: TPL does not engage in drilling activity, nor own any fossil fuel reserves; that is done by
the oil exploration companies. TPL is likely to be a sought-after addition to any ETF that would
like to increase its ESG rating. One should therefore expect to find TPL in an expanding variety
of ETFs.
− Most important of all is the simplest, before-our-very-eyes observation. The Stage 2 to Stage 3 period
of TPL’s history, the past 8 years that witnessed a 20+ fold increase in price, took place when the
price of oil declined from $95 to today’s $60. If that’s what happened when oil was down 35%, what
if oil returns from $60 back to $95?
Stage 4 has yet to occur. It is only informed supposition, at this
juncture, and it will not happen in anywhere near the conventional The past 8 years saw a 20+ fold
investment time horizon. It might as well be on Mars as far as that increase in the TPL share price. That
goes. Of course, today’s circumstance for TPL might as well have was while the price of oil declined
been on Mars when our last formal research reports were written from $95 to today’s $60. If that’s
15 years ago and 5 years ago. what happened when oil was down
But it is entirely plausible that, in a decade or two, the language 35%, what if oil returns from $60
applied to TPL’s land portfolio might evolve from ‘surface acreage’ back to $95?
to ‘real estate’ or ‘real estate development’. Because that is what
happened in Midland City, Texas.
© 2021 Horizon Kinetics LLC ® Page | 10 of 33MARKET COMMENTARY
1st Quarter 2021 April 2021
Midland County is the older,
traditional center of the
Permian Basin: the Midland
Basin. Midland City is roughly
150 miles or more east of the
Delaware Basin counties that
are now the primary focus of
new development activities in
the Permian.
− In 1940, 9,325 people lived
in Midland City.
− By 1945, the population
was 14,000, supported by
the necessity for oil for the war effort, including investment by the U.S. military.
− By 1950, there were over 200 oil companies with offices in Midland, and by 1960, the population was
over 60,000.
− Midland City’s fortunes had already followed oil prices’ multiple booms and busts, cycles it has
continued to experience through today. Nevertheless, by 1983, the population exceeded 90,000.
Despite an apartment building construction boom at the time, new residents lived in tents, cars and
trailers for lack of a housing supply.
− By 1990, with a population of 106,000, Midland had become the financial and administrative center
for the Permian Basin. 3
− Even during the decade ending 2019, when the population reached 146,000, Midland expanded far
more rapidly than either the U.S. or Texas.
By comparison, here are the 2019 populations of the counties with the
most active exploration and production activities in the Delaware Basin.
169 people live in Loving County, Texas; Hudspeth County has a
population of 4,886; Reeves County has 15,976; and Culberson County
has a population of 2,214.
Development activity in the Delaware Basin is increasing and is likely to
continue to do so for many decades. The pure infrastructure of oil and
gas production – rigs, pipelines, roads, electric lines, water storage or
processing facilities – will increase in density. That will bring with it an
increasing population of workers, support personnel, administrative and
housing infrastructure. As happens with any developing population
center, there will be follow-on needs for ancillary infrastructure, such as
gas stations, convenience stores, and so on, up the value curve.
TPL’s surface acres could very well end up being beneath some of that development. Midland is not a large
city. Nevertheless, one might wonder what several hundred acres, of Midland City’s 45,000 acres, would
be worth.
3
https://www.tshaonline.org/handbook/entries/midland-tx
© 2021 Horizon Kinetics LLC ® Page | 11 of 33MARKET COMMENTARY 1st Quarter 2021 April 2021 ‘Trimming’ for Diversification and Risk Reduction A legitimate, perhaps the only compelling, purpose for taking the risk of owning a risky asset like a common stock is for purchasing power protection and eventual conversion into income. Ultimately, we all live on some form of income. If the appropriate asset allocation for a person is 60% stocks and 40% bonds, and if the stocks appreciate to 70% of the portfolio, then that extra 10% appreciation can be sold and redirected to bonds. That appreciation funds a permanent higher income stream. When one could buy an investment- grade closed-end municipal bond fund and earn a tax-free 5% or 6% – which wasn’t all that long ago – that could have been a sound strategy. Unfortunately – very unfortunately – bond funds don’t yield anything. The iShares U.S. Aggregate Bond ETF (AGG) has a 1.4% yield to maturity. But even the understated CPI measure of inflation is higher than that, so those bonds now lose purchasing power, net of the coupon, with every passing month. But, hey, the fee is very low. Selling TPL in order to buy a bond fund is to consign those proceeds to a negative real return. The entirely reasonable basis for the equity-to-bond rebalancing strategy has been rendered moot by the Federal Reserve’s monetary policy, which is to enforce artificially low interest rates. Here’s a conundrum: TPL yields 1.6%, based on last year’s dividend payments. The expectation is that the dividend will rise over time as production volumes and oil prices rise. There really isn’t a positive income tradeoff between selling TPL and buying a bond fund. Further, there will be a gains tax to pay upon sale. The gains tax is no different in impact than a trading loss. For a New York resident who purchased TPL in 2013, for instance, more than 25% of the sale proceeds will be due in taxes. The seller will have only 75¢ on the dollar to purchase whatever paltry interest rate is available in a bond fund. And if an at-risk investment is made with the after-tax proceeds, that investment will have to appreciate 33% simply to break even with the pre-tax value. Here’s another consideration. Say that a position is 40% of a portfolio, and that it pays a dividend yield of 2.5%. That’s enough to pay for one new 1%-weight investment each year. If the yield is 1.5%, that’s enough to pay for a new 1%-weight investment every 20 months. In can be a funding engine for a continuous diversification process over time. Perhaps one of those new positions will be an opportunity like Bitcoin. On Judging Size Risk Many people look at the current market value of an investment as the measure of risk. We tend to look at the amount of capital placed at risk at the time of investment as the appropriate measure. If one looks at the total dollar cost of a TPL position in a portfolio that has owned it for many years, it will probably be found to be quite small relative to the value of the portfolio. Our practice has been to let the investment continue to compound over time if the business model and company-level financial returns have not deteriorated and if the security is not egregiously overvalued. © 2021 Horizon Kinetics LLC ® Page | 12 of 33
MARKET COMMENTARY
1st Quarter 2021                                                                                    April 2021

 Price Target vs. Valuation Model
 Which brings us to the question of a price target for TPL, or for any stock.
 It was asked of me only last week – ‘what’s your price target?’ Here, too,        A price target is a bit like
 our approach differs from conventional practice. Price targets are                driving a new car off the
 expected on Wall Street. They are a fixture of every recommendation. It is        dealer’s lot; that price might
 a presumed necessity of sophisticated investing, which involves working           be outdated as soon as it’s
 with figures, quantitative analysis. Shouldn’t quantitative analysis result in    issued.
 a known future price for a stock, like a mathematical formula?

 Maybe, but does anyone elucidate how a price target actually helps investment results? One thing that a
 price target does accomplish: it encourages a transactional way of thinking, which suits the transactional
 business model of a brokerage firm. It can be used to generate multiple decision-making points, each of
 which entails trading costs, perhaps tax costs, and further risk. It encourages frequent engagement, kind of
 like social media.

 It is the brokerage firms that are responsible for the vast
 majority of published company research. The sell-                Wall Street-to-English Dictionary
 side analysts of brokerage firms are forever adjusting their     From the Change-of-Recommendation Section:
 price targets, and making subtle changes to their
 recommendations. An example would be a research                  Strong Buy to Buy = Pending Neutral
 update changing a recommendation from ‘strong buy’ to            Neutral = Pending De-emphasize
 ‘buy’, which is then understood by seasoned readers to be        De-emphasize = Look Out Below
 a possible prelude to a ‘neutral’ rating some weeks later.
                                                                  Sell = Possible Buy (for value investors only)
 Of course, ‘neutral’ might be a precursor to ‘de-
 emphasize’. De-emphasize really means ‘look out below’,          Accumulate = Investment losses and trading
 because the brokerage firm in question uses this as a            fees fully realized; time to start over
 diplomatic pause before issuing a sell recommendation.

 On the other hand, if the shares have sunk low enough – think of all those TPL examples earlier – the analyst
 might adjust his or her recommendation to ‘accumulate’, meaning you can begin buying again, because
 that probably means there’s a buy recommendation to follow. Aside from possibly recognizing short-term
 gains taxes with each sale, one would have lost out, with each ‘accumulate’ recommendation, on much of
 the subsequent price recovery. In reality, TPL shareholders didn’t have to suffer that problem, since there
 were no analysts covering TPL until this year. And that, interestingly enough, was only because the shares
 weren’t tradeable enough to serve as a transaction-oriented security. (And, if you’re curious, that one TPL
 analyst has already altered the price target.)

 Unlike the 'sell-side' convention, there are only a few investments for which we've ever established a target
 price. In those cases, there has usually been an objective date and/or valuation component. Examples
 would be a distressed bond, or an equity with a contractual buyout provision for which there are pre-
 established pricing metrics by which both parties will abide, or sometimes in bankruptcy or liquidation.

© 2021 Horizon Kinetics LLC ®                                                                            Page | 13 of 33
MARKET COMMENTARY
1st Quarter 2021 April 2021
But for most stocks, which represent an interest in operating businesses,
there cannot really be a defined price, except for one arrived at by To capture the power of
negotiation if the owner wants to sell the business to a buyer. From month compounding, you want
to month and year to year, business conditions are in flux – changes in fewer, not more, decision
market share, raw materials costs, product improvements, regulations, and making points.
on and on. And some of these changes, like an increase or decrease in debt
level, don’t just alter earnings; they alter the valuation multiple that might be paid for those earnings. A
price target is a bit like driving a new car off the dealer’s lot; that price might be outdated as soon as it’s
issued.
A much more useful tool is a model that helps you evaluate the changes that occur. Without that, once a
price target is breached, what then? You don’t know what to do until the analyst issues a new price target.
But if you have a business model and valuation model to work with, you have a basis for understanding the
impact of the change. To capture the power of compounding, you want fewer, not more, decision making
points.
Horizon Kinetics writes a lot of company-specific research reports
for institutional investors. Hardly a one has a formal price target. A That’s both a buy recommendation
typical report might frame the valuation something like this; it’s an and a valuation model, yet without
exercise, really: a price target. It is a framework for
− If sales remain stable for the next five years, then Ignored how to calculate value under
Company would be able to repay $x millions of debt. By evolving conditions. A price target
reducing interest expense, earnings would increase by $y, and would be both unnecessary and
its debt leverage would decline from Ax total assets to 0.Bx misleading.
total assets.
− Companies of this type with strong balance sheets generally trade at a higher P/E multiple of Gx
earnings, in which case Ignored Company shares would produce a 10% annualized return over a 5-
year investment horizon.
− However, it is reasonable to expect that sales can increase by 3% per year, as they have been for the
past 10 years, without any explicit expansion spending, simply to reflect GDP growth, in which case
the rate of return would be 13%.
− Further, Ignored Company might seek to sell its abandoned industrial park on the shore of the
Sasquasomething River, an area being redeveloped for residential and retail use. This property
contributes no earnings, and is recorded at near zero on the balance sheet, so it is a hidden asset that
could add an additional $z per share of value, or Blank% to the annualized return.
That’s a valuation model at work, a framework for how to calculate value under evolving conditions, yet
without a price target. A price target would be both unnecessary and misleading.
Or, I can write out a price target, but if I'm thoughtful about it, what does it really convey? The price target
suggests a specificity and validity that it doesn’t really have. It would have to be adjusted for each relevant
increment of operational or balance sheet or competitive change. But the price target informs
people’s expectations. Therefore, it’s natural for someone to then inquire, whenever the share price
© 2021 Horizon Kinetics LLC ® Page | 14 of 33MARKET COMMENTARY
1st Quarter 2021 April 2021
exceeds the target, about ‘locking in’ profits. Or to ask why we might have changed our price target. There
are so many discussions to be had. Brokers love them.
Or, instead, I can rely on the business model and general valuation. Call it a mode of analysis that sacrifices
presumptive accuracy for fuzzier thinking that just attempts to be correct as to direction and order of
magnitude. As in, I’d rather be approximately right than precisely wrong.
Applied to TPL, we can now identify a sufficient variety of positively contributing variables, each in a
different stage or timeline of expressing itself, we can see the futility of presuming to establish an honest
precise price target. Not all of the variables will manifest themselves, or they will manifest to a greater or
lesser degree. And the time frames are unknown.
Here’s a fresh example that I couldn’t have scripted better myself:
Last year, Chevron, one of TPL’s primary royalty payers, drastically reduced its capital budget for drilling
in the Permian Basin. So much so, it made really big news.
Six weeks ago, on March 9th, Chevron re-established its spending budget and reaffirmed its ambitious
expansion intentions.
As sell-side analysts, we would first have issued some number of ‘updates’ with new price targets and
new recommendations, and then followed those with some series of sales and, a year later, with buys.
The shares are about 25% higher than on the day of that announcement.
But we don’t govern our decisions on the basis of short-term price changes or short-term events that we
don’t believe meaningfully alter the business model or long-term value.
Our analysis does tell us that the ultimate value of TPL can be many multiples of the current price and that,
barring any intervening real-world changes that cause a reassessment of the business and valuation model,
we expect to own the shares for many, many years.
How to Interpret the TPL Presentation Deck
Our primary TPL analyst, James
Davolos, tells me that the most
important additional disclosure
in the TPL presentation deck
pertains to the water busi-
ness. The water business has
transitioned from, originally,
100% sourced water to, now, a
50/50 mix of sourced-to-pro-
duced. Sourced water is pro-
vided to oil & gas production
companies, which require it for
drilling, and comes directly
Source: TPL March 2021 Investor Presentation
from TPL's sub-surface water
© 2021 Horizon Kinetics LLC ® Page | 15 of 33MARKET COMMENTARY
1st Quarter 2021 April 2021
aquifers; it is a higher margin, lower volume, non-recurring revenue stream. None of this water is potable,
either for drinking or agriculture. Depending on whether it is from the aquifer or from the shale formation
below the aquifer, it is brackish (mostly due to salinity) and/or both brackish and toxic (being suffused with
the hydrocarbons with which the bedrock itself is suffused).
The produced water is what comes up from the well along with the oil. Something must be done with that
water. The operator has to pay for disposal: to cart it away in trucks, in a pipeline, or to recycle it;
somewhere in this mix there is a cost floor. This is what TPL recycles so that it can be returned to the driller
for continued use in the drilling process. The produced water segment is a lower margin, much-higher-
volume business and produces recurring volumes over the production life of the well pad.
The ratio of produced water per barrel of oil, for a driller, is low at first but begins to climb after the first
year or two, to a ratio of, say, 10:1. From the recycler's perspective – TPL's – the rising water/oil ratio over
time improves its recurring-revenue experience.
Speaking of constantly changing business conditions and the self-defeating nature of price targets:
− based on the March 2020 disclosure, James was working on the assumption of 817,000 bbl/day
produced capacity, with 1.57 million additional permitted capacity.
− Today, though, there are 1.6 million bbl/day active capacity, plus 2.9 million barrels of additional
permitted capacity.
− Based on this information, water revenue might end up equaling or exceeding oil and gas revenue.
An additional item of note is the SLEM revenue, SLEM being an acronym for Surface Easements, Leases and
Material. Material is, for the most part, caliche, which is calcium carbonate and which is plentiful in the
area. It is used for road construction and other infrastructure. Slide 14 in the March 2021 TPL investor
presentation shows that the SLEM revenue continues to track at $60,000 revenue per gross well drilled in
2020, despite the spending slow-down last year. One way to assess this revenue is that there
are approximately 20,000 wells on TPL surface land, plus at least another 20,000 wells on adjacent land
(which usually entails that the operator will have to cross or use TPL land and pay an easement fee). At
$60,000 per contract, this would work out to over $2.4 billion in ultimate easement revenue, before
including other developing uses, such as for solar and wind power installations, or other infrastructure
related construction as usage density in the Delaware basin rises.
There is another intriguing dimension to the SLEM revenue
trends. The first 10-year-term easements (which was a new The Northern Delaware is the highest-
contract structure) began in the 3rd quarter of 2016, so they have resource, lowest-cost portion of the
yet to roll over. When they do expire, assuming the land is still in broader Permian Basin, to which TPL
use, new leases will be priced at a new CPI-indexed figure. The has a high surface area and royalty
2017-year SLEM revenue was $85 million, so when this rolls over in exposure. This core area is less than
2027, including the inflation multiplier adjustment, all else equal, it 11% developed on TPL land.
could easily be one-third higher.
© 2021 Horizon Kinetics LLC ® Page | 16 of 33MARKET COMMENTARY
1st Quarter 2021 April 2021
Ultimately, the infrastructure density in this area of the Permian (Northern Delaware Basin) will be far, far
higher. It doesn’t yet begin to compare with the Midland, Texas density, which has been generations in the
making.
Finally, the land/royalty concentration in the Northern Delaware Basin, and the percentage of undeveloped
acreage, are important differentiating points for TPL. The Northern Delaware is the highest-resource,
lowest-cost portion of the broader Permian Basin, to which TPL has a high surface area and royalty
exposure. This core area is less than 11% developed on TPL land.
All the ‘Bad’ Oil News Questions
Everything ‘bad’ that’s happened
A couple of repeated requests have come in, seeking our response
to some apparently bad news for TPL. to the energy markets this past
year has been – strangely, yet
None of it, though, was bad news. As paradoxical as it might seem, predictably – good for TPL.
this past year’s dislocations in the energy markets, and a variety of
related challenges, have only served to highlight TPL’s pre-eminent asset quality and strategic position in
the energy sector. They’ve actually enhanced its value. I’ve saved this section for last, because the
preceding discussion on the difference between the conventional short-term price-based model and a long-
term business valuation model should make these counterintuitive answers much more comprehensible.
Here are a couple of those items.
− Oil demand is down, and oil prices are down. What will happen to TPL?
o The price of oil is higher than it was in January 2020, before the global pandemic and the collapse
in demand, not lower. This is despite the fact that we're still in the midst of a historic decline in
travel activity worldwide. Why would oil prices rise even though activity is down? Supply and
demand – the other magic formula.
Yes, oil consumption fell 31% in April 2020.
BUT oil consumption today is actually higher than it was a year ago! It’s up more than 45%
from last April.
DOUBLE-BUT, U.S. crude oil production is 16% lower than in January 2020, and it’s 10% lower
than in April 2020.
This is DESPITE the pandemic lockdowns, despite the economic contraction from those
lockdowns, and despite the increased use of alternative energy sources.
TAKE-HOME CONCEPT: Supply has decreased an awful lot more than demand (and it hasn’t
recovered). 4
4
https://www.mrt.com/business/oil/article/U-S-Oil-Output-Nears-Levels-Not-Seen-Since-16097668.php
© 2021 Horizon Kinetics LLC ® Page | 17 of 33MARKET COMMENTARY
1st Quarter 2021 April 2021
o Little by little, April 2020’s excess inventories are being drawn down. Simultaneously, demand
has gradually risen from those lows and is now higher than it was one year ago. All of this was to
be expected, as we wrote about last year. Once excess inventories are depleted, it will quickly be
discovered that supply plunged but has not recovered. More importantly, that supply won't be
able to be restored for
a very long time. An Week of Week of 4 Weeks to
upward oil price shock 4/9/21 4/20/20 4/12/19
should be expected. Total oil consumption *** (000 bbl/day)l 20,328 13,797 20,084
Total domestic production (000 bbl/day) 11,000 12,300 12,150
That would be a boon
Commercial stocks** (mill bbl) 492.4 503.6* 455.2
to TPL, which has
operated extremely *Week of 4/10/20
profitably for most of ** Excluding Strategic Petroleum Reserve
a decade with declin- ***https://ir.eia.gov/wpsr/overview.pdf
ing oil prices.
− The Biden administration is banning fracking. What will become of TPL?
o The government can ban drilling on federal land, not on private land. TPL is a private landowner,
so it is not subject to any such actions.
o The administration did not ban fracking. It has paused new oil and gas leases on Federal lands.
o This benefits TPL. Federal drilling leases are less expensive than private leases, and substantial
tracts of such Federal property in the Delaware Basin are immediately nearby private property.
Paradoxically, the Federal restrictions will increase activity in the acreage in/around TPL, because
as existing Federal leases expire, those operators will shift their activity elsewhere in the vicinity.
− But what if oil use does go down in the U.S. Won’t TPL suffer?
o Which brings us back to the Delaware Basin. Even if oil use were to decline in the U.S., which is
not at all clear – that’s a separate discussion – it’s difficult to imagine that production volumes
would suffer in the Delaware Basin, since that is the most plentiful and most profitable source of
oil in the U.S. The loss of production volumes would be borne by operators in other regions, which
would shut down their most marginal, expensive production. The Delaware Basin is where the
activity will focus, and its strategic position should be enhanced.
o To see why, take the last normal year, 2019, before the pandemic. U.S. oil production grew by
11% to a record. Texas accounted for over 40% of total U.S. oil production. Just the Permian
region within Texas accounted for 53% of the total U.S. increase for the year.
And, yet, three of the largest producing counties in Texas (out of 254 counties), Midland County
and two of the Delaware Basin counties, Reeves and Loving, accounted for only 9% of U.S. output.
That’s only one month of U.S. oil needs; and the Delaware Basin counties, at this point, could
provide only a couple of weeks of U.S. needs.
Reeves and Loving are the most productive areas for TPL, and that area was quite profitable for
the oil companies at the $50 to $60 a barrel that prevailed in 2019. If oil demand and, therefore,
production, in the U.S declines – which it isn’t, it’s now rising – the declines will be elsewhere, not
in the Delaware Basin.
© 2021 Horizon Kinetics LLC ® Page | 18 of 33MARKET COMMENTARY
1st Quarter 2021 April 2021
Bitcoin… Our Inflation ‘Bet’… and, Are We Still Value Investors?
On the practice of position size, we’ve mostly covered that with
TPL. But bitcoin has unique features as it relates to sizing. In one sense, TPL and Bitcoin are
actually very much alike – in terms of
In one sense, TPL and Bitcoin are actually very much alike. They inflation/price protection.
are each possibly the most effective instruments we could find to
protect against the two most important sources of inflation risk: TPL hedges oil, which ends up in the
price of just about everything. Bitcoin
For TPL, that would be the key commodity in any industrial hedges money, which is the price of
economy: oil. The price of oil ends up in just about everything. everything.
In the case of bitcoin, that would be monetary debasement, which is…the price of everything; it’s our
money. A high, chronic inflation rate will devastate a person’s accumulated savings and retirement
income.
In another sense, TPL and bitcoin are wildly different. TPL is about the least risky business there is. How
many companies in the world have been operating since 1888? If you look hard enough, you can find some.
If you find some, would any of those be bigger today than a decade ago? Would they be growing rapidly?
TPL has no debt, it has minimal operating expenses, it generates an extremely high profit margin whether
oil prices are high or low, and has about the best energy asset portfolio there is. It’s very difficult to conceive
of it failing under any ordinary business circumstance.
Bitcoin was the precise opposite when originally purchased in portfolios. It was about the highest-risk asset
imaginable: brand new, still unproven, still in technical improvement mode, and considered so exotic that
the mention of it in polite company might brand the presumptive raconteur as an oddball.
Each embodied diametrically different levels of risk. But that was handled easily enough – it simply meant
that we should adjust the amount of capital invested in each to reflect their differing levels of risk.
TPL was purchased as a sizable core investment.
For Bitcoin, the amount of capital put at risk bordered on de minimis, which I define as an amount
no one would notice. Which, if you think about in a certain way, makes it completely NOT risky to
the owner of that portfolio. If it were a one-half of 1% position to start, that’s an amount by which
any stock portfolio varies in a given day. In fact, on the afternoon that I’m writing this paragraph,
the S&P 500 was down 0.41%, and nobody cares.
After the huge appreciation of the past few years, that 0.5% Bitcoin investment might now be a 10%
position, although any given account can have a very different weighting. Is that too large? Should profits
be ‘booked’? No, we don’t believe that they should.
© 2021 Horizon Kinetics LLC ® Page | 19 of 33You can also read