U.S. Timberland post-recession - Is it the same asset? Jim Rinehart R&A Investment Forestry
←
→
Page content transcription
If your browser does not render page correctly, please read the page content below
U.S. Timberland post-recession
Is it the same asset?

                        Jim Rinehart

                        R&A Investment Forestry
                        April 2010
TABLE OF CONTENTS

About…………………………………………………………………………………………………………………………………………………………..i

EXECUTIVE SUMMARY………………………………………………………………………………………………………………………………… 1

U.S. Timberland Post-Recession............................................................................................................................ 11

   Part 1: Evolution of timber as an investment class ............................................................................................. 12

   Part 2: A Review of Attributes ............................................................................................................................... 18

   Part 3: Components of Value: ............................................................................................................................... 24

   Part 4: Economic Outlook...................................................................................................................................... 31

   Part 5: U.S Timberland post-recession – Is it the Same Asset?.......................................................................... 39

   Part 6: What Should Investors Do?....................................................................................................................... 46

Our Conclusion....................................................................................................................................................... 47

References cited .................................................................................................................................................... 48
About R&A Investment Forestry

       R&A Investment Forestry is a broad-based forest investment management and advisory company
       focusing on institutional investments in forestland. In the U.S., with a growing focus on environment,
       we have particular interest in the interface between financial investors and Conservation. R&A’s
       expertise derives from Jim Rinehart, its President, and our broad range of associates developed over
       25 years in the forest investment industry. With deep global relationships and no allegiance to any
       given manager, R&A manages specialized property-specific direct investments and provides
       dispassionate strategic advice directly to institutional investors.

       R&A Investment Forestry
       San Francisco, CA
       415-242-1389
       Rinehart@investmentforestry.com
       www.investmentforestry.com

       About Forest Economic Advisors, LLC

       Section 4, Economic Outlook, was contributed by Forest Economic Advisors LLC (FEA), a Boston area-
       based forest economics and forecasting firm with strong ties to the forest investment community. FEA
       is an owner-operated company comprised of engaged, experienced and informed analysts covering
       the forest products industry for 15 years. For much of that time, R&A has relied on the FEA team to
       provide actionable information, rigorous analysis, insightful rationale, and disciplined economic
       outlook.

       Forest Economics Advisors, LLC
       Westford, MA
       978-496-6334
       info@getfea.com
       www.getfea.com

U.S. Timberland Post-Recession — R&A Investment Forestry – www.investmentforestry.com                       i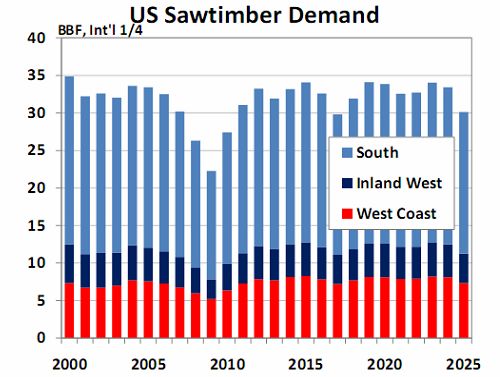
EXECUTIVE SUMMARY
___________________________________________________________________________________________

U.S. Timberland post-recession
Is it the same asset?
Since its inception as an investment asset class in the mid-80s, the institutional timberland portfolio has grown
from less than $1.0 billion to a global portfolio of more than $50.0 billion, primarily in the U.S. As the primary
providers of timberland supply, the U.S. forest products industry has effectively exited timberland ownership. At
the same time, timber production has come to share the stage with real estate, which today can comprise 40%
or more of timberland value. And Conservation has come to play a more central role in shaping perception,
acquiring easements, even timberland, as fee simple owners. All of these changes have implications for the
key portfolio attributes that timberland traditionally brings, including (1) high risk adjusted return, (2) low
correlation with other financial assets, and (3) ability to hedge inflation.

    U.S. Timberland will decline another 10% to 15% in value. Timberland has faired better than expected
    through the economic crisis, having lost only 4.75% of value in 2009, as measured by the NCREIF
    Timberland Index. It is the view of R&A Investment Forestry that another 10% to 15% decline has already
    occurred, hidden by low transaction volume and the valuation process. A sense for why this should be the
    case will help to form a rational view of the future.

Part 1: Evolution as an asset class
Timberland has progressed through a series of phases characterized by changing competitive conditions.

1983 to 1995. During its initial stage, forest products demand was high, resting heavily on Japan. Stumpage1
prices were increasing at a real rate of 1.5% per year, competition was low, and values other than timber value
were not considered. Expected real2 returns were 6.0% to 10.0%, depending on region and perceived risk.
Forecasting assumptions were aggressive.

Timberland did well, in part due to the listing of the Spotted Owl and the removal of National Forests as a
source of supply. Stumpage prices sky-rocketed and cumulative return from 1986 to 1992 was 26.75%. By
1995, investment interest was increasing rapidly in hopes that this high level of return would continue.

1 Stumpage price is the value on a 1,000 board foot basis (MBF) of uncut timber, “standing on the stump”, as
distinguished from delivered log price, which incorporates costs of harvest and delivery.
2 Industry convention generally speaks of return in “real” terms, in this case EBITDDA plus cap ex, net of inflation, i.e.,

operating cash flow in constant dollars. “Nominal” is described similarly but includes inflation. Likewise, changes in
stumpage price, either historical or forecast, are generally expressed in real terms. If inflation were 2.0, real return of 8%
would equate to nominal return of 10%. Similarly, a projected increase in stumpage price of 1.0% real would be 3.0%
nominal.
U.S. Timberland Post-Recession — R&A Investment Forestry – www.investmentforestry.com                                            1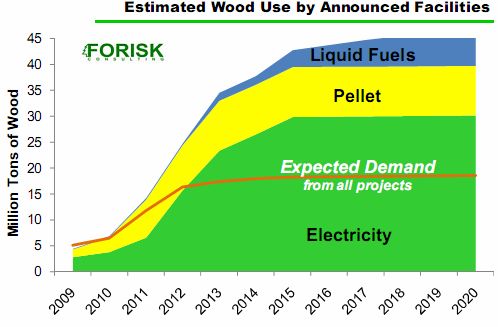
EXECUTIVE SUMMARY
___________________________________________________________________________________________

1996 to 2000. (See Figure 1) Over-supply was becoming an issue, resulting from enhanced productivity
through technology and increased U.S. and global plantations. At the same time, demand had diminished, due
largely to the demise of the Japanese economy and a resulting 50% decrease in Western lumber capacity.
Meanwhile, more investors wanted in, forcing timberland prices to increase in the face of falling revenues.
Feeding timberland supply was the forest products industry, now in a divestiture mode encouraged by Wall
Street. With C Corp double taxation and low current income, timberland simply became more valuable to
investors than to the industry. The fact that per acre values continued upward in the face of increased supply
attests to the magnitude of capital available from institutional investors. To resolve the C Corp tax handicap,
MLPs and REITs began to enter the scene. Some forest economists feared that the market was becoming
overheated.

From 1996 to 2000, the forest products industry downsized their portfolio by $2.5 billion, mostly sold to
investors through TIMOs. Average annual return from 1996 through 2000 had tapered to a nominal 18.9%,
with 2000 a disappointing 4.4%.

2001 to 2004. (See Figure 2) Just as pressure to “cool down” began, the tech bubble burst, the stock market
declined and still more institutional capital became available, actually accelerating the unprecedented transfer
of assets. Investors became begrudgingly content with projected returns of 5.0% to 6.0% in real terms, which
placed much pressure on managers to eke out more. Investment in long-term “soft” activities gave way to cost-
cutting, eliminating much of the R&D, silviculture, and community relations that industry had invested in. Focus
on parcelization intensified as a means of increasing per acre value.

During this period, the forest industry was the only net seller, shedding 14.1 million acres. Returns, which had
continued downward at the period’s outset, had turned upward on the basis of valuations driven by new high-
priced transactions. Average return for the period was 3.88%, but in 2004 annual return, as measured by the
NTI, was 11.2%.

2005 to 2009. (See Figure 3) By the end of 2009, industry had sold off another $15.0 billion of timberland,
essentially completing the transfer. Weyerhaueser is the only integrated forest products company remaining
and they will convert to a REIT by the end of 2010. From 2005 to 2009, industry gave up another 14 million
acres, with TIMOs acquiring 11 million of that. Annualized nominal return for the period was 10.9%. With the
economic crisis, however, return in 2009 was negative 4.75%.

From 1983 to 2009, 43.4 million acres valued at $39.7 billion changed ownership type. The forest products
industry gave up 37.7 million acres valued at $33.1 billion, while TIMOs and REITs gained 26.9 million acres
valued at $30.4 billion. (See Figure 4).

U.S. Timberland Post-Recession — R&A Investment Forestry – www.investmentforestry.com                         2
EXECUTIVE SUMMARY
___________________________________________________________________________________________

Part 2: Review of attributes
Average Per Acre Value vs. Discount Rate

In general, as weighted average value/acre has increased, discount rate has declined. In 2008, when per/acre
value peaked, it had risen more than 35% in three years. By the end of 2009, price was still 27.9% higher than
in 2005. This has been a period of rapid expansion, high competition, and high demand - conditions ripe for
overheating. Investors should be cautious that returns enjoyed by earlier participants not prove to be at the
expense of new capital. (See Figure 5)

The NCREIF Timberland Index of Return

Performance Over Time. The NTI was established to provide investors an independent measure of timberland
returns. The data series begins in 1987. Figure 6 depicts the timberland index from 1987 forward,
distinguishing between Income and Capital Appreciation, both additive components of return. Timberland has
been exemplary as an asset class.

There are cautionary observations as well. (1) Both performance and expectation have declined over time. (2)
Annual income, primarily from timber sales, has been highly variable as a proportion of total return, but, in
general, it has been downward.

Cumulative Annual Return. (See Figure 7) Cumulative annual nominal return has diminished steadily over time,
from a high of 31.3% in 1989 to 14.1% in 2009. Return since 1997 has declined from 14.75% to 8.5% by
2009. Note that an investor entering at the end of 2007, would be at 2.14% today. Success will become
increasingly dependent on acquisition discipline.

Interpreting NCREIF. The NTI is a useful gauge of performance for an asset class whose value is difficult to
measure and based on relatively few transactions. It does have acknowledged weaknesses. Capital
appreciation, the largest component of return, is based on appraisals. Timberland appraisal in the current
environment relies on few comparables, lags reality, and is “sticky” on the high side, hiding actual value.

Portfolio Efficiency. (See Figures 8 and 9) Timber returns have been argued to have low to negative correlation
with stocks and thus enhance portfolio efficiency. More precisely, timberland appears to have minor negative
correlation in some short-term time intervals, but zero correlation in the mid to long terms – itself a positive
portfolio attribute. Still, differences between assets diminish in periods of economic decline and structural
changes can change relationships. Enhanced efficiency assumes a timber allocation of 10% or higher, where
most have been less than 2%. There is room for higher allocation, but a rush to achieve it will create upward
pressure on price.

Timberland and Inflation. Figure 9 indicates consistent positive correlation between timberland and CPI, which
applies across regions but not within. Further, because price capitalizes expected inflation, true inflation hedge
applies more specifically to high “unexpected” inflation. We believe that timberland, like other “hard” assets is,

U.S. Timberland Post-Recession — R&A Investment Forestry – www.investmentforestry.com                           3
EXECUTIVE SUMMARY
___________________________________________________________________________________________

and will remain a strong inflation hedge. However, the analytical relationship between timberland return and
unexpected inflation shows R2 of only 0.14. A revised statistical strategy that will reveal higher statistical
confidence would be useful.

Part 3: Components of value
Timber Component. While valuation has become increasingly complex, the essential calculation of acquisition
price remains based on discounted operating cash flow over a defined time period. Exit is depicted as a
hypothetical sale. Calculation of expected income from timber applies a real price appreciation rate (RPAR),
which is now generally set at zero except in periods of price recovery or decline, when stumpage price can
change sharply. Applied real discount rates have declined from a range of 6.0% to 10.0% to a range of 4.5% to
5.5% across all regions.

Underlying Land Value. Previously, value of underlying land was simply the NPV of future harvest in perpetuity.
Today, bare land has intrinsic value higher than value in growing trees, even where its applied use will remain
in timber for the foreseeable future. This value is based largely on access and the regional culture of land use.

HBU – Parcelization and Development Value. HBU (Higher and Better Use), referring to value in a higher
economic use, has joined timber as a factor in timberland investing. The line of demarcation tends to be legal
parcelization, which allows large tracts to be subdivided into parcels that can be sold separately at higher per
acre values. HBU increases with available infrastructure. Non-timber value of remote timberland can represent
5.0% to 40.0% of total where parcelization has occurred. Where non-timber values are high, the investment
may still be sound, but the interaction between components has become increasingly complex, each requiring
separate assessment, risk analysis, and strategy.

Biomass. Woody biomass has received much attention as a source of renewable energy for heating, electricity
and transportation. In the U.S. South, renewable energy competes with pulp and paper as a biomass use,
which provides investment upside. However, there are factors that will limit the impact of new apparent
demand. (1) Demand for biomass will first simply replace diminished demand for pulpwood by a receding pulp
and paper sector, (2) less than 50% of announced biomass projects are likely to become operational (See
Figure 10), (3) the need for low-cost biomass feedstock will limit the ability of price to exceed cost of
production.

Climate Change and Carbon Credits. Reducing and monitoring greenhouse gases (GHGs) relies on new and
costly technologies. GHG reduction policy alternatives involve limiting emissions and either taxing excess or
developing markets for “carbon offsets”, so-called “cap and trade.” Forests absorb carbon and it is thus
tempting to view carbon offsets as a marketable forest product. There are impediments, however, including (1)
lack of global cooperation, (2) complexities of carbon accounting that can allow “gaming” the system, (3) high
opportunity cost of offset production vis a vis higher value products like sawtimber. Cap and trade is not
assured, and, in fact has been declared “dead” by some inside observers.

U.S. Timberland Post-Recession — R&A Investment Forestry – www.investmentforestry.com                            4
EXECUTIVE SUMMARY
___________________________________________________________________________________________

Payment for Ecosystem Services (PES). Ecosystem services comprise all of the environmental benefits that
result from forests, including drought and flood mitigation, run-off regulation, biodiversity and others. The
potential for PES has resulted in a growing investment industry that creates and markets mitigation units to
developers and emitters or to polluters who have incurred liabilities for natural resource damage.

Ecosystem Marketplace, a private non-profit, forecasts a combined global PES market of more than $1.0
trillion per year by 2020. (See Figure 11) This estimate is highly generalized, based on sparse information, and
cannot be verified. To the extent that such a market materializes, forest investors will benefit.

Conservation. During the past decade, Conservation has come to see sustainable harvest as a goal preferable
to fragmentation and development. Some larger conservation organizations, such as The Nature Conservancy
and the Conservation Fund, have acquired timberland on their own behalf. NGO (Non-Government
Organization) capital has been limited, however, and transactions have focused on the Northeast and North
Central regions where per acre values are low and environmental payout is high.

There is opportunity for financial investors and Conservation to align. Where conservation and financial values
can be separately assessed, financial investors may operate subject to a “working forest easement” that
constrains defined management options, primarily parcelization. In this case, Conservation “co-invests” by
acquiring and retiring development rights, leaving the financial investor with a pure timber investment.

There are risks. (1) removal of development value diminishes down-line options, (2) easement restrictions tend
to be perpetual in nature, (3) to the extent that potential exit buyers are averse to easement risk, liquidity is
diminished.

Part 4: Economic Outlook
(Contributed by Forest Economic Advisors, LLC)

Macro Outlook (See summary table, Figure 11)

GDP. The US and Canadian economic recoveries are in an early stage, with household indebtedness and
sluggish job markets ensuring that recovery will be slow. Return to full employment will take another three to
five years and lingering effects will last through the decade. GDP growth rate will decline to 2.0% to 2.5%, and
will average 2.5% between 2010 and 2025.

Inflation. Employment overhang will balance public debt, resulting in inflation under 2.0% for at least another 2
years. Over the next 15 years, inflation will average 2.4% in the U.S.

Oil. The FEA forecast shows a generally appreciating trend from 2010-2025, with benchmark prices averaging
$86 per barrel (in 2008 dollars) and varying from $60 to $105.

U.S. Timberland Post-Recession — R&A Investment Forestry – www.investmentforestry.com                          5
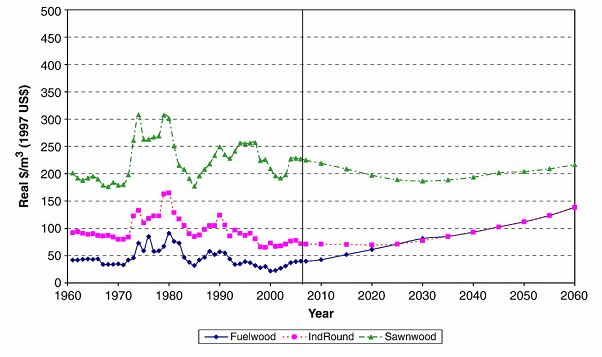
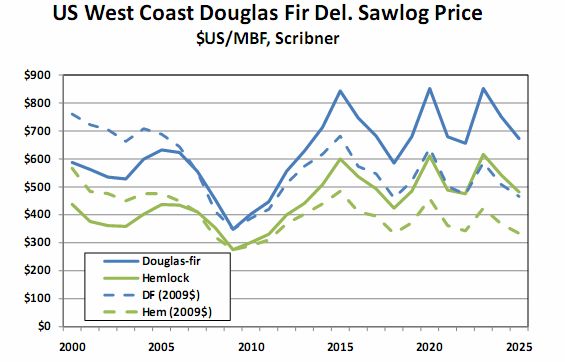
EXECUTIVE SUMMARY
___________________________________________________________________________________________

Housing Outlook (See Figure 12)

Housing starts will recover gradually in 2010 and remain well below underlying demand in 2011. Over the
longer term, favorable demographic trends assure that home-building will return at least to levels seen in the
late 1990s and early 2000s. Housing will trend toward more multifamily homes, so per unit wood usage will
diminish. Home size will diminish as well.

Forest Products Outlook

Solid Wood Products and Panels. With a pending recovery of residential construction and improvements, the
long-term outlook for solid wood products is positive. Recovery in the short term, however, looks daunting.
While year-over-year percent increases will be impressive, actual consumption will remain weak. In the longer
term, demand will return to a more normal cyclical pattern.

Pulp and Paper. The outlook for pulp and paper as a source of timber demand is grim. Facing electronic
substitution, the traditional link between real GDP growth and graphic paper consumption has been weakened
in all economies, but particularly in developed nations. US graphic paper consumption and production will
decline by 25 to 30% over the next 15 years.

The long-term outlook for the US paper packaging sector is mixed. Paper packaging follows manufacturers of
nondurable goods, which explains China’s explosion in paperboard capacity over the last decade. On the
positive side, the primary substitute for paper packaging is plastic, which is vulnerable to rising oil prices as
well as environmental regulation. Consumption of paper packaging will remain at current levels.

Pulp producers face competition from offshore, particularly South America. Import share of pulp will increase
from 10% to 17%.

The US Timber Outlook
Sawtimber Markets. (See Figures 16 a & b) The current rally notwithstanding, recovery in sawtimber markets
will likely be modest in the near term, with total consumption remaining below pre-recession levels until 2012.
Timber owners have deferred harvest during the last four years, resulting in an accumulation of merchantable
volume, which will further limit price recovery in the near term. In the mid to long term, prospects for sawtimber
improve substantially with the recovery of housing.

Significant shifts in North America’s sawtimber supply will also support higher sawtimber pricing. US market
share will increase as a result of the Mountain Pine Beetle outbreak in British Columbia, which will have killed
70% of BC lodgepole pine by the time it is over. Adding to supply pressure, 8.5% of Western sawtimber will be
lost to HBU.

The combination of strong demand and a significant loss of supply will support a robust recovery in sawtimber
pricing over the next 15 years. Inflation-adjusted sawtimber prices are expected to be near their peak levels of
2004-2005 by mid-decade. Imports and improved sawmill efficiency will limit increase beyond that.

U.S. Timberland Post-Recession — R&A Investment Forestry – www.investmentforestry.com                           6
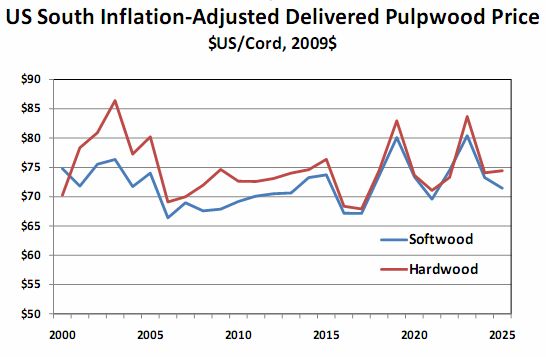
EXECUTIVE SUMMARY
___________________________________________________________________________________________

Pulpwood Markets. The outlook for US pulpwood markets is mostly positive, with regional variation between
the major producing regions. In the near term, economic recovery and a weaker US dollar will support modest
improvement for U.S. pulp, paper, and OSB mills. In the longer term, diminished U.S. paper production will be
offset by demand for biomass as renewable energy.

Woody Biomass. Growth of renewable energy and resulting increased demand for woody biomass will not bring
substantial marginal value to forestland owners. Increased roundwood demand for bioenergy will simply offset
a decline in pulpwood demand from a declining paper industry and high harvest and delivery costs will fully
absorb stumpage profits. Further, relatively low competing energy prices will restrain potential price run-up.

Part 5: Post-recession timberland —
Is it the Same Asset?
The following represents the scenario most likely in the view of R&A Investment Forestry.

Will Timberland Value Decline?
Of key concern to timberland investors is timberland valuation and the potential for further correction. By
second quarter of 2008, it had been our sense that the market had become overheated and more restraint
was necessary – which we stated in a presentation to the Who Will Own the Forest conference in Portland, OR
on September 8, 2008. The fall of Lehman Brothers one week later underscored the point. In the months
following, it had been our expectation that portfolio values would be off by 20% by EOY 2009, equating to an
increase in discount rate of approximately 200 basis points.

 That decline has not yet manifested itself. Portfolio value at EOY 2009 was off by only 4.75%, as measured
 by the NECREIF Timberland Index. It remains our sense that the true correction remains hidden behind low
 transaction volume and valuation mechanics and that timberland value has, in fact, already declined in real
 terms by another 10% to 15% of “pre-crash” value. Value will trend upward from there. If substantial
 transactions occur by EOY 2010, this decline will likely be reflected in the NTI.

What Leads Us to This Conclusion?
Appraised Values Lag Reality. Timberland portfolios are revalued through a “mark-to-market” appraisal
process. With low transaction volume, evidence on which judgments are based is sparse. Thus appraisers
must rely on few and outdated transactions that do not fully reflect current value, causing appraisals to be
“sticky” on the high side. Given the current bid/ask spread, and the fact that typically low debt levels fend off
distress, this circumstance could last considerably longer. Ultimately, however, markets move and appraisers
will appraise closer to reality.

U.S. Timberland Post-Recession — R&A Investment Forestry – www.investmentforestry.com                          7
EXECUTIVE SUMMARY
___________________________________________________________________________________________

Economic Recovery Will Be Slow. The U.S. economic recovery will take an extended period to complete. Real
stumpage prices most likely hit bottom in 2009, but will not be at their 2005 levels in real terms until 2015
and will not return to 2000 levels in the foreseeable future.

The Nature Of Housing Demand Has Changed. Deep corrections can be structural. If the current circumstance
creates a cultural propensity to delay household formation, pent-up demand will not be fully realized and
housing recovery will be delayed.

Higher Perception of Risk Will Raise Discount Rate. The level of long-term risk in timberland has been under-
acknowledged. While the standard measures of return volatility indicate relatively low risk, timber rotations
transcend business cycles, exposing timberland to longer term risk. The Mountain Pine Beetle is a case in
point.

It is our sense that discount rates for timberland will return to 6.0% to 7.5% real for an extended period until
new revenue sources solidify and prove sound for the long term. The market is as yet undecided.

Timberland Supply and Demand are Uncertain. For 25 years, the primary supply of timberland has been the
forest products industry. With their exit, new supply must come from existing financial investors whose
acquisition behavior is well known but whose divestiture behavior is not. Expiration of closed end funds is one
possible source. REITs, with a preference for mature age classes, may provide another through divestiture of
young stands.

As relates to demand, there is some speculation that timberland might reintegrate to a degree around
renewable energy. We see this as unlikely, except at very early stages of the industry’s development, on the
same grounds that paper companies divested of their timberlands. Renewable energy depends on inputs of
low cost raw material, and highest forest value will remain in sawtimber, with housing as the primary end use.

Liquidity Will Bring A Premium. The economic downturn has left pensions and endowments strapped for cash.
This will take years to correct, which in the near to mid term will lower the level of demand for timberland with
young age-class distributions, giving an edge to properties with higher near term cash flows.

Carbon Offset is Not a Forest Product. There is much uncertainty around the potential for carbon offset
markets and we are skeptical that they will develop in the near term or in a structure that will make carbon
credits a reliable source of revenue. Investment in carbon offsets may be appropriate for funds targeted to
speculative return, but they are not a forest product and should not be part of a forest investors’ acquisition
analysis.

Biomass Will Be Important – But Will Remain the Lowest Value Forest Product. Renewable energy from forest
biomass will be additive or neutral to value, but it is not likely to lead to substantive additional value.

 Not a game-changer. While total demand will increase by 60%, biomass will not be the game-changer that
 some have hoped for. Sawlogs for lumber will remain the core source of timberland value.

U.S. Timberland Post-Recession — R&A Investment Forestry – www.investmentforestry.com                          8
EXECUTIVE SUMMARY
___________________________________________________________________________________________

HBU Values will Increase. US Population is expected to increase by 42% by 2050. Demographics and
population dynamics favor the continued increase of HBU as a component of value. However, its risk profile is
not the same as pure timberland, which should be acknowledged in acquisition analysis.

Ecosystem Services Could Be a Long-Term Game-Changer. Environmental awareness has increased
exponentially during the last decade and some environmental outputs have already come to market. However,
the importance of the economic role of ecosystem services must currently be characterized as a guess. It may
prove to be the most important component of timberland value, but not in a currently investable time frame.
Different risk metrics must be applied.

Part 6: What should investors do next?
    •   Develop a Plan. This is a time for research and outreach that will provide for considered action as
        opportunities arise.

    •   Develop Internal Expertise. Timberland has become a far more complex asset. The next period will
        reward a higher level of internal capability and proactive engagement on the part of investors and their
        direct advisors.

    •   Be Selective. For the next year, values are more likely to decline than increase. Sound acquisitions will
        be opportunistic for the time being. Discipline will serve well.

    •   Avoid the Bandwagon. Overheated expectations of additional value from carbon, biomass, and other
        emerging revenues are unrealistic. New revenues take time to develop and will likely take a form that
        differs from current expectation.

    •   Get to Know the Timberland Investment Managers. The array of managers has expanded, providing
        both more options and greater performance variability. Be proactive in getting to know them. Internal
        expertise will make specialized local management an option.

    •   Retain Discretion And Control. Separate accounts or other routes to retention of control may serve
        better in some circumstances than traditionally structured and less liquid commingled funds.

    •   Peak Values Are Behind Us for the Time Being. If you currently own timberland and have the sense
        that the market is still at 4.5%, your strategy should reflect that.

U.S. Timberland Post-Recession — R&A Investment Forestry – www.investmentforestry.com                          9
EXECUTIVE SUMMARY ___________________________________________________________________________________________ Our Conclusion? In a September 2009 newsletter, Morningstar drew the conclusion that “The party’s over!” While we would characterize it otherwise, it is true that expectations of dramatic returns of 20% or more that timberland has enjoyed during narrow time intervals in the past are unlikely to be met in the future. Conversely, apparent real discount rates of 4.0% to 5.0% are not reflective of the inherent long-term risk of the asset. We think upward adjustment to 6.0% to 7.5% real is likely and it could be higher – or lower - depending on site specific circumstances. Anticipated adjustments will likely manifest themselves during the next 12 months. When that occurs, timberland value will grow from there, generating a return reflective of its risk. With expected population growth of 42% by 2050, increased housing demand, and pressure on HBU, timberland is favored by the long term. In fact, the party is not over, it has simply become less raucous. Timberland will continue as a steady asset, retaining an important role in institutional portfolios. U.S. Timberland Post-Recession — R&A Investment Forestry – www.investmentforestry.com 10
U.S. Timberland Post-recession
       Timberland became an institutional investment asset in the mid 1980s. Since then, the total
       institutional timberland portfolio has grown from less than $1.0 billion focused on U.S. timberlands to
       more than $50 billion globally and from less than 1.0 million acres to more than 50.0 million.
       Timberland investment managers have grown in number from 3 to 24. The integrated forest products
       industry in the U.S., which once owned the majority of industrial timberland, has effectively exited
       forest ownership. Investment value, which in earlier stages was comprised primarily of timber and
       underlying bare land values, must now resolve non timber real estate values (HBU in the vernacular of
       the industry, for “Higher and Better Use”), which in some cases can be as much as 40% of total
       property value. In addition, Conservation has come to play a more central role, changing the very
       vocabulary of the business from “timberland”, with its implied focus on fiber and solidwood outputs, to
       “forestland”, which encompasses habitat and ecosystem values in addition. All of these changes have
       implications for the key portfolio attributes that timberland traditionally brings.

       The most important question impinging on forest investing today centers on the aftermath of the
       global financial crisis that struck in September of 2008. Timberland has faired relatively well with
       respect to the resulting value “reset” that has eroded other assets. A sense for why this should be the
       case and a sober assessment of the future will help to determine what to do next, whether one holds
       timberland now or might at some future time.

       The primary purpose of this review is to encourage an updated appreciation of timberland as a
       maturing asset class for institutional investors. No doubt, given an increasing global population and
       inevitable economic recovery, timberland will maintain its appropriate role, but it is not the timberland
       of twenty years ago. A solid awareness of its changing nature and complexity will be useful.

       This discussion considers (1) the history of timberland as a financial investment through the financial
       crisis and nascent recovery, (2) attributes that have drawn investors to timberland and how they may
       have changed, and (3) a rational view of what is likely to be in store.

U.S. Timberland Post-Recession — R&A Investment Forestry – www.investmentforestry.com                        11
Part 1:
Evolution of timber as an investment class
Timberland has progressed through a series of phases, characterized by changing competitive
conditions.
Phase I – 1983 to 1995 - Life Was Easy
Timberland as an institutional investment class is relatively new. Initial investments were “accidental”,
resulting primarily from loan foreclosures by agricultural lenders. They did well, however, and early
investment managers, realizing timberland’s arbitrage potential (Rinehart, 1985) began to pursue
opportunities on behalf of institutional clients, mostly buying non-strategic lands from forest product
companies. From its earliest point, timberland was found to have three key portfolio attributes: (1)
high risk adjusted return, (2) low correlation with other financial assets, and (3) good inflation hedge.
These remain the basis of investor interest in timberland today.
During this period, the primary efforts of Timberland Investment Management Organizations (TIMOs)
were in marketing an unknown asset class to a very cautious pension investor. Persistence prevailed,
however, and by the mid ‘90s the TIMO industry was underway. Forest products demand was high, in
part due to a booming quality-oriented Japanese export economy, timber was perceived as being in
short supply, and stumpage prices were enjoying appreciation rates of 1.5% per year, net of inflation,
with no sign of slowing. Forecasting assumptions were assertive. Competition was low, operating at
the periphery of the forest products industry, and values other than timber value were not, in general,
part of the equation. Thus HBU, where it existed, came along for the ride. Expected real returns, as
extolled by TIMOs, were 6.0% to 8.0% in the U.S. South and 8.0 to 10.0% in the West – very attractive
in an environment where imperfect markets could easily lead to windfall.
Those who took the plunge were well rewarded. When the Spotted Owl was listed in June of 1990,
National Forests essentially ceased harvesting timber, western supply dropped by 50%, mills began to
panic and prices shot up even in the South. This single-most important event affecting timberland
value was largely unexpected, by 1992 bringing a cumulative rate of return of 26.75% to early
investors.
But there is room for caution here. By 1995, the number of investors coming into the market was
increasing dramatically, and now they were expecting higher than “expected” returns, putting pressure
on TIMOs to continue to deliver double-digit performance. Managers never promised 23% returns, but
investors nonetheless hoped they would continue.
U.S. Timberland Post-Recession — R&A Investment Forestry – www.investmentforestry.com 12Phase II – 1996 to 2000 – Not So Easy After All
Where 1985 to 1995 had been about market development and client awareness, by 1996 it was
becoming a timber supply story. Soaring log prices, great for timberland investors, had by now caused
Western mills to close and capacity to move to the South, pulling demand with it. Separately, the
bottom had fallen from the Japanese economy and western timber prices had plummeted in the face
of diminished demand. Plantation development and technology had advanced, increasing per acre
productivity to the point that it seemed a “Wall of Wood” was coming from every direction, including
Australia, New Zealand, and South America. A convergence of diminished demand from Japan and
increasing supply from higher productivity and global plantation expansion caused Southern
sawtimber prices to fall 26.9% and western Douglas fir to fall 47.7% between 1998 and 2001. (RISI,
2003)
At the same time, there were more investors buying timberland, forcing timberland prices higher in the
face of declining income. (Aronow, 2004) Feeding the pipeline was the forest products industry, facing
mounting pressure to increase current return on equity. Timberland, with much of its value in the form
of capital appreciation, was not performing well for public companies, most of which were C
Corporations subject to double taxation. This resulted in marching orders from Wall Street to “unlock
timberland value”, i.e., to sell it. Raw material could then be purchased from the new owners. So a
traditional orientation to self-sufficiency began to be replaced by the realization that one needn’t own
the forest in order to have it.
With the forest products industry holding approximately 50 million acres of U.S. timberland and now
willing to sell it, abundant supply could have been expected to hold price in check. The fact that per
acre values continued upward attests to the amount of capital available from institutional investors
and to timberland’s attractive portfolio attributes. In fact, as early as 2001, some forest economists
began to wonder if timberland might be experiencing its own “irrational exuberance.” (Washburn,
2001)
Figure 1 represents net change in timberland value held in six ownership types representing all large-
scale forest owners. In the five year period from 1996 to 2000, a net $5.0 billion of value representing
approximately 7.9 million acres transferred ownership to institutional investors, transacted primarily
by TIMOs. Approximately 50% of this value came from the forest products industry. 3 The rest came
from a single seller, Cavenham Forest Industries, a large arbitrage investor that had accumulated
more that 1.5 million acres in 1985 through a series of corporate takeovers. That was a trickle
compared to what would happen next, but it clearly established that the separation of timber
ownership from processing was gaining momentum and the forest products industry had become net
sellers.
3 In fact, during that period, industry actually divested of $10.2 billion in value, but acquired $7.8 billion back. This would
be the last interval during which industry would be a major buyer.
U.S. Timberland Post-Recession — R&A Investment Forestry – www.investmentforestry.com 13And a new class of investor had entered the scene. In addition to TIMOs, the asset class began to
attract so-called “pure-play” publicly traded corporate-style investors – Master Limited Partnerships
and Real Estate Investment Trusts.
Change in Portfolio Value 1996 to 2000
$6.0
$4.0
$2.0 Arbitrage
$0.0
REITs & MLPs
Value ($Bil)
($2.0)
Conservation
($4.0)
Industry
($6.0)
($8.0) Private
($10.0) TIMO
($12.0)
($14.0)
Ow ner Type
Source: R&A Investment Forestry
Figure 1. Change in Portfolio Value 1996 to 2000
Timberland held directly is highly illiquid - from the time a sell decision is made to the time of actual
sale can be more than a year. REITs and MLPs, with shares publicly traded in the stock market,
resolve this issue. Being tax pass-through vehicles, they also resolve the double taxation faced by C
Corps. So some integrated forest products companies began to convert to REIT and MLP structures.
Like public forest products companies, however, REITs and MLPs, while they avoid double taxation,
are subject to pressure on current income in order to maintain share value. In addition, they are big
borrowers with substantial debt. So when product prices decline, more timber must be harvested in
order to cover debt service, which proved the demise of several early attempts, including MLPs, all of
which sold out, went bankrupt, or converted to REITs.
So by the end of Phase II, the forest products industry had downsized its portfolio by another $2.5
billion and TIMOs had added an equivalent amount to theirs. Average annual return from 1996
through 2000 had tapered to 18.9% in nominal terms, with 2000 a disappointing 4.4%.
Phase III - 2001 to 2004– Looking for a Home
By now, investors began to realize that the returns from inception could not be sustained and that
recent returns had begun to give the appearance of an over-heated market. But just as pressure to
“cool down” began, the tech bubble burst, the stock market declined, and still more institutional
money began looking for a home. The forest industry was happy to oblige, given pressure from Wall
Street, so this period saw an unprecedented transfer of assets from industry to institutional investors.
Timberland attracted an ever increasing supply of capital and investors appeared to be content with
projected returns of 5.0% to 6.0% – or lower. It was, once again, a sellers market.
U.S. Timberland Post-Recession — R&A Investment Forestry – www.investmentforestry.com 14Content was begrudging, however, which placed much pressure on managers to seek return wherever
they could find it. Investment in long-term “soft” activities with uncertain return gave way to cost-
cutting, eliminating much of the R&D, silviculture, and community relations that industry had invested
in. And investors, through their managers, found themselves in the real estate business. Timberland
began to be parceled into increasingly smaller holdings for sale at higher per acre prices.
Figure 2 depicts the change in timberland ownership between 2001 and 2004. Note that the exit of
forest product companies from timberland ownership is now in full swing. Industry has shed another
$11.0 billion and REITs, primarily Plum Creek, have established themselves as even bigger buyers
than TIMOs. The forest industry was the only net seller.
During this period, private investors and arbitrage funds played a substantial role to the tune of about
$1.7 billion. These are very large investment specialists who acquire companies whole, then increase
value by spinning off assets. They are highly leveraged, very savvy investors with little patience for long
term forest ownership.
Change in Portfolio Value 2001 to 2004
$6.0
$4.0
$2.0
Arbitrage
$0.0
Value ($Bil)
-$2.0 REITs & MLPs
-$4.0 Conservation
-$6.0
-$8.0 Industry
-$10.0 Private
-$12.0
TIMO
-$14.0
Owner Type
Source: R&A Investment Forestry
Figure 2. Change in Portfolio Value 2001 to 2004
Returns, which had continued downward at the beginning of this period, had turned upward on the
basis of valuations driven by new high-priced transactions. Long-term asset or not, this was a matter of
timing. Average return for the period was 3.88%, but in 2004 annual return, as measured by the NTI
went again to 11.2%.
U.S. Timberland Post-Recession — R&A Investment Forestry – www.investmentforestry.com 15Phase IV - 2005 to 2009 – The Process is Complete
Arbitrage investors are focused on speed. In this case, they entered in 2004 and were gone by 2006.
The most important change to note, however, is the shocking exit of the forest products industry from
the ownership of timberland. By the end of 2009, industry had sold off another $15.0 billion of
timberland, essentially completing the process. With the sale of Temple Inland for $2.38 Billion in
2007, Weyerhaueser is now “the last man standing.” With 6.4 million acres, they are the only public
integrated forest products company left with significant holdings of timberland and they have
announced their intended conversion to a REIT by the end of 2010.
Note the big buyers in Phase IV. REITs were active to an extent. Three public Timber REITs operate
today, all former integrated forest products companies, together owning 11.1 million acres. Plum
Creek is the largest with 7.3 MM acres, followed by Rayonier and Potlatch. Weyerhaeuser Corporation,
with 6.4 MM acres, will bring the REIT total to 17.5 MM acres, 43% of the total 40 MM U.S. acres held
by institutional investors. 4
Conservation and Private Investors were barely there.
But by far the big buyers were TIMOs, as depicted in Figure 3, picking up another 11.0 million acres
of what industry sold and adding $13.0 billion to their portfolio.
Change in U.S. Portfolio Value 2005 to 2009
$16.0
$12.0
$8.0
Arbitrage
Value ($Bil)
$4.0
REITs & MLPs
$0.0 Conservation
($4.0) Industry
($8.0) Private
($12.0) TIMO
($16.0)
Ow ner Type
Source: R&A Investment Forestry
Figure 3. Change in U.S. Portfolio Value 2005 to 2009
4 The database from which these figures are drawn account only for actual sales from one ownership to another. It does
not account for conversions from forest products companies to REITS, which are considered restructurings.
U.S. Timberland Post-Recession — R&A Investment Forestry – www.investmentforestry.com 16For the period 2005 through 2009, annualized return as reflected by the NTI index was 10.9% in
nominal terms. Note, however, that 2009 showed a negative 4.8%.
Figure 4 depicts the net acres and value changing ownership type since investors began to own
timberland. Of this, the integrated forest products industry gave up 37.7 million acres valued at $33.1
billion, while TIMOs and REITs gained 26.9 million acres valued at $30.4 billion. This represents a
stunning transfer of assets and wealth, especially considering that much of it occurred in a single
decade. Further, unlike the explosion of technology during the same period, this transfer was based on
assets and an industry that could be characterized as having always been there.
x 1 Million x 1Billion
1983 to 1995 6.0 acs $5.0
1996 to 2000 7.9 acs $5.0
2001 to 2004 14.0 acs $11.0
2005 to 2009 15.5 acs $16.8
Total 43.4 acs $37.8
Source: R&A Investment Forestry
Figure 4. Acres and Value Transferred
Note that Phase I spanned 12 years, so the process began slowly. The high-volume year was 2006,
with 6.4 million acres and $7.3 billion changing ownership type.
So investors now have a big stake in this historically stable, but highly illiquid, asset class.
U.S. Timberland Post-Recession — R&A Investment Forestry – www.investmentforestry.com 17Part 2:
A review of attributes
For twenty-five years, investment managers have lauded timberland for an array of attractive
attributes – high risk adjusted return, portfolio diversification, ability to hedge inflation. Investors have
in turn accepted these claims. The asset class has indeed performed exceedingly well, with a return
since inception of 14.1% in nominal terms. Those who timed entry and exit correctly, and with a bit of
luck, faired even better. Timberland has matured as an investment during that time, however, and a
review of the strengths and weaknesses of these arguments, and consideration of how they may have
changed, will be useful.
Average Per Acre Value vs. Discount Rate
Timberland investment value increases for two reasons, (1) income increases, or (2) investors become
willing to pay more for the same income. Figure 5 implies the latter in the case of timberland,
depicting the behavior of weighted average price/acre vs. average implied discount rate for the South
and Pacific Northwest combined.5
Price vs Discount Rate
Average Price/Acre Average Discount Rate
$2,000 7.5%
$1,800 7.0%
$1,600 6.5%
Discount Rate
6.0%
Price/Ac
$1,400
5.5%
$1,200
5.0%
$1,000
4.5%
$800 4.0%
$600 3.5%
$400 3.0%
2001 2002 2003 2004 2005 2006 2007 2008 2009
Year
Source: NCREIF Timberland Index, Barak, Musselman, R&A Investment Forestry
Figure 5. Price vs. Discount Rate
5 A note of caution. Both parameters depicted are generalized estimates. Discount rate here is an average of discount
rates reported by forest consultants from the Pacific Northwest and the US South, the primary U.S. growing regions. The
rate depicted is Implied Discount Rate (IDR), i.e., the rate implied by expert opinion, knowing the sales price and property
characteristics. Price/acre is likewise indicative only, derived from the NTI. Some acres are more valuable than other acres
simply because they are worth more and not necessarily due to discount rate compression. In this case, focus is on trend.
U.S. Timberland Post-Recession — R&A Investment Forestry – www.investmentforestry.com 18Based on the NTI, when per/acre price peaked in 2008, it had risen more than 35% in three years. By
the end of 2009, 15 months after the fall of Lehman, price was still 27.9% higher than in 2005.
As per acre price of timberland increases, discount rate tends to compress consistently across the
time period. This has been a period of rapid expansion of the total institutional investment portfolio, a
high level of competition between buyers, and, in general, a period during which demand for
timberland exceeded supply - conditions ripe for overheating. Conjecture about “irrational exuberance”
has occurred throughout the history of timberland investment and thus far, no bubble has burst.
Certainly, given declining prices for sawtimber in all markets combined with the high level and steep
rise of capital appreciation upon which timberland returns have been based, investors should be
cautious that returns enjoyed by earlier investors not prove to be at the expense of new capital.
The NCREIF Timberland Index of Return
Performance Over Time
The NCREIF Timberland Index was established by timberland investment managers in 1992 in
cooperation with NCREIF to provide investors an independent measure of timberland returns.
Contributors are TIMOs who submit performance data based on revenue generated and on annually
appraised value of timber properties. The data series begins with 1987.
Figure 6 depicts the timberland index from 1987 forward, distinguishing between Income and Capital
Appreciation, both additive components of return. (NCREIF, 2009)
Incom e vs Capital Appreciation
1987 to 2009
40.00%
35.00%
30.00%
25.00%
% Return
20.00%
15.00%
10.00% Appreciation
5.00% Income
0.00%
-5.00%
-10.00%
1987 1990 1993 1996 1999 2002 2005 2008
Year
Source: NCREIF Timberland Index
Figure 6. Income vs Capital Appreciation
There are several items of note here. First, timberland has indeed performed well over the period.
Returns in most years have exceeded 10% and have exceeded 30% in some. Some individual stocks
U.S. Timberland Post-Recession — R&A Investment Forestry – www.investmentforestry.com 19have done that well or better, but timberland has been exemplary as an asset class, exceeding return
expectations in most years and certainly in total.
There are cautionary observations as well.
Return has diminished substantially over time. Thus, given the behavior of discount rate depicted in
Figure 5, both performance and expectation have declined.
While investors are theoretically indifferent to the source of return, all value derives ultimately from
monetization in some form. Annual income, primarily from timber sales, has been highly variable as a
proportion of total return, but, in general, it has been downward. Income is the most concrete
component of return, leaving some softness in the total. 6
Most return has derived from capital appreciation, which is based not on actual monetization, but on
appraisal. Appraisal is an expert’s opinion of value, but it is not value itself. Certainly there have been
noteworthy secondary transactions that give it credence, but there is judgment involved in
distinguishing between real value and over-value.
Cumulative Annual Return
Figure 7 is another view of NTI, depicting cumulative return since inception in 1987.
NCREIF TIMBERLAND INDEX
Cumulative Annual Return
1987 to 2009
35.0%
30.0%
25.0%
20.0% Entry 1986
Return %
Entry 1995
15.0%
Entry 2000
10.0% Entry 2005
Entry 2007
5.0%
0.0%
1986 1988 1990 1992 1994 1996 1998 2000 2002 2004 2006 2008
-5.0%
-10.0%
Year
Source: NCREIF Timberland Index, R&A Investment Forestry
Figure 7. Cumulative Annual Return
6 In absolute terms, income has been somewhat more stable.
U.S. Timberland Post-Recession — R&A Investment Forestry – www.investmentforestry.com 20An investor entering timberland in 1986 expecting a nominal return of 10.0% (8.0% real), by 1989
would have enjoyed a return of 31.3%, diminishing to 14.1% by 2009. Still, a very good performance
over the period, given a 10% expectation. Another investor, entering in 1995 expecting nominal
10.0%, would have seen 14.75% by 1997, diminishing to 8.5% by 2009. A third, entering in 2000
expecting 9.0% would have been under water until 2003, recovering to 7.6% by 2009 – saved by an
extraordinary three year run at 17.1%. Note that an investor entering at the end of 2007, enjoying
9.2% in 2008, by 2009 may have fallen into a decline from which it may take years to recover.
Timberland has moved to a new phase. The nature of the industry has changed as it has matured
and as it has separated from the forest products industry. Success will become increasingly
dependent on acquisition discipline.
Interpreting the NCREIF Timberland Index
The NTI is a well-constructed, useful index of performance for an asset class whose value is difficult to
measure and based on relatively few transactions. It is not a benchmark and it does have weaknesses
which its authors and contributors openly acknowledge. (Aronow, 2004).
Appraisal. Capital appreciation, the largest and most steeply rising component of return, is based on
periodic valuation of properties comprising the index. Timberland is largely an illiquid asset, so
valuation must be based on appraisal rather than actual transactions. Appraisals are based on expert
judgment and expertise is variable. Further, appraisal, dependent on historical comparable
transactions, lags current market. Where transaction volume is exceptionally low, as in the case of
economic downturn, appraisal must be based on fewer and less current data, causing “true” value to
be hidden. In particular, appraisals tend to be “sticky” on the high side.
Periodicity. NTI is a quarterly index but not all properties are appraised quarterly – or even annually.
Valuations without an appraisal are based on “desktop” analyses by the investment manager, not on
dispassionate outside review.
Composition. Properties cycle through the NTI as they are bought and sold, so successive analyses are
based on a changing property base.
Inventory. Inventory, itself a complex and costly activity, changes over time with growth and harvest.
Portfolio Efficiency
Since its inception, investment timberland, when combined with real estate and other financial assets,
has been shown to increase portfolio efficiency, as illustrated in Figure 8. The argument is made that
timber returns have low to negative correlation with other assets, and thus a portfolio that contains
timberland yields equal or better return with lower risk than a portfolio without it. (Hancock, 2003)
Figure 9 illustrates timberland’s correlation with an array of financial assets over various time periods.
Focusing on the long-term from 1960 to 2009, a claim to negative correlation would appear to be
valid. In the short to mid term, however, these correlations change randomly with time period. Note
U.S. Timberland Post-Recession — R&A Investment Forestry – www.investmentforestry.com 21You can also read


