Carbon Sequestration by Hedgerows in the Irish Landscape
←
→
Page content transcription
If your browser does not render page correctly, please read the page content below
Climate Change Research Programme (CCRP) 2007-2013
Report Series No. 32

                         Carbon Sequestration by
                         Hedgerows in the
                         Irish Landscape

                                      Comhshaol, Pobal agus Rialtas Áitiúil
                                      Environment, Community and Local Government
Environmental Protection Agency
The Environmental Protection Agency (EPA) is                REGULATING IRELAND’S GREENHOUSE GAS EMISSIONS
a statutory body responsible for protecting                 n Quantifying Ireland’s emissions of greenhouse gases
the environment in Ireland. We regulate and                   in the context of our Kyoto commitments
police activities that might otherwise cause                n Implementing the Emissions Trading Directive,
pollution. We ensure there is solid                           involving over 100 companies who are major
                                                              generators of carbon dioxide in Ireland.
information on environmental trends so that
necessary actions are taken. Our priorities are
protecting the Irish environment and                        ENVIRONMENTAL RESEARCH AND DEVELOPMENT
ensuring that development is sustainable.                   n Co-ordinating research on environmental issues
                                                              (including air and water quality, climate change,
The EPA is an independent public body                         biodiversity, environmental technologies).
established in July 1993 under the
Environmental Protection Agency Act, 1992.                  STRATEGIC ENVIRONMENTAL ASSESSMENT
Its sponsor in Government is the Department
                                                            n Assessing the impact of plans and programmes on
of the Environment, Community and Local                       the Irish environment (such as waste management
Government.                                                   and development plans).

                                                            ENVIRONMENTAL PLANNING, EDUCATION AND
OUR RESPONSIBILITIES                                        GUIDANCE
LICENSING                                                   n Providing guidance to the public and to industry on
                                                              various environmental topics (including licence
We license the following to ensure that their emissions
                                                              applications, waste prevention and environmental
do not endanger human health or harm the                      regulations).
environment:
                                                            n Generating greater environmental awareness
n waste facilities (e.g., landfills, incinerators, waste      (through environmental television programmes and
  transfer stations);                                         primary and secondary schools’ resource packs).
n large scale industrial activities (e.g., pharmaceutical
  manufacturing, cement manufacturing, power                PROACTIVE WASTE MANAGEMENT
  plants);
                                                            n Promoting waste prevention and minimisation
n intensive agriculture;
                                                              projects through the co-ordination of the National
n the contained use and controlled release of                 Waste Prevention Programme, including input into
  Genetically Modified Organisms (GMOs);                      the implementation of Producer Responsibility
n large petrol storage facilities;                            Initiatives.
n waste water discharges;                                   n Enforcing Regulations such as Waste Electrical and
n dumping at sea.                                             Electronic Equipment (WEEE) and Restriction of
                                                              Hazardous Substances (RoHS) and substances that
                                                              deplete the ozone layer.
NATIONAL ENVIRONMENTAL ENFORCEMENT
                                                            n Developing a National Hazardous Waste Management
n Conducting over 1200 audits and inspections of EPA          Plan to prevent and manage hazardous waste.
  licensed facilities every year.
n Overseeing local authorities’ environmental
                                                            MANAGEMENT AND STRUCTURE OF THE EPA
  protection responsibilities in the areas of - air,
  noise, waste, waste-water and water quality.              The organisation is managed by a full time Board,
n Working with local authorities and the Gardaí to          consisting of a Director General and four Directors.
  stamp out illegal waste activity by co-ordinating a
  national enforcement network, targeting offenders,        The work of the EPA is carried out across four offices:
  conducting investigations and overseeing                  n Office of Climate, Licensing and Resource Use
  remediation.
                                                            n Office of Environmental Enforcement
n Prosecuting those who flout environmental law and
                                                            n Office of Environmental Assessment
  damage the environment as a result of their actions.
                                                            n Office of Communications and Corporate Services
MONITORING, ANALYSING AND REPORTING ON THE
ENVIRONMENT                                                 The EPA is assisted by an Advisory Committee of twelve
                                                            members who meet several times a year to discuss
n Monitoring air quality and the quality of rivers,         issues of concern and offer advice to the Board.
  lakes, tidal waters and ground waters; measuring
  water levels and river flows.
n Independent reporting to inform decision making by
  national and local government.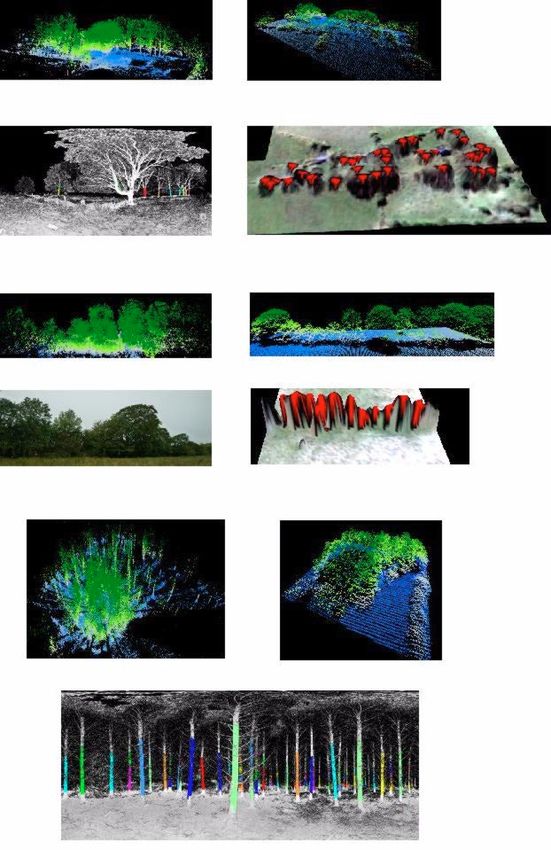
EPA Climate Change Research Programme 2007–2013

 Carbon Sequestration by Hedgerows in the
                     Irish Landscape

Towards a National Hedgerow Biomass Inventory for the
    LULUCF Sector Using LiDAR Remote Sensing

                       CCRP Report

           Prepared for the Environmental Protection Agency

                                 by

                              FERS Ltd

                              Authors:
  Kevin Black, Stuart Green, Garret Mullooley and Alejandro Poveda

           ENVIRONMENTAL PROTECTION AGENCY
            An Ghníomhaireacht um Chaomhnú Comhshaoil
          PO Box 3000, Johnstown Castle, Co. Wexford, Ireland

           Telephone: +353 53 916 0600 Fax: +353 53 916 0699
                Email: info@epa.ie Website: www.epa.ie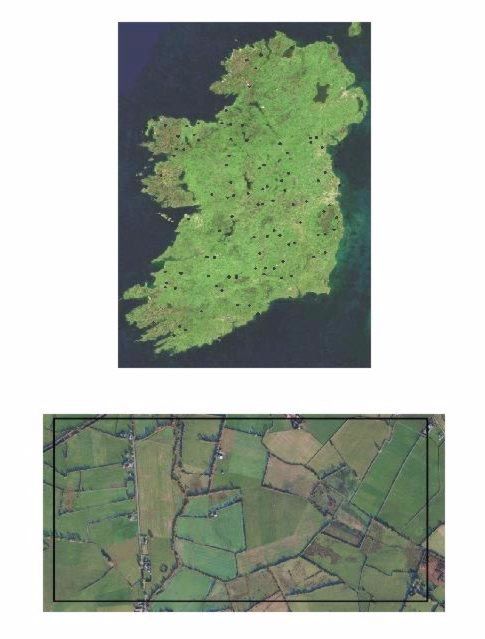
© Environmental Protection Agency 2014

                                 ACKNOWLEDGEMENTS

This report is published as part of the Climate Change Research Programme 2007–2013. The
programme is financed by the Irish Government under the National Development Plan 2007–2013. It
is administered on behalf of the Department of the Environment, Community and Local Government
by the Environmental Protection Agency which has the statutory function of co-ordinating and
promoting environmental research.

                                        DISCLAIMER

Although every effort has been made to ensure the accuracy of the material contained in this
publication, complete accuracy cannot be guaranteed. Neither the Environmental Protection Agency
nor the author(s) accept any responsibility whatsoever for loss or damage occasioned or claimed to
have been occasioned, in part or in full, as a consequence of any person acting, or refraining from
acting, as a result of a matter contained in this publication. All or part of this publication may be
reproduced without further permission, provided the source is acknowledged.

The EPA Climate Change Research Programme addresses the need for research in Ireland to inform
policymakers and other stakeholders on a range of questions in relation to environmental protection.
These reports are intended as contributions to the necessary debate on the protection of the
environment.

             EPA CLIMATE CHANGE RESEARCH PROGRAMME 2007–2013
                    Published by the Environmental Protection Agency, Ireland

ISBN: 978-1-84095-529-3
Price: Free                                                                         Online version

                                                 ii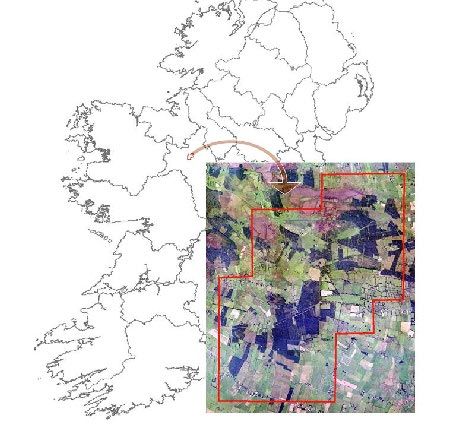
Details of Project Partners

Kevin Black                               Stuart Green
FERS Ltd                                  Spatial Analysis
Forestry Division                         REDP
117 East Courtyard                        Teagasc Research Centre
Tullyvale                                 Ashtown
Cabinteely                                Dublin 15
Dublin 18                                 Tel.: +353 1 8059500
Tel.: +353 1 2722675                      Email: Stuart.Green@teagasc.ie
Email: kevin.g.black@gmail.com

Garret Mullooly                           Alejandro Poveda
TreeMetrics                               TreeMetrics
The Rubicon Centre                        The Rubicon Centre
CIT Campus                                CIT Campus
Bishopstown                               Bishopstown
Cork                                      Cork
Tel.: +353 21 4928948                     Tel.: +353 21 4928948
Email: gmullooly@treemetrics.com          Email: jpoveda@treemetrics.com

                                         iii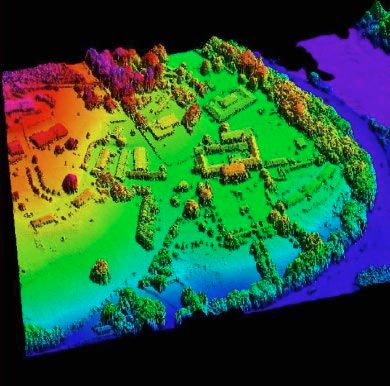
Table of Contents

Acknowledgements                                                                     ii

Disclaimer                                                                           ii

Details of Project Partners                                                         iii

Executive Summary                                                                   vii

1     Introduction                                                                   1
      1.1    Background                                                              1
      1.2    Literature Review                                                       1
      1.3    Aims/Objectives                                                         8

2     Materials and Methods                                                          9
      2.1    Study Site                                                              9
      2.2    Description of the LiDAR Technique                                      9
      2.3    Definition of Hedgerows and Non-Forest Woodlands                       11
      2.4    Identification of Hedgerow Areas                                       11
      2.5    Deriving a Canopy DEM for Hedgerows                                    14
      2.6    Sampling the Canopy DEM for Treemetric Data                            14
      2.7    Derivation of Biomass from Tree Height                                 15
      2.8    Direct Derivation of Biomass from Laser Return Statistics              16
      2.9    Estimating Hedgerow Sequestration Potential                            17
      2.10 Deriving Non-Forest Woodland Patch Biomass and Sequestration Potential   17
      2.11 TLS Scanning of Sampled Hedgerows                                        17
      2.12 Scoping of a National System                                             19

3     Results                                                                       21
      3.1    Characterising Hedgerows                                               21
      3.2    Biomass of Hedgerows Based on Tree Height                              21
      3.3    Biomass Estimation Based Directly on Laser-Metric Parameters           21
      3.4    Estimation of Above-Ground Sequestration Potential                     24
      3.5    Biomass and Sequestration Potential of Non-Forest Woodlands            25
      3.6    TLS                                                                    26
      3.7    National Inventory Development                                         28
      3.8    Consultation with Stakeholders                                         32

                                                  v
4     Discussion and Conclusions                                  34
      4.1    LiDAR and TLS Applications for Hedgerow Monitoring   34
      4.2    Cost–Benefit Analysis                                35
      4.3    Future of LiDAR                                      37
5     Observations and Recommendations                            39
6     Project Outputs                                             41
References                                                        42
Acronyms                                                          45

                                              vi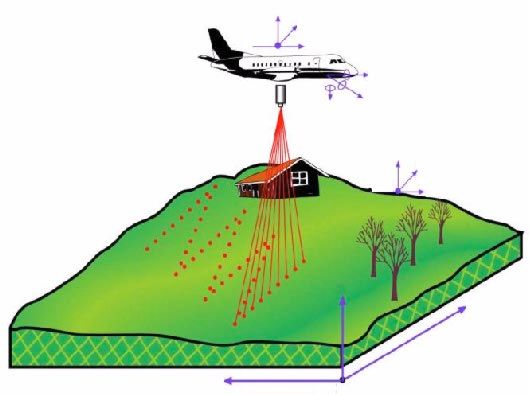
Executive Summary

The removal of carbon dioxide (CO2) from the                        shared by governmental bodies interested in the use of
atmosphere due to land-use management and forestry                  LiDAR for other applications.
could potentially be used as a mitigation option under
                                                                    Preliminary estimates suggest that hedgerow and non-
Article 3.4 of the Kyoto Protocol. In particular, the
                                                                    forest woodlands could potentially sequester 0.66–3.3
increase in the area of hedgerows and expansion of
                                                                    t CO2/ha/year. These estimates exclude potential
non-forest   woodland       patches   across    the   Irish
                                                                    emissions associated with hedgerow management or
landscape, together with the sink activity of existing
                                                                    disturbance. However, the reported estimates are
hedgerows, could be significant with respect to
                                                                    within the range reported by other hedgerow studies. If
accountable removal units (RMUs) under the Protocol.
                                                                    these   estimates   are     representative   of   national
There is, however, no national inventory system to
                                                                    hedgerows and non-forest woodlands, this could
facilitate the reporting of hedgerow sink activities to the
                                                                    potentially result in a net removal of 0.27–1.4 Mt
United Nations Framework Convention on Climate
                                                                    CO2/year, which would increase the total land use,
Change (UNFCCC). This desk study was initiated to
                                                                    land-use change and forestry (LULUCF) sink estimate
demonstrate the use of Light Detection And Ranging
                                                                    by ~8–28%. However, under the current accounting
(LiDAR) remote sensing technology and terrestrial
                                                                    framework for Article 3.4, claimed emission reductions
laser   scanning    (TLS)    for   assessing    hedgerow
                                                                    are calculated using a net–net approach. This is done
biomass, with the aim of developing a cost-effective
                                                                    by comparison of the net removal in a given year with
and efficient national hedgerow carbon inventory.
                                                                    the net removal or emission in a reference year. For
A pilot study was conducted using existing LiDAR data               the cost–benefit analysis, the year 2000 was selected
from Frenchpark, Co. Roscommon, to develop a                        as the base year using available statistics on increases
hedgerow classification and sampling system to                      in hedgerow area to derive a net–net removal estimate
assess biomass and carbon (C) sequestration by                      of 3,000–17,000 t CO2/year. Based on the estimated
adopting a range of geo-processing techniques and                   cost of a hedgerow inventory and the expected
empirical models. Direct modelling of LiDAR metrics,                accountable removals, it is estimated that a national
such as intensity and percentiles of 1st and 2nd laser              inventory would be cost neutral at a CO2 market price
returns, was used to accurately        (RMSE1    ± 7.3–19           of €6 per t CO2. Under the current market conditions
t C/ha) estimate hedgerow and non-forest woodland                   and the Kyoto accounting mechanism, a national
biomass. Optimisation of LiDAR sampling techniques                  hedgerow inventory would offer no cost benefit.
suggests that the minimum laser return sample density               However, it is plausible that the market demand for
for detecting hedgerow biomass could be reduced to                  CO2 and the value of Kyoto RMUs would increase
five returns per square metre without influencing the               when new emission reduction and burden-sharing
performance of model estimates.                                     targets come into effect post-2020.

Following optimisation of sampling and processing                   In conclusion, a national, LiDAR-based, inventory of
requirements, guidelines and costs for developing a                 hedgerows is feasible and cost-effective (pending
national LiDAR-based inventory were established. It is              future internationally agreed accounting modalities). It
estimated that the total annual cost of a national                  is   recommended     that    additional   research    and
hedgerow inventory could be between €80,000 and                     inventory capacity are required to include hedgerows
€100,000, over a 6-year reporting cycle, but the                    into a fully compliant LULUCF inventory. For example,
financial impact could be substantially reduced if the              extensive validation and ground-truthing of LiDAR and
acquisition and processing costs for LiDAR data are                 TLS biomass estimates are required to ensure that
                                                                    estimates are robust and defensible in the international
1. RMSE, root mean square error.                                    review process. In addition, national institutions and

                                                              vii
departments should develop cohesive LiDAR survey,               (INSPIRE) Directive, so that the costs of acquiring and
dissemination, and inventory policies, compatible with          processing LiDAR data for multiple users can be
the Infrastructure for Spatial Information in Europe            reduced.

                                                         viii
1 Introduction
1.1 Background cropland and grassland management for the first
commitment period due to uncertainty in the
Hedgerows and woodland habitats are an important magnitude of emissions or sinks in this land-use
feature of the Irish landscape due in part to their roles activity and a lack of methodology to report these
in biodiversity, agricultural management and potential activities on a national basis. Under the accounting
carbon sequestration. Greenhouse gas (GHG) and reporting rule under Articles 7 and 8 of the Kyoto
emission reductions in the land use, land-use change Protocol, a party may elect for a land-use management
and forestry (LULUCF) sector are largely associated activity if it is shown to be directly anthropogenic.
with forestry sinks. However, it is suggested that there Clearly, the expansion of non-forest woody biomass
could be a potential GHG mitigation potential (sink areas, such as hedgerows, in the crop and grazing
potential) in grazing land or cropland1 following the land categories meets these criteria. There has been
introduction of the Rural Environment Protection anecdotal evidence that elements of the Irish
Scheme (REPS), which promoted the planting of agricultural landscape, such as hedgerows and small
indigenous trees and development of hedgerows. woodland patches, may represent a significant carbon
Similarly, there is evidence of encroachment of hazel (C) sink due to an increase in non-forest woody
scrub in grazing land in the Burren landscape due to a biomass as a direct result of the REPS. However,
reduction in livestock numbers. There is also evidence Ireland needs to demonstrate, via transparent
of alder and birch expansion on abandoned/reclaimed inventory processes, that this ’agricultural greening’
cutaway peatlands (Black et al., 2009b). Collectively associated with Article 3.4 activities is occurring before
these activities constitute an additional non-forest any potential carbon sink credit can be claimed in a
woody biomass sink in the Irish landscape. compliant manner.
Under the European Union (EU) burden-sharing Light Detection And Ranging (LiDAR) remote sensing
agreement, Ireland will be committed to reduce its technology and ground-truthing techniques could offer
GHG emissions by 20% below the 2005 value an ideal opportunity to utilise existing land-use policies
(DEHLG, 2010). Policies and measures to enhance and incentives (REPS or the proposed agri-
GHG sinks are projected to result in a reduction of ~8% environment scheme) to realise the potential return of
below the 2005 level. Additional measures or investment without any added cost except for the
accountable sinks are required for the 20% target to be implementation and testing of a compliant monitoring,
met for the non-emission trading sectors. Emissions reporting and verification (MRV) programme at a
and removals (Kyoto removal units (RMUs)) relatively low input cost.
associated within the LULUCF sector can be used as
a mitigation option under the Kyoto Protocol 1.2 Literature Review
mechanism. Article 3.4 of the Protocol allows for the
Hedgerows are estimated to cover 3.9% of the Irish
accounting of emission removals (sinks) associated
landscape, representing ~272 kha (Forest Service
with management of croplands, grazing land and
Ireland, 2007a). The REPS facilitated the planting of
forests. Selection of these activities for the first
some 10,000 km of new hedgerow and rejuvenation of
commitment period of the protocol is voluntary, but
some 3,000 more (Fitzgerald, Teagasc)2. The increase
likely to become mandatory. Ireland did not elect
in the area of hedgerow and expansion of non-forest
1. Cropland, grazing land and wetland management can be woodland patches across the landscape together with
elected for under Article 3.4 of the Kyoto Protocol. However,
Ireland has not elected for these activities due to a lack of 2. http://www.teagasc.ie/areaunits/kerrylimerick/LimerickNewslet
national data and large uncertainties in the magnitude of the ters/Irish%20Hedgerows%2003-11-09%20(%20Padraig%
emission or reduction related to them. 20Fitzgerald).pdf
1Carbon sequestration by hedgerows in the Irish landscape
the sink activity of existing hedgerows could be tracking of total area changes in hedgerows and small
significant. However, loss of hedgerow habitat and woodland patches. An alternative approach adopted
degradation of hedgerows should also be considered by the National Forest Inventory (NFI) used a
in this context. Recent studies in the UK suggest that systematic grid sample approach to track land use and
hedgerow biomass could sequester 0.4–1.25 t land-use change, including hedgerows. This inventory
CO2/ha/year, depending on hedgerow type and system can be rolled out to include all LULUCF
vegetation density (Falloon et al., 2004). Assuming an activities. In tandem with these geographic information
average sequestration rate of 0.7 t CO2/ha/year, systems (GIS) and inventory advances, terrestrial
hedgerow trees in the Irish landscape could represent laser scanning (TLS) and airborne-based laser
a sink of 200,000 t CO2/year. This estimate excludes sensing (LiDAR) methods can now be applied to
woodland patches that are not classified as forest or hedgerows as the basis for a national inventory of
hedgerow. However, reporting and accounting for woody biomass stock changes in the land cover
these non-forest woodland and hedgerow activities categories (Jones et al., 2007; Stephens et al., 2007;
under the LULUCF sector have not been possible in Pascaul et al., 2008). LiDAR has been used
the past due to: successfully to characterise and estimate woody
biomass and timber volumes in forestry systems.
• A lack of historic data (baseline data), which are These include approaches such as cluster analysis
used as a reference period for calculating GHG (Farrelly et al., 2008) to aid in forest resource
changes over time3; inventories. The k-Nearest Neighbour (k-NN)
technique has been used in a pilot study in Co. Clare
• No national spatial or geographic information to obtain forest attributes, such as volume, stocking,
systems to detect changes in the area of diameter, height, and basal area in Ireland (McInerney
hedgerows and non-forest woody biomass over et al., 2005). A more direct approach involves the use
time; and of multi-component regression analysis, where plots
have been measured by both LiDAR and field
• No inventory information on biomass stock
measurements. LiDAR parameters (for example height
changes in these land-cover types.
observations at different percentile returns) are then
used to establish a multiple linear regression for total
The only currently available methods for assessing
carbon per plot. Where plots have not been measured
hedgerow biomass and carbon stock change involve
by field teams the regression estimator is used to
detailed surveys, which record biometric attributes,
estimate total carbon per plot, and for the biomass
from which biomass can be determined, or by
carbon pools, using double or two-phase sampling
destructive sampling of hedgerows (Falloon et al.,
procedures (Parker et al., 2004).
2004; Henry et al., 2009). However, these methods
have not been suitable for scaling up of national Since LiDAR is an aerial-based approach, hedgerow
estimates due to time and cost constraints. Recent or forest structure below the canopy is not easily
remote sensing technological advances now offer the resolved due to limited laser penetration into, and
possibility of developing a national reporting system for return signals from, sub-canopy layers. Various data
the estimation of woody biomass in hedgerows and processing functions are required to obtain information
non-forest woodlands4. Completion of the Teagasc on number of trees or attributes, such as top height or
National Hedge Map (THM05) will facilitate the tree diameter, so that tree biomass, productivity class
or volume can be determined using biomass allometric
3. For most signatory countries, under the Kyoto Protocol, the
reference year is 1990. However, countries may choose to functions (Farrelly et al., 2008; Pascaul et al., 2008).
negotiate a different reference period, particularly in the Processing functions include manipulation of raw data
post-2012 scenario.
4. Non-forest land is defined as land covered by trees which is format files to produce a canopy laser cloud, which
not classified as forests under the national definition of excludes the ground layer, using a digital elevation
forests – areas greater that 0.1 ha, greater than 20 m in
width with the potential to reach 5 m in height and a canopy model (DEM). There are numerous automated
closure of 20% in situ. products available to transform raw point cloud ‘LAS’
2K. Black et al. (2010-CCRP-DS-1.1)
files into canopy digital terrain models (DTM) using relationship to above-ground woody biomass at a
Fusion software (v. 3.01 US Forest Service) or detection limit of 15 Mg C/ha and up to a saturation of
Lastools (http://lastools.com) in a GIS platform. around 50 Mg C/ha (Ryan et al., 2012). The relatively
Structural elements in the canopy DTM that do not low saturation limit is, however, far below the expected
relate to hedgerows (e.g. forests or buildings) need to range of above-ground woody biomass (0–250 Mg
be masked out from the raw data cloud using GIS C/ha) expected in Irish and UK hedgerows and forests
manipulation by overlaying forest and urban spatial (Falloon et al., 2004; Forest Service Ireland, 2007a;
data sets. Other methods involve identification of Black et al., 2009a). LiDAR technologies are able to
individual tree crowns using the watershed detect biomass within the ranges expected for forest or
segmentation procedure (Edson and Wing, 2011). hedgerows (Stephens et al., 2007), but there have
Finally, regression models are required to estimate been no studies on the application of the technology for
biomass from LiDAR-derived measurements hedgerow biomass assessments.
(Stephens et al., 2007).
Clearly, these new approaches are not an ‘off-the-
TLS is a ground-based technique used to provide shelf’ technology. Considerable testing and validation
three-dimensional (3D) digital terrain images of are required before the use of these technologies can
buildings or landscape features. This offers the provide a more cost-effective solution that can
potential of providing detailed laser-metric information augment traditional sample-plot-based
at the sampling plot level, typically 0.1–0.01 ha in size. measurements. In addition, the feasibility of
In forestry, TLS has been used for timber forecasting implementing a LiDAR-based inventory within the
based on 3D and profile models of tree stems (Thies national GHG inventory system (Duffy et al., 2011)
and Spiecker, 2004). The advantage of TLS over requires consideration of the currently used land-use
LiDAR is that more detailed information on hedgerow classification systems and compliance in reporting
structure below the canopy can be obtained since this GHG emissions or reductions as set out in the
is a ground-based technology. The disadvantage is Intergovernmental Panel on Climate Change (IPCC)
that multiple plots would need to be scanned to good practice guidelines. More importantly, the costs
produce an accurate depiction of hedgerow wood associated with development of a national system for
biomass status at a national level. TLS would, estimating hedgerow GHG balance should ideally be
however, be useful for ground-truthing LiDAR justified by the potential benefits of reporting additional
assessments or in developing ground-based biomass mitigation measures through hedgerow management.
regression models based on destructive sampling of This requires careful inventory design, measurement
hedgerows. optimisation and cost–benefit analysis before a
national system can be implemented.
Numerous studies have demonstrated the use of other
remote sensing techniques and products for 1.2.1 A review of hedgerow surveys and data
characterising hedgerow boundaries and providing In this section, existing hedgerow surveys, maps and
assessments of hedgerow cover at various regional inventories in Ireland, the UK and Europe are
scales. These include the use of aerial photography reviewed, with the goal of establishing parameters for
based on hybrid pixel/object-based analysis the creation of a valid hedgerow inventory and change
approaches (Sheeren, 2009). Vannier and Hubert-Moy monitoring programme for Ireland.
(2010) demonstrate the use of high-resolution remote
sensing images to detect and accurately identify 1.2.1.1 Existing surveys in Ireland
hedgerow boundaries in the landscape. The estimation County hedgerow surveys
of biomass stock changes requires assessments at A number of Irish county councils, with the support of
much higher resolutions, which should be repeatable The Heritage Council, have carried out botanical and
over various timescales. Other satellite-based structural surveys of their hedgerow stock. The
sensors, such as L-band microwave backscatter, have motivations behind the council surveys are varied but
been shown to have a reasonably strong direct principally concern:
3Carbon sequestration by hedgerows in the Irish landscape
• Biodiversity issues; species-rich hedgerows (often in parks and
demesnes). This report also contains information on
• Hedgerows as landscape features; and
basal density in the form of scoring from minimum
• Accounting for hedgerow stock. vegetation to maximum and used a twinspan analysis
of these data to cluster the hedgerows into four groups
The councils generally impose habitat survey based on species and structure.
techniques based on The Heritage Council guidelines
(Smith et al., 2010). An example is the Laois County There is currently no commitment to repeat the above-
Hedgerow Survey Report (Foulkes and Murray, mentioned surveys; however, since the location of the
2005a). This report, like most other county reports, hedgerows surveyed within each 1-km square grid is
presents the results of a 1-km tetrad survey covering recorded, it would be possible to use these surveys as
approximately 1% of the county area (only a subset of the basis of a system to monitor actual change in the
hedges within each square kilometre is recorded – up hedgerow stock. Although composition and species
to ten 30-m sections). The bulk of the survey examines cannot be measured by LiDAR, the structural
the species composition of the hedges; however, some information (hedge dimensions, height, etc.) can.
structural information is recorded – the basal area
NFI of Ireland
category, height, number of trees in the hedgerow,
The NFI is a stratified randomised plot sample. A 2-
‘gappiness’ and management profile, as shown in
km2 grid is established over the country and a random
Fig. 1.1.
point within 100 m of the vertex is selected and land
Co. Roscommon has also been surveyed (Foulkes and use recorded. If the land use is forestry, a permanent
Murray 2005b), but unfortunately only one of the 1-km 500-m2 plot is established for field visits (Forest
squares fell within our LiDAR acquisitions zones used Service Ireland, 2007b).
in this desk study (see sections below); this was the
Whilst hedgerow is a recorded land use, the
Square R08 (Ballinameen) where the survey records
characteristics of the hedge are not recorded. As a
no hedgerows (the 1-km square is bog and forest).
potential source of ground-truthing for a national
A survey of Dublin hedgerows in 2005 (Lyons and hedgerow map, the NFI has merits; however, as a
Tubridy, 2006) concentrated on the habitat value of method for estimating national cover of hedgerows, it
40%
35%
30%
% of hedges surveyed
25%
20%
15%
10%
5%
0%
Remnant Derelict Losing Overgrown Boxed/A Top Heavy Straight
Structure Shaped Sided
Hedge Profile
Figure 1.1. Histogram showing distribution of hedgerows in Co. Laois as a function of management type –
taken from Laois County Hedgerow Report (Foulkes and Murray, 2005a).
4K. Black et al. (2010-CCRP-DS-1.1)
is inappropriate (a point sample will always image processing, which involves taking a digital
overestimate large objects and underestimate small). photograph and programming the computer to
This random grid sample approach was adopted automatically detect hedges in the image (‘hedges’
because there was no a priori knowledge of the and not ‘hedgerows’, as traditionally hedgerow refers
distribution of the extent of the national forest. to the whole structure of the field boundary, not just the
However, this is not the case for hedgerows, since a vegetation but the bank and ditch associated with it –
current hedgerow map does exist (THM05, see below). in this project just the area extent of the vegetation as
Therefore, the sampling approach used in the NFI seen from above is mapped).
would not be as efficient as other approaches, such as
cluster sampling or stratified random sampling. The THM project developed image processing
techniques that exploited the hedgerow colour as
Department of Agriculture, Food and the Marine
recorded on the national ortho-photography series for
planting records
2005 and also the texture and shadows associated
Locations of new hedgerows planted under the REPS
with hedges to classify the photographs. The project
(Department of Agriculture and Food (2000) and
had to develop bulk processing techniques to process
Agricultural and Environmental Structures (AES), the
the 20,000 photographs that make up the national
follow-on scheme) are recorded under the e_REPS
colour ortho-photography database for 2005. It built on
mapping service. More than 10,000 km of hedges have
extensive and growing literature on mapping the extent
been planted under this scheme.
of hedgerows automatically from optical imagery
In 2011, hedgerows were designated as landscape (Thornton and Atkinson, 2006; Tansey and Chambers,
features and are now protected under the 2009; Aksoy et al., 2010; Vannier and Hubert-Moy,
requirements of Good Agricultural and Environmental 2010) and in detection of non-forest woody biomass
Conditions (GAEC). The Department of Agriculture, and trees outside the forest. The results are a thematic
Food and the Marine5 (DAFM, 2011) rules state: map, with 1 m pixel size, showing all mature
hedgerows, individual trees and non-forest
“This means that in general they cannot be removed. woodland/scrub, with an estimated 80% accuracy. The
Hedgerows must also be maintained and not allowed map cannot be displayed at a visible scale in this
to become invasive thereby reducing the utilisable document. Table 1.1 gives the estimated area under
area of the field and consequently impacting on the hedge/woodland in each county.
area eligible for the single payment. Where, in
exceptional circumstances, a hedgerow must be 1.2.1.2 The UK experience
removed as for example to facilitate farmyard
The Hedgerow Survey Handbook published by the UK
expansion, a replacement hedge of similar length must
Department for Environment, Food & Rural Affairs
be planted at a suitable location on the holding in
(DEFRA) (2007) outlines in detail methods for
advance of the removal of the existing hedgerow.”
surveying hedgerows both by professional and
Therefore, in principle, if the rules can be voluntary groups. It defines hedgerows, explains their
demonstrated to be successfully applied, future principal features and goes through the practicalities of
changes in hedgerows can be easily monitored (or, at carrying out a survey. The handbook has little to
the very least, DAFM records will provide a set of mention on sampling strategy, except that census
validation statistics). surveys should only be carried out at a local level, with
random surveying typically involving the selection of 1-
Teagasc Hedge Map (THM05) km grid cells and the measurement of nine random
The THM is a remote-sensing-derived map of hedgerows within the cell.
hedgerow and woody scrub – essentially all non-forest
woody biomass (Green, 2010). The project relied upon
The handbook does have an extensive section
5. Previously the Department of Agriculture, Fisheries and describing and measuring the physical characteristics
Food (DAFF). of hedges (width, shape and gappiness) with good
5Carbon sequestration by hedgerows in the Irish landscape
Table 1.1. Area extent of hedgerow, woodland and scrub (HWS) for each county.
County Area of HWS % of national HWS stock % of county under HWS
(ha)
Carlow 8,000 1.8 8.9
Cavan 20,000 4.4 10.4
Clare 22,000 4.9 7.0
Cork 57,000 12.7 7.6
Donegal 20,000 4.4 4.1
Dublin 5,000 1.1 5.4
Galway 30,000 6.7 4.9
Kerry 23,000 5.1 4.8
Kildare 14,000 3.1 8.3
Kilkenny 19,000 4.2 9.2
Laois 12,000 2.7 7.0
Leitrim 11,000 2.4 6.9
Limerick 25,000 5.6 9.3
Longford 8,000 1.8 7.3
Louth 8,000 1.8 9.8
Mayo 23,000 5.1 4.1
Meath 24,000 5.3 10.2
Monaghan 16,000 3.6 12.4
Offaly 13,000 2.9 6.5
Roscommon 19,000 4.2 7.5
Sligo 11,000 2.4 6.0
Tipperary 35,000 7.8 8.1
Waterford 12,000 2.7 6.5
Westmeath 17,000 3.8 9.2
Wexford 20,000 4.4 8.5
Wicklow 10,000 2.2 4.9
illustrations and a key to identifying structures as use classes) of 1-km survey squares. They found that
hedgerows (Fig. 1.2). the approximate 0.6% land area coverage of the
stratified sample could give a national estimate and
A report from the Institute of Terrestrial Ecology that the use of a regular sampling scheme limited the
(Sparks et al., 1999) investigated issues relating to the use of geospatial techniques and explicitly that of
use of the UK countryside surveys (CSs) to get reliable spatial covariance (the amount of hedgerows in a cell
estimates on hedgerow stock (expressed in length) is closely related to the amount of hedgerows in
from the UK CS stratified sample (stratified on 32 land- adjacent cells). With a priori knowledge of hedgerow
6K. Black et al. (2010-CCRP-DS-1.1)
Figure 1.2. Identification key for hedgerows (extracted with permission from the UK Hedgerow Survey
Handbook (DEFRA, 2007)).
distribution, one can devise a more focused survey and the Czech Republic (Skalos and Engstová, 2009)
and still maintain statistical validity. with degrees of success and stretching back as far as
the availability of (often military) aerial photography
The National Inventory of Woodland and Trees (NIWT) would allow.
for England (Smith, 2001) used a very similar sampling
strategy to survey trees and clumps of trees between LUCAS
0.2 and 2 ha in size:
The Land Use/Cover Area Frame Statistical Survey
“A random sample of approximately 1% of land area (LUCAS) is a European survey of land use based on
was taken, with the basic sampling units being 1 km field-point and transect observations. It is similar to the
squares from the Ordnance Survey grid.” NFI 2-km grid survey, but with every point being visited
in the field where practicable and data recorded,
Mapping was done using aerial photography, with including photographs at a 250-m transect through the
some field verification (interestingly this 0.2- to 2-ha point. This methodology was developed in 2006
size unit was equivalent to 10% of the total forest area). (Jacques and Gallego, 2006) but was not applied in
Hedgerows were not included. Ireland until 2009.
1.2.1.3 International approaches The transect approach makes the LUCAS data set
Change detection of length and area of hedgerow has very useful for estimating hedgerow distribution as
been carried out on a survey basis in a number of linear boundaries are recorded as they are intersected.
European countries, most often based around In this case, hedges are classed as conifer hedges,
interpretation of aerial photography. Methods have managed and unmanaged (hedges defined as being
been developed in Spain (Sanchez-Albert et al., 2009) less than 3 m in width).
7Carbon sequestration by hedgerows in the Irish landscape
An analysis of the published data sets shows that of • Review of literature, IPCC good practice
the 4,164 transects in the Irish data set, 2,482 guidance and national systems;
contained hedges (60% of points, Table 1.2). The
• Processing of LiDAR data based on a pilot study
higher number (60%) of transects with hedges in
in Co. Roscommon;
Ireland, compared with the figure for the UK (34%), is
probably due to larger fields with more stone walls and • Deriving hedgerow biomass and treemetric data
large unenclosed areas in Scotland. from laser data;
Table 1.2. Hedgerow occurrence in the 2006 • Optimisation of the LiDAR sampling technique to
LUCAS survey of Ireland. minimise sampling cost in a national survey;
Hedge type Number of transects where
hedge type is present
• Modelling hedgerow and tree biomass based on
LiDAR data;
Conifer 32
Managed 1,434 • Demonstration of the potential application of
terrestrial scanning technologies as a ground-
Unmanaged 1,405
based surrogate for LiDAR;
Any type 2,482
LUCAS, Land Use/Cover Area Frame Statistical Survey. • Comparison of LiDAR data with satellite or
Ordnance Survey Ireland (OSi)-derived GIS
databases, such as the hedgerow map or the
1.3 Aims/Objectives NFI;
The primary objective of this desk study was to • Design of a suitable sampling strategy for a
evaluate the use of LiDAR technology for assessing national LiDAR survey using the national
biomass change in hedgerow and woodland features. hedgerow map and NFI permanent sample data;
Once the application of the technology had been
• Cost analysis for the implementation of a
clearly demonstrated using an existing high-density
LULUCF survey using LiDAR and ground-
LiDAR survey of Co. Roscommon, guidelines for an
truthing techniques, including a cost–benefit
ongoing national LiDAR inventory were delivered.
analysis; and
The specific aims of the desk study included: • Identification of future research needs.
8K. Black et al. (2010-CCRP-DS-1.1)
2 Materials and Methods
2.1 Study Site disadvantage of selecting one study area is that the
area may not represent all hedgerow types occurring in
The study site was located in a 265-ha area in
the country. Finally, it should be noted that stock
Frenchpark, Co. Roscommon, where Teagasc had
changes and estimation of sequestration potential are
previously commissioned a high density LiDAR flight
based on repeat measurements conducted over a
over the area. The study area comprised a mixture of
period of 3–10 years. The lack of a repeat LiDAR
all representative land uses reported under the
survey in that same area means that other methods
LULUCF sector in the National Inventory Report (NIR)
had to be employed to estimate sequestration potential
(Duffy et al., 2011), including grasslands, peatlands
(see methods below). However, the project scope was
and forests. The area also contained a significant
to demonstrate the application of the technology and
number of hedgerows and non-forest tree cover (see
not to provide a nationally robust estimate of hedgerow
Fig. 2.1).
carbon stocks.
The study area was selected because of the
availability of the LiDAR data to the project. Although 2.2 Description of the LiDAR Technique
the availability of pre-existing LiDAR data reduced
project costs, this presented some technical LiDAR is an active remote sensing system that allows
difficulties. Firstly, there was no ground sampling of for capture and analysis of surfaces in 3D format. The
hedgerows at the time that the LiDAR data were laser device is usually mounted on an aircraft, which
captured in 2009 and it was not possible to capture flies numerous paths over a study area. Global
survey data when the desk study was initiated in 2011. positioning system (GPS) technology is also used to
This meant that biomass models could not be accurately cross-reference the ground measurements
developed based on ground-truthed data. The other using laser beams (Fig. 2.2).
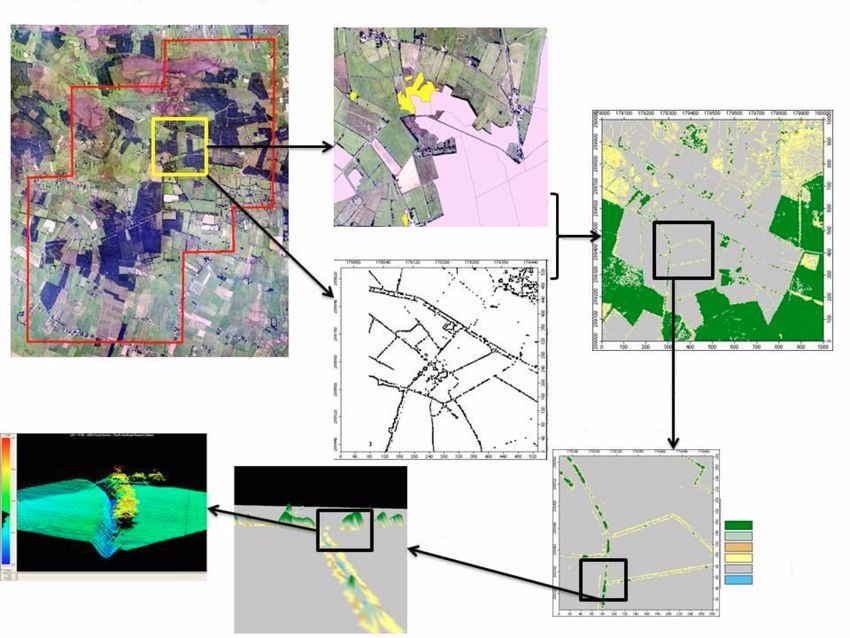
Figure 2.1. The selected pilot study area in Frenchpark, Co. Roscommon, showing the project boundary (in
red) which corresponds to the flight path areas from which Light Detection And Ranging (LiDAR) data were
derived in 2009.
9Carbon sequestration by hedgerows in the Irish landscape
Z
Y
GPS
X
X
LASER INS
SCANNER Z Y
Z
Y
GPS X
Z
X
Y
OBI
Figure 2.2. Aerial Light Detection And Ranging (LiDAR) scanning with differential global positioning
system (GPS) positioning used to derive digital terrain models (taken with permission from Renslow et al.
(2000)).
The rapid pulsing laser scanner emits laser pulses and LiDAR data were recorded by OSi from 19 to 31 April
measures the time for each beam to travel to and from 2009 using a Leica ALS50 II system mounted on a two-
a target, together with a record of the location of every seater Piper fixed-wing aircraft (Clifford et al., 2010).
return beam reflected from the target surface. The The four-return system is capable of a pulse rate of
reflectance and scattering of the returning laser pulse 150,000 kHz. The area was flown at a height of 1,700
are used to derive information on the location of the m. A scan angle of less than 12° off nadir was
target, intensity of the returned signal, and distance to specified, with an average of seven returns/m2. Data
source, yielding x, y and z co-ordinates for each pulse were received from OSi in LAS format containing the x,
returned. This information is then used to generate y, z co-ordinates of each pulse, return number,
DTMs (Fig. 2.3) from which forest or hedgerow intensity and scan angle, together with a DTM. Survey
information can be derived (see methods below). parameters are shown in Table 2.1.
Figure 2.3. An example of a digital terrain model (DTM) showing landscape features such as buildings,
forests and hedgerows.
10K. Black et al. (2010-CCRP-DS-1.1)
Table 2.1. Light Detection And Ranging (LiDAR) also linear features, such as riparian woodlands, a
survey parameters. maximum hedgerow width of 4 m was selected, based
Parameters Value on the data cloud extraction technique (see methods
below) and the definition of forest areas (Forest
Sensor ALS50 II
Service Ireland, 2007a). This definition is also
Frequency 137,300 Hz
consistent with the national hedgerow map, which
Flying height 1,700 m could be used as the basis for the total national
Footprint diameter 0.39 m hedgerow area in the future inventory.
Scan angle off nadir 12°
The national definition of forest land is an area of land
Sampling density 7 returns/m2
where the tree crown cover is greater than 20% of the
Elevation accuracy 0.07 m
total area occupied. It has a minimum width of 20 m
and a minimum area of 0.1 ha and includes all trees
2.3 Definition of Hedgerows and Non- with a potential to reach 5 m in height in situ. Based on
Forest Woodlands this definition and that of hedgerows, non-forest
woodland patches can be defined as an area where
For this study hedgerows are defined as “Linear strips tree crown cover is 20% of the total area, with a
of woody plants with a shrubby growth form that cover minimum width of 4 m, a maximum width of 20 m and
>25% of the length of a field, lane or property a total area of less than 0.1 ha (i.e. wooded areas
boundary. They often have associated banks, walls, which are neither forest nor hedgerow).
ditches (drains) or trees” (Foulkes and Murray, 2005b).
More detailed definitions or sub-categories may be 2.4 Identification of Hedgerow Areas
applied at a later stage in the national inventory to
include width or hedgerow type, such as managed or Identification of hedgerow features and areas was
townland boundary hedgerows, etc. To differentiate done using various steps as outlined in the schematic
between hedgerows and non-forest patches, which are shown in Fig. 2.4:
Study area (red boundary) GIS masking layer
LiDAR-based hedgerow
area identification
Boundary vector
3D DEM model of Hedgerow classification
hedgerow showing a ditch (top view)
3D LiDAR
view Reclassified Grid
Trees
Shrub
Bank
Verge
Ground
Ditch
Figure 2.4. A schematic representation of the hedgerow classification and characterisation methodologies
used, based on Light Detection And Ranging (LiDAR) and other geographic information systems (GIS)
resources for the Frenchpark region (see text for descriptions). DEM, digital elevation model.
11Carbon sequestration by hedgerows in the Irish landscape
(a) Masking layers: Creating and compiling digitised (b) Use of land boundary vector to derive linear
vector layers of forests (FIPS2007, Forest hedgerow areas: Hedgerow areas were defined
Service), urban layers and other woodland using a boundary edges detection algorithm. A
patches. This was used to mask out vegetation high-pass filter algorithm was used to classify
classes that may be similar to woodlands in terms areas based on change in height, or intensity of
laser pulse returns across a predefined land
of elevation profiles. For example, forest trees or
boundary. In the absence of a national field
settlements are reported under different LULUCF
boundary layer, one had to be created based on
categories, so those features with a height greater
the old 25” OSi maps. The steps for generating
than 1 or 2 m may be misclassified as hedgerows
field boundary samples were:
or double accounted in LULUCF area matrices.
Polygons representing areas afforested after (i) Mosaic 25” sheets over area (Fig. 2.5a);
2007 were merged into the Forest Inventory and (ii) Perform 5 × 5 pixel morphological dilation
Planning System (FIPS) (FIPS2007, Forest over the mosaic (this has the effect of closing
Service) layer to create a forest mask of all forest small gaps, due to scanning errors, and
areas up to 2009 (FIPS2009, Forest Service), thickening lines) (Fig. 2.5b);
which corresponds to the time when the LiDAR (iii) Clumping (eight neighbours) and sieving with
data were obtained. Non-forest woodland patches a minimum 10,000 pixel size (this eliminates
were manually digitised using OSi aerial most of the symbology and writing)
photographs. (Fig. 2.5c);
(a)
(b)
Figure 2.5. Steps for generating field boundary samples.
12K. Black et al. (2010-CCRP-DS-1.1)
(c)
(d)
(e)
Figure 2.5 contd
(iv) Reset all clusters to 1 – thus creating a 1-bit (vii) Mask boundary file with corner mask clump
boundary/non-boundary file; and sieve to get rid of small segments to
create boundary file (Fig. 2.5e).
(v) In order to break the continuous boundary into
segments, identify corners and non-boundary It is important to remember that this is not
line work (roads, etc.) by convolving a suitably
intended to create a mask of all field boundaries
sized kernel (21× 21) and identify all those with
but to reliably identify a large sample of field
a sum >50% (in red, see Fig. 2.5d);
boundaries with a very low commission error from
(vi) Buffer out by 3 pixels to create a ‘corner which LiDAR data can be extracted to represent
mask’; and hedgerow boundary samples within the study
13Carbon sequestration by hedgerows in the Irish landscape
area. It seems likely that any future project will 2.6 Sampling the Canopy DEM for
have access to the OSi Prime2 database, which Treemetric Data
will provide an up-to-date set of vector field
2.6.1 Method A – Identification of individual
boundaries.
crowns
(c) The hedgerow was then further classified into The derived canopy DEM (using Fusion software, see
trees (>2 m), shrubs, ditches, verges and above) was processed using the watershed
vegetation. This was used to characterise area segmentation procedure (Edson and Wing, 2011)
using SAGA software (freeware downloaded from
(2D) assessment laser-metric information (3D)
http://sourceforge.net/projects/saga-gis/). The canopy
used in the estimation of biomass (see Fig. 2.4).
height rasters were smoothed using a Gaussian grid
filter with a search radius of 3 m. The grids were then
(d) Once hedgerow areas were identified, further
segmented using the height maxima method in SAGA.
analysis was required to differentiate between
The centroid point of the derived polygons for each
elevated or depressed features such as banks,
individual crown was used to sample the DTM raster
ditches or roads. Failure to do this would result in
using the ‘raster values from points’ tool in ArcGIS
the overestimation of hedgerow height, volume or
v. 9.3.
biomass.
2.6.2 Method B – Random sampling
2.5 Deriving a Canopy DEM for Tree heights were randomly sampled by creating
Hedgerows random points within the hedgerow boundary polygon
using the random point tool in ArcGIS. The number of
Hedgerow line features (see Section 2.4, Step b) were
random points within each hedgerow boundary
used to create a polygon layer using a 2-m buffer, polygon was determined by the area of the hedgerow
creating 4-m-wide lozenge-shaped polygons around and a 2-m predefined minimum distance between
the field boundary to sample hedgerow laser data points. Sensitivity analysis was carried out by varying
clouds. Sampled point cloud raw data were the minimum distance between points from 1 m to 5 m.
transformed into a canopy DEM using two different The number of derived sample points was compared
methods, depending on the tree height sampling with the frequency of crown centroids derived using
method used. A canopy height model (CHM) is a Method A above. A minimum distance of 2 m between
continuous interpolated surface representing the top of random points correlated best with the crown centroid
the vegetation. For the crown segmentation method frequency across 354 hedgerow samples. The 2-m
(Section 2.6.1), a canopy DEM was obtained from random sample point files were used to sample the
LiDAR raw point cloud LAS files using Fusion software DEM raster, using the ‘raster values from points tool’ in
(v. 3.01 US Forest Service). An average point spacing ArcGIS v 9.3. The reprocessing functionality was set
of 1.88 m and a filter for window smoothing of 3 × 3 up in the ArcGIS model-builder to facilitate
cells were used. For the random tree sampling method bootstrapping, where 1,000 sample iterations were run
(Section 2.6.2), the LAS file was initially clipped using to return height samples. The derived height for each
iteration was converted to above-ground biomass
the hedgerow boundary sample polygons. The clipped
using Eqn 2.1 and the mean hedgerow biomass was
LAS file was converted to ASCII format using lastools
calculated from the 1,000 interactions. Preliminary
(http://lastools.com) and projected in ArcGIS v. 9.3. All
comparison of means shows that the resulting mean of
points with a height of greater that 1.5 m were selected
cumulative iteration runs was not significantly different
and transformed to a DEM using a raster resolution of
after 25 iterations.
1 m and a filter for window smoothing of 3 × 3 cells. The
raster height values (Z) were assigned the highest Z Figure 2.6a and b shows a comparison of crown
value to represent the top of the hedgerow canopy, position in the raw point cloud data and the derived
using the 3D analyst in ArcGIS v. 9.3. crown position using the watershed segmentation
14K. Black et al. (2010-CCRP-DS-1.1)
(a)
(b)
Legend
crn maxima
crn segment
DTM
H (m)
High: 20.437
Low: 1.501
0 3.75 7.5 15 meters
Figure 2.6. (a) The raw laser point cloud data showing the position of crown tops in a selected hedgerow
polygon (as indicated by blue arrows). (b) The derived canopy digital elevation model (DEM) showing the
hedgerow height (H) on a 1-m grid. The crown segment polygon (crn segment) represents the derived
individual crowns. Each crown is represented by a height maxima (crn maxima), which is the polygon
centroid point used to sample the DEM to derive tree height. DTM, digital terrain model.
approach. This comparison shows that crowns are well refined to provide above-ground biomass (AGB)
characterised, but double crowns are identified in (measured in kg C) based on tree height (H) derived
some cases, particularly in canopy tops with little from the segmentation of tree crowns or randomly
variation in height (see tree on the left-hand side of sampled tree heights:
Fig. 2.6a and b).
AGB = 0.179 × H3.3 Eqn 2.1
2.7 Derivation of Biomass from Tree
The carbon (C) fraction for biomass determinations
Height
was assumed to be 50% (Black and Farrell, 2007).
Above-ground biomass was derived using an Broadleaf algorithms were selected because over 95%
algorithm developed from harvested broadleaves as of trees and hedge species in hedgerows located in
described in the CARBWARE forest model (see Duffy Roscommon are broadleaves, primarily ash and
et al., 2011; Black et al., 2012). The algorithm was whitethorn (Foulkes and Murray, 2005b).
15Carbon sequestration by hedgerows in the Irish landscape
2.8 Direct Derivation of Biomass from Once the significant key determinant laser-metric
Laser Return Statistics parameters were established, a non-linear mixed
effect model was developed using algorithms in the
A more direct approach to derive biomass is directly SAS NLMIXED procedure (SAS, 2008). All coefficients
from laser-metric data based on regression analysis and partial coefficients were determined using least
against biomass estimates. A major national squares optimisation in SAS. The final algorithm
developmental requirement is a direct biomass format for hedgerows (shown in Eqn 2.2a) represents
sampling of hedgerows directly after LiDAR a culmination of extensive testing of model formats and
assessments. These data could be used to model the dropping of parameter terms from the model if
biomass based on laser-metric data. However, being a parameter coefficient variables were determined not to
be significant.
desk study, this was outside the scope of the current
project. This study explored the applications of LiDAR
AG = a0 × a1 ×
data to directly determine biomass for scaling up to the
(aµ × µ (1 – Exp(aE.P70 × E.P70(a2 + aR × R))))
national or regional level. To this purpose, multiple
Eqn 2.2a
regression analyses of derived biomass estimates (as
described above) against LiDAR metrics, such as where AG is expressed in t C/ha. Terms a0, a1 and a2
mean height at a determined percentile return, number are residual scaling coefficients. The term a is a
of laser returns above 0, 0.5 and 1.5-m heights, and coefficient variable for parameters µ, E.P70 and R (see
the density of the point clouds were carried out using Table 2.2 for definition of parameters).
bivariate correlation analysis (IBM SPSS Statistics v.
19). All variables were checked for normality and The same analysis was carried out for woodland
patches, but the form of the equation varied because
normalised using log transformation if required before
some laser-metric variables showed no significant
correlation analysis.
relationship with biomass. Inclusion of the variable R
did not improve the performance of the model, so this
The clipped LAS files (see Section 2.4) for each
term was dropped from the model (Eqn 2.2b). The final
hedgerow length were used to derive descriptive
equation for direct estimation of biomass (t C/ha) for
statistics, including hedgerow polygon area, number of
the woodland patches was:
total first, second, third and fourth returns, mean height
and laser intensity returns at percentile return at 10% AG = a0 + aµ × µ × aE.P70 × E.P70 Eqn 2.2b
bin sizes. The statistics were run using pre-selected
height values of zero (ground level), 0.5 and 1.5 m Performance of model calibration was assessed using
root mean squared error (RMSE) and accuracy (a
above the ground to assess the error introduced by
measure of bias):
including ground returns under the hedgerow canopy
after ground returns have been removed from the 2
( xi – Xi )
n
canopy point cloud. RMSE = ∑ ----------------------
n–p
- Eqn 2.3
1
Table 2.2. Description of used laser-metric model parameters, including all point data
above 0, 0.5 or 1.5 m in height.
Laser-metric variable Abbreviation Derived from
Density and structure of hedgerow µ Ratio of 2nd to 1st returns
Density of hedgerow R Number of returns/m2
Mean height e.g. E.P70 Mean elevation of the 70th percentile return
Laser intensity e.g. I.P70 Mean laser intensity of the 70th percentile
return
16You can also read