July 2021 Tennessee State Climate Summary
←
→
Page content transcription
If your browser does not render page correctly, please read the page content below
July 2021 Tennessee State Climate Summary

          July 2021 Tennessee State Climate Summary
                      Tennessee Climate Office * East Tennessee State University
                         Prepared by William Tollefson and Dr. Andrew Joyner
                  With contributions by Climate Data Representatives across the state

Monthly Temperature Summary:
Mean temperatures for the month were generally close to normal, within 1°F of normal for most areas of
the state; the Clarksville airport station exactly matched its 30-year climate normal mean temperature for
July. However, those close to average monthly temperatures hide a couple major swings in daily
temperatures. The monthly temperature ranged from a low of 37°F at Mt. LeConte (July 4) to a high of
101°F at Woodbury (July 29). Near the beginning of the month, over the 4th of July weekend many
locations saw pleasantly cool temperatures with eight stations (all of which have at least 30-year station
histories) setting daily record low temperatures and six stations tying daily record low temperatures on
the 3rd or 4th. Then the second half of July brought hot and humid conditions to the state, with heat
advisories issued for many locations, especially West Tennessee, where at least one county was under a
heat advisory from July 24-27 and 29-31. Four weather stations (with at least 30-year station histories)
set daily record highs, two others tied daily record highs, and four stations set daily record warm low
temperatures July 29-30.

                                                                                                        1
July 2021 Tennessee State Climate Summary

Monthly Precipitation Summary:
Precipitation was highly variable and spotty, with slow moving or meandering thunderstorms producing
localized heavy rainfall, while nearby areas missed out on rainfall all together. The northern portion of the
Tennessee Valley in East Tennessee was the driest region in the state, with the Knoxville Airport reporting
only 1.7” of rain for the month, this was the second driest July in the last 30 years for the Knoxville airport,
and the 7th driest July in the 151 years of weather data for the Knoxville area.
Generally, the southern half of the state recorded above normal precipitation for the month. A bullseye
of 300-400% normal monthly rainfall occurred over southern Wayne/Lawrence Counties, partly due to 3-
4” of rain produced by a thunderstorm on July 9. That storm produced flash flooding which led to the
swift-water rescue of 22 kayakers on Shoal Creek. That part of the state recorded several heavy rain
producing storms, leading to radar estimates of 10-15” of rainfall for the month. While some parts of
Davidson county actually recorded slightly below normal rainfall for the month, the weather station at
the Nashville airport recorded 8.74” of rain, making it the second wettest July in the city’s 148-year
weather record, and the wettest July in the past 30 years. Of the monthly total, 3.13” was recorded on
July 31, which set a daily rainfall record for the date (smashing the old record of 2.16” set in 1929).

                                                                                                              2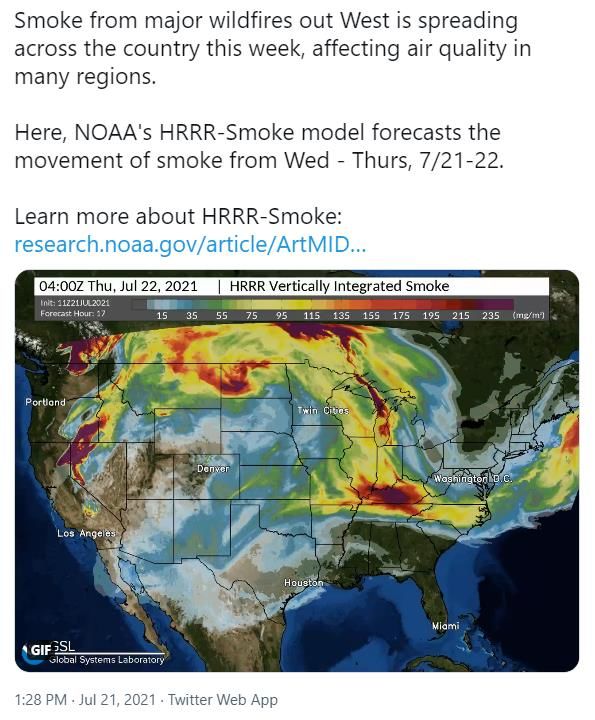
July 2021 Tennessee State Climate Summary

Station Data and Top Tenn. (warmest/wettest, coldest/driest stations of the month):
Station data for airports across the state using WBAN weather stations, compared to 1991-2020 climate
normals:
  Station Name                             Temperatures (˚F)                                     Precipitation (inches)
                             Averages                              Extremes                               Totals
                 Max      Min      Mean    Depart    High        Date      Low      Date       Obs       Depart    %Norm
   Memphis       89.6     73.6      81.6    -1.2     96          7/31      65       7/4    8.08          3.26      168%
    Jackson      88.4     69.2      78.8    -0.7     95          7/31      56       7/4    6.54          2.17      150%
   Clarksville   87.6     68.8      78.2    0.0      94          7/28      58       7/3    4.30          0.56      115%
   Nashville     90.7     71.5      81.1    0.4      97          7/25      61       7/4    8.74          4.58      210%
 Chattanooga     89.2     71.2      80.2    -0.5     96          7/30      63       7/4    4.71          -0.37      93%
   Crossville    81.7     64.5      73.1    -0.7     88          7/28      52       7/3    5.62          0.16      103%
   Knoxville     88.5     68.9      78.7    0.2      97          7/28      59       7/4    1.70          -3.55      32%
     Bristol     88.0     65.1      76.5    0.9      93          7/28      54       7/3    4.02          -0.98      80%
Departures and %Norm Key: Warmer than Normal, Cooler than Normal; Wetter than Normal, Drier than Normal
                             Hottest Stations (highest maximum temperature)
                                                                                   Highest
                                                                 Station
                                 Station Name                                    Temperature     Date
                                                                  Type
                                                                                     (F)
                            WOODBURY 1 WNW                        COOP               101          29
                                 BRENTWOOD                        COOP               98           28
                            NASHVILLE INTL AP                     WBAN               97           25
                                 KNOXVILLE AP                     WBAN               97           28
                          SHILOH NMP TENNESSEE                    RAWS               97           26
                         FRANKLIN SEWAGE PLANT                    COOP               97           29
                          NASHVILLE BERRY FIELD                   COOP               97           26
                                 WARNER PARK                      COOP               97           24
                            CHATTANOOGA AP                        WBAN               96           30
                        MEMPHIS INTERNATIONAL AP                  WBAN               96           31
                            DYERSBURG III GOLF                    WBAN               96           30
                                 MEMPHIS WFO                      WBAN               96           31
                        CAMDEN TOWER TENNESSEE                    RAWS               96           25
                                 WAYNESBORO                       COOP               96           31
                            LEWISBURG EXP STA                     COOP               96           26
                             JACKSON EXP STA                      COOP               96           26
                                 MILAN EXP STN                    COOP               96           28
                            OLD HICKORY DAM                       COOP               96           29
                                 LEBANON 7 N                      COOP               96              7
                                   CAMDEN                         COOP               96           26
                   MOUSETAIL LANDING STATE PARK                   COOP               96           31
                   SHELBY BOTTOMS NATURE CENTER                   COOP               96           29
                                                            th
                           Fourteen stations tied for the 9 hottest temperature (96°F)

                                                                                                                           3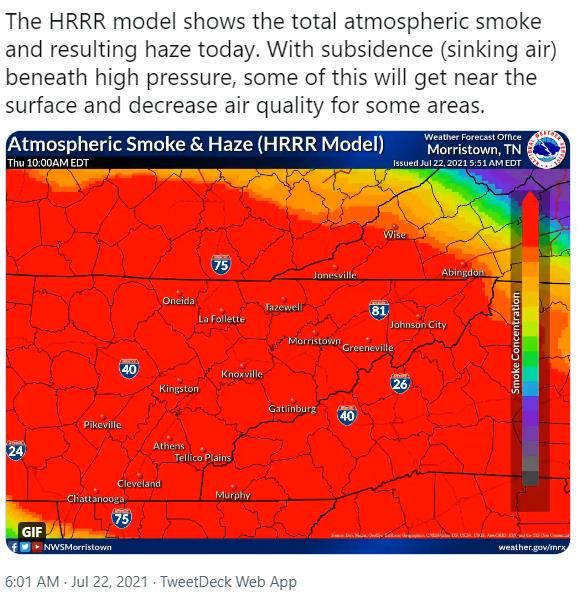
July 2021 Tennessee State Climate Summary

                            Coldest Stations (lowest minimum temperature)
                                                   Station      Lowest
                            Station Name                                       Date
                                                    Type     Temperature (F)
                            MT LECONTE              COOP          37            4
                          NEWFOUND GAP             COOP            46           3
                       ROAN MOUNTAIN 3SW           COOP            48           4
                        CHEROKEE TENNESSEE         RAWS            49           4
                    PULASKI WASTEWATER PLANT       COOP            50          10
                         CLARKSVILLE WWTP          COOP            50           4
                             TAZEWELL              COOP            51           3
                             COALMONT              COOP            51           4
                  CROSSVILLE AREA OFFICE TENNESS   RAWS            51           3
                          CROSSVILLE 7 NW          WBAN            51           3

                            Warmest Stations (highest mean temperatures)
                                                                  Mean Temperature
                            Station Name           Station Type
                                                                         (F)
                    MEMPHIS INTERNATIONAL AP         WBAN               81.6
                          NASHVILLE INTL AP          WBAN               81.1
                       NASHVILLE BERRY FIELD          COOP              80.9
                           MEMPHIS WFO               WBAN               80.3
                          CHATTANOOGA AP             WBAN               80.2
                              CAMDEN                  COOP              80.1
                       SHILOH NMP TENNESSEE           RAWS               80
                          JACKSON EXP STA             COOP              79.9
                         GERMANTOWN 4SE               COOP              79.8
                         DYERSBURG III GOLF          WBAN               79.7

                             Coolest Stations (lowest mean temperatures)
                                                                  Mean Temperature
                            Station Name           Station Type
                                                                         (F)
                             MT LECONTE               COOP              58.8
                           NEWFOUND GAP               COOP              65.3
                        ROAN MOUNTAIN 3SW             COOP              68.1
                        CHEROKEE TENNESSEE            RAWS              69.8
                            TOWNSEND 5S               COOP              71.5
                          GATLINBURG 2 SW             COOP              71.8
                             COALMONT                 COOP              72.1
                          CROSSVILLE 7 NW             WBAN              72.1
                             MONTEAGLE                WBAN              72.9
                      CROSSVILLE MEMORIAL AP          WBAN              73.1

                                                                                      4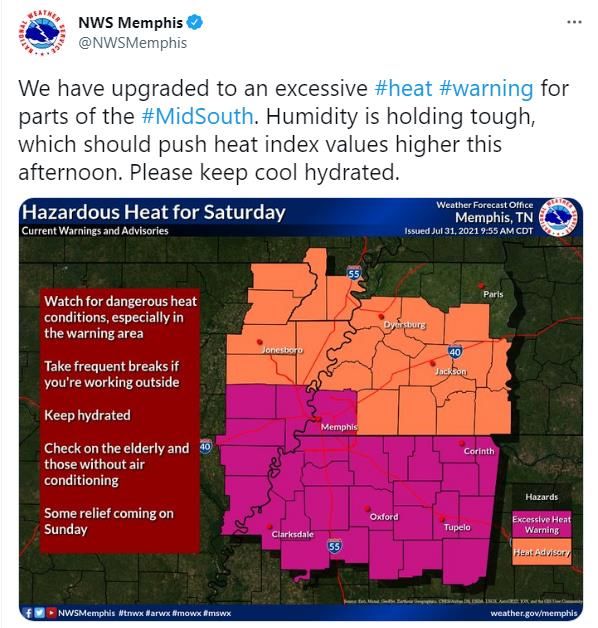
July 2021 Tennessee State Climate Summary

                             Wettest Stations (highest precipitation totals):
                                                                      Total Precipitation
                             Station Name              Station Type
                                                                              (in)
                       FAIRFIELD GLADE 0.1 NNW          CoCoRaHS             12.07
                          CLEVELAND 1.7 WNW             CoCoRaHS            12.03
                            MEMPHIS 12.0 SE             CoCoRaHS            12.02
                          CROSSVILLE 5.8 SSW            CoCoRaHS            11.47
                            CROSSVILLE 4.7 S            CoCoRaHS            11.13
                            PIKEVILLE 7.5 SW            CoCoRaHS            10.27
                    MOUSETAIL LANDING STATE PARK           COOP             10.25
                          HERMITAGE 3.2 SSW             CoCoRaHS            10.23
                            CROSSVILLE 6.9 S            CoCoRaHS               9.8
                            SOMERVILLE 10N                 COOP                9.65

                              Driest Stations (lowest precipitation totals):
                                                                      Total Precipitation
                             Station Name              Station Type
                                                                              (in)
                           FRANKLIN 3.6 NW              CoCoRaHS             1.38
                          MAYNARDVILLE 0.6 E            CoCoRaHS               1.57
                             KNOXVILLE AP                 WBAN                 1.7
                       FRANKLIN SEWAGE PLANT               COOP                1.78
                            FRANKLIN 4.4 W              CoCoRaHS               1.85
                      MORRISTOWN RADIO WCRK                COOP                1.85
                           KNOXVILLE 5.3 SSW            CoCoRaHS               1.92
                           OLD HICKORY DAM                 COOP                 2
                        LIVINGSTON RADIO WLIV              COOP                2.2
                           CENTERVILLE 9.5 N            CoCoRaHS               2.23

The Month in Comparison:
Comparing the mean monthly temperature and total precipitation for July 2021 at select automated
airport weather stations to the conditions for July in the previous thirty years, it was the wettest July in
that time period for Nashville, and second driest for Knoxville. The other airports were closer to average
precipitation. Looking at temperatures it was a mixed bag as Memphis, Jackson, and Chattanooga
recorded temperatures that were cooler than the average for July over the past thirty years, but Nashville,
Knoxville, and Bristol/Tri-Cities recorded temperatures that were warmer than the average for July over
the past thirty years.

                                                                                                          5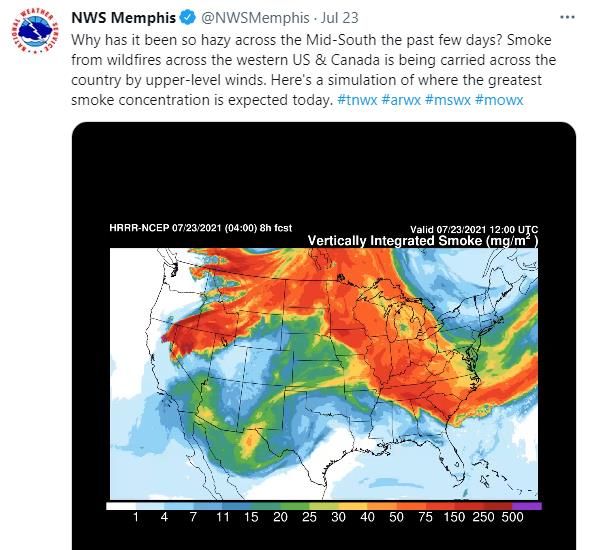
July 2021 Tennessee State Climate Summary

                                            6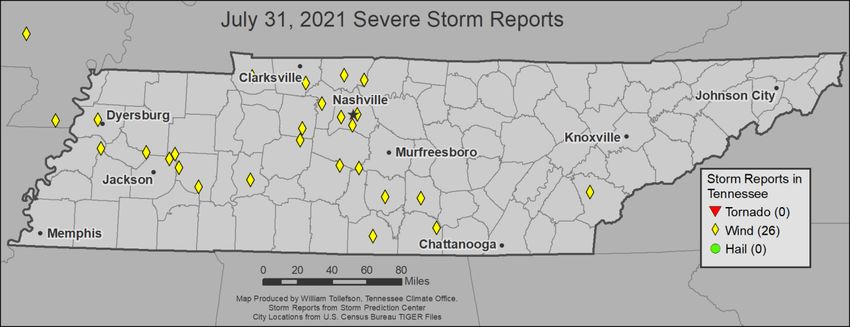
July 2021 Tennessee State Climate Summary

                                            7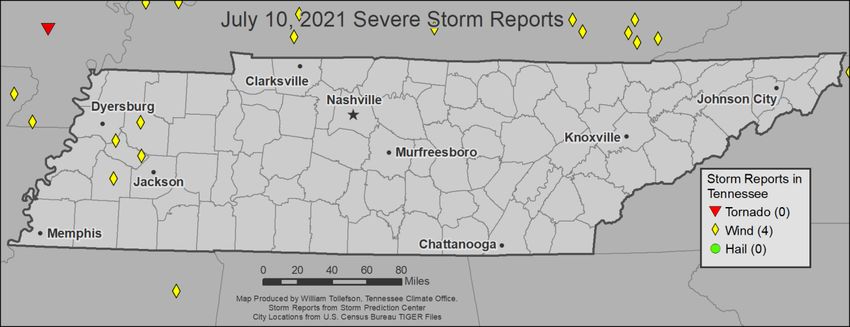
July 2021 Tennessee State Climate Summary

                                            8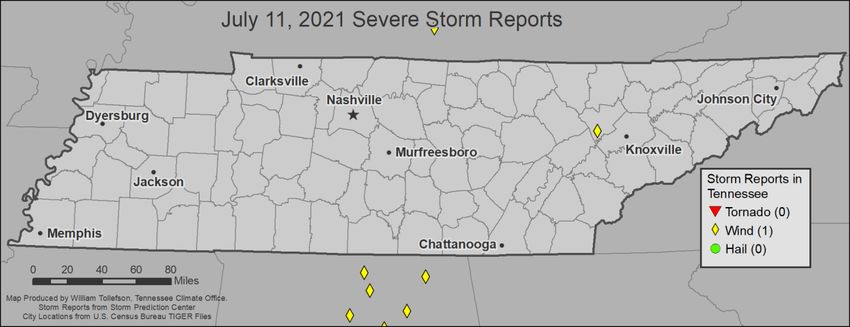
July 2021 Tennessee State Climate Summary

Drought Monitor:
At the end of the month a small area of Moderate Drought (D1) was present in Grainger and Hamblen
Counties in northeast Tennessee (covering 0.32% of the state), surrounded by an area of Abnormally Dry
conditions (D0) that followed along the Holston River valley from the east side Knoxville up to the Virginia
border on the west side of Kingsport (covering 3.87% of the state). During the month of July, abundant
rainfall in West Tennessee cleared an area of Abnormally Dry (D0) conditions that stretched from northern
Shelby County up to Obion County. This represents a general improvement in the coverage of Abnormally
Dry conditions which reached a peak coverage of 13.73% of the state in the July 6 release of the U.S.
Drought Monitor.

                                                                                                          9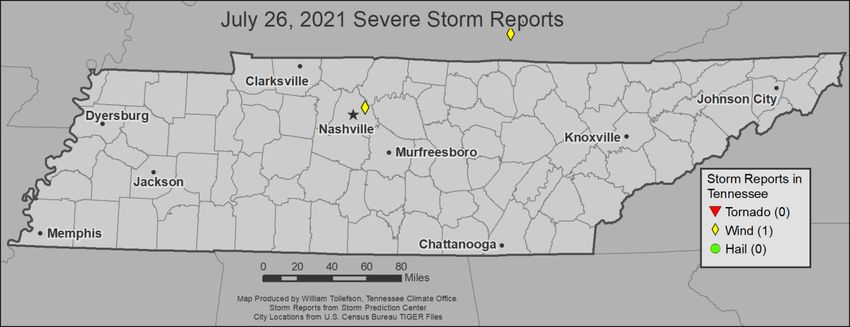
July 2021 Tennessee State Climate Summary

Soil Moisture:
At the end of July, the USDA reported that topsoil moisture was 3% very short, 20% short, 73% adequate,
and 4% surplus across Tennessee. Subsoil moisture was reported as 2% very short, 19% short, 76%
adequate, and 3% surplus across the state. Maps from the NASA SPoRT Land Information System show
low soil moisture levels in much of East Tennessee, northern portions of Middle Tennessee, and in the
Mississippi River counties of West Tennessee. The only areas with high percentiles (surplus) of soil
moisture were in southwest Middle Tennessee, along the western bend of the Tennessee River, and in
the southeast corner of the state. Most of the state also recorded a drying trend in soil moisture, with
exceptions on the Cumberland Plateau and in some parts of the western Tennessee River Valley.

                                                                                                     10
July 2021 Tennessee State Climate Summary
Streamflow:
Streamflow averaged over July shows the area of abnormally dry conditions in the northern Tennessee
Valley of East Tennessee with below normal streamflow for the month. The Harpeth River at Bellevue in
Davidson County also averaged below normal streamflow, since it was downstream of the drier than
normal conditions of central Williamson County and southern Davidson County. Although this area
recorded heavy rains at the end of the month, this was not enough to bring the average streamflow for
the month into the normal range. Otherwise streamflow was normal to above normal. With most gauges
showing above normal flow along the East Tennessee mountains and in the southwest region of the state
where most locations recorded above normal rainfall.
11July 2021 Tennessee State Climate Summary
Miscellaneous:
Crop Conditions from USDA: During the first half of July, winter wheat harvests were completed in
Tennessee, with good yields reported and 83% of the crop in good or excellent condition. For the second
half of the month in West and Middle Tennessee armyworms were producing negative impacts on
pastures, late planted wheat, soy beans, turf, and gardens. Many tomato producers in West Tennessee
were harvesting tomatoes two to three weeks early due to insect pressures, after slow progress due to
cool and wet weather in the beginning of the month. Dry weather was a major concern for agriculture
across East Tennessee this month, with stress showing up in crops and cattle. Some cattle were being sold
early due to short hay supplies and other producers are already feeding hay due to dry pastures. Across
the state, hay and roughage supplies were rated as 2% very short, 9% short, 72% adequate, and 17%
surplus at the end of the month.
Fire Danger: The Interagency Fire Center outlook for August shows that all of Tennessee along with
surrounding regions will have below normal potential for significant wildland fires.
12July 2021 Tennessee State Climate Summary
Story of the Month:
The main stories of July were the smoke and air quality issues and the heat wave that impacted the state
during the second half of the month. Air quality alerts were issued for the major metro areas across the
state and smoky/hazy conditions were reported for several days. This smoke and haze came largely from
the large fires impacting the western US and Canada, as the jet stream pushed plumes of smoke from the
West and Canada down into the Eastern US. This combined with high pressure in the region that allowed
that smoke to push down closer to the ground, impacting surface air quality in Tennessee in the later parts
of July.
13July 2021 Tennessee State Climate Summary
14July 2021 Tennessee State Climate Summary
As the jet stream shifted, moving the smoky conditions farther north, it also allowed for high heat and
humidity to move into Tennessee for the last week of July. Heat advisories were issued across the state,
with West Tennessee having the longest lasting heat wave, with at least one county under a heat advisory
July 24-27 and July 29-31. Their heat wave peaked on July 31, with heat index values pushing up over
105°F for many locations, the ASOS station at Millington Regional Airport in northern Shelby County
reported a peak heat index value of 121°F (combining temperatures in the mid-90s with a dew point
temperature that reached 80°F)!
15July 2021 Tennessee State Climate Summary
16July 2021 Tennessee State Climate Summary
Storm Reports:
*Storm Reports are based on filtered NOAA Storm Prediction Center data or local NWS storm reports. Future quality
control checks may change the official record of severe events, please see spc.noaa.gov for any updates.
There were seven days in July with severe weather reports, with no tornadoes, 35 reports of severe wind
damage, and no reports of hail 1-inch or larger in diameter. The majority of severe storm reports came on
July 31, with 26 of the 35 reports of severe wind damage occurring on this one day.
July 8:
Wind:
Time Speed
Location County Lat Lon Comments
(UTC) (mph)
2E POWERLINES DOWN ALONG THE 300 BLOCK OF
4:05 -- MADISON 35.72 -88.93
ADAIR ASHPORT ROAD. (MEG)
July 10:
Wind:
Time Speed
Location County Lat Lon Comments
(UTC) (mph)
TREE DOWN ON EAST ROAD IN
5:50 -- FRIENDSHIP CROCKETT 35.91 -89.24
FRIENDSHIP. (MEG)
17July 2021 Tennessee State Climate Summary
Time Speed
Location County Lat Lon Comments
(UTC) (mph)
TREE DOWN KEY CORNER IN BROWNSILLE.
6:03 -- BROWNSVILLE HAYWOOD 35.59 -89.25
(MEG)
6:11 -- DYER GIBSON 36.07 -88.99 SEVERAL TREE LIMBS DOWN (MEG)
1 NE TREE DOWN NORTHEAST OF GADSDEN
6:15 -- CROCKETT 35.79 -88.97
GADSDEN (MEG)
July 11:
Wind:
Time Speed
Location County Lat Lon Comments
(UTC) (mph)
POWER OUTAGES REPORTED IN OAK RIDGE BY
5 NNE
LOCAL MEDIA ASSOCIATED WITH A
0:50 -- OAK ANDERSON 36.02 -84.25
THUNDERSTORM. WIND GUST OF 30 MPH
RIDGE
OBSERVED AT KOQT. TIME ESTIMATED. (MRX)
18July 2021 Tennessee State Climate Summary
July 13:
Wind:
Time
Speed Location County Lat Lon Comments
(UTC)
SEVERAL LARGE TREES DOWN IN THE
3 NE
17:19 -- MACON 36.59 -86.2 HAWKINS RD AND TRAMMEL CREEK RD AREA
WESTMORELAND
(OHX)
July 26:
Wind:
Time Speed
Location County Lat Lon Comments
(UTC) (mph)
DAMAGE TO HOME SIDING... OUTBUILDING
DESTROYED... A/C UNIT PUSHED OFF
2 WSW
20:25 -- DAVIDSON 36.23 -86.66 FOUNDATION. MICROBURST SIGNATURE... BUT
LAKEWOOD
40 MPH MAX FROM RADAR. DAMAGE
CONCENTRATED ON HUDSON ROAD. (OHX)
19July 2021 Tennessee State Climate Summary
July 30:
Wind:
Time Speed
Location County Lat Lon Comments
(UTC) (mph)
1 WSW TREE DOWN ON POWER LINES AT 1518
21:35 -- LAWRENCE 35.43 -87.32
SUMMERTOWN TURNPIKE (OHX)
July 31:
Wind:
Time Speed
Location County Lat Lon Comments
(UTC) (mph)
MULTIPLE TREES ON POWERLINES. TIME
0:12 -- SPRINGFIELD ROBERTSON 36.5 -86.88
ESTIMATED FROM RADAR (OHX)
A FEW TREES DOWN IN THE
10 SSE
0:32 -- MONTGOMERY 36.43 -87.28 SOUTHEASTERN PORTION OF THE
CLARKSVILLE
COUNTY. (OHX)
3 WSW TREES AND POWERLINES DOWN ALONG
0:40 -- CHEATHAM 36.26 -87.11
ASHLAND CITY HWY 49. (OHX)
TREES ON POWERLINES. TIME
0:40 -- WHITE HOUSE ROBERTSON 36.46 -86.67
ESTIMATED FROM RADAR (OHX)
4 NW BELLE SEVERAL TREES DOWN IN BELLS BEND AT
1:30 -- DAVIDSON 36.15 -86.91
MEADE 3964-4001 OLD HICKORY BLVD (OHX)
20July 2021 Tennessee State Climate Summary
Time Speed
Location County Lat Lon Comments
(UTC) (mph)
FROM EM...NUMEROUS TREES DOWN
ACROSS THE SOUTHERN PART OF THE
2:12 -- OAK HILL DAVIDSON 36.08 -86.79
COUNTY. TIME ESTIMATED VIA RADAR.
(OHX)
TREES DOWN WITH POWER OUTAGES.
2:20 -- DOVER STEWART 36.48 -87.84
TIME ESTIMATED FROM RADAR. (OHX)
4 NW TREE ON POWER LINES ON RAMBO
2:43 -- DYER 36.08 -89.43
DYERSBURG ROAD. (MEG)
NUMEROUS TREES DOWN ACROSS THE
2:48 -- BLUE GOOSE HENDERSON 35.7 -88.58
ENTIRE COUNTY. (MEG)
LARGE BRANCHES DOWN NEAR
2:50 -- 1 E GATES LAUDERDALE 35.84 -89.39
LAWRENCE ROAD (MEG)
3:10 -- BURNS DICKSON 36.05 -87.31 TREE DOWN IN BURNS. (OHX)
NUMEROUS TREES AND POWER LINES
WERE KNOCKED DOWN IN THE
1W
3:15 -- GIBSON 35.82 -88.92 HUMBOLDT AREA. WIND DAMAGE ALSO
HUMBOLDT
OCCURRED IN THE BRAZIL AREA AND THE
GIBSON WELLS AREA. (MEG)
3:20 -- BON AQUA HICKMAN 35.95 -87.33 TREE DOWN ACROSS MILL RD. (OHX)
TSPOTTER REPORT OF A TREE DOWN AT
1 E EAST
3:39 -- DAVIDSON 36.17 -86.74 THE ENTRANCE OF SHELBY PARK ON
NASHVILLE
19TH. (OHX)
TREES DOWN ALONG HIGHWAY 70
1 WSW CEDAR BETWEEN THE MIDDLE FORK OF THE
3:41 -- CARROLL 35.81 -88.62
GROVE FORKED DEER RIVER AND FRY ACCESS
ROAD. (MEG)
TREES DOWN ALONG FITZROY CIRCLE
3:45 -- SPRING HILL MAURY 35.74 -86.92
AND STEWART CAMPBELL POINT (OHX)
TREE DOWN ACROSS HWY 70 SOUTH OF
3:45 -- SPRING CREEK MADISON 35.77 -88.68
SPRING CREEK (MEG)
NUMEROUS TREES DOWN ACROSS THE
3:48 -- BLUE GOOSE HENDERSON 35.7 -88.58
ENTIRE COUNTY. (MEG)
4 WSW TREE FELL ON A HOUSE. POWER IS OUT
3:53 -- WILLIAMSON 35.72 -86.72
EAGLEVILLE IN THE AREA. (OHX)
TREES AND POWERLINES DOWN ON
4:11 -- 2 NW REAGAN HENDERSON 35.54 -88.37
DYERS CHAPEL ROAD. (MEG)
1 SSW LARGE TREE DOWN ON BELMONT
4:37 -- BEDFORD 35.48 -86.45
SHELBYVILLE AVENUE (OHX)
***CORRECTED FOR TIME*** DISPTACH
REPORT OF MULTIPLE TREES DOWN IN
4:42 -- LINDEN PERRY 35.61 -87.84
LINDEN AND LOBELVILLE. TIME
ESTIMATED VIA RADAR. (OHX)
SEVERAL TREES DOWN WITHIN THE CITY
OF FAYETTEVILLE... INCLUDING A TREE
4:58 -- FAYETTEVILLE LINCOLN 35.15 -86.57
DOWN ON A TRUCK. TIME ESTIMATED BY
RADAR. (HUN)
REPORT OF LARGE TREE DOWN
4:58 -- MANCHESTER COFFEE 35.47 -86.08
BLOCKING ALVIN COCKER ROAD. (OHX)
21July 2021 Tennessee State Climate Summary
Time Speed
Location County Lat Lon Comments
(UTC) (mph)
COUPLE OF TREES DOWN ALONG
5:21 -- 1 N SEWANEE FRANKLIN 35.22 -85.92 ROARKS COVE ROAD. TIME ESTIMATED
BY RADAR. (HUN)
1 SE 2 TREES DOWN NEAR BALLPLAY ROAD.
6:40 -- MONROE 35.51 -84.34
MADISONVILLE (MRX)
22July 2021 Tennessee State Climate Summary
CPC Outlooks for the Next Month:
The NOAA Climate Prediction Center Outlooks for August indicate that West Tennessee has slightly better
chances of observing below normal temperatures for the month, while the rest of the state has equal
chances of below normal, above normal, or near normal temperatures. All of Tennessee is shown with
slightly better chances of observing above normal precipitation for August.
23You can also read