Justification and selection of vegetation indices to determine the early soybeans readiness for harvesting - E3S Web of Conferences
←
→
Page content transcription
If your browser does not render page correctly, please read the page content below
E3S Web of Conferences 273, 01008 (2021) https://doi.org/10.1051/e3sconf/202127301008
INTERAGROMASH 2021

 Justification and selection of vegetation indices
 to determine the early soybeans readiness for
 harvesting
 Rashid Kurbanov1 and Natalia Zakharova1,*
 1
 Federal Scientific Agroengineering Center VIM, Department of intellectualization, automation and
 robotics of agricultural machinery production, 1-st Institutsky proezd, 109428 Moscow, Russia

 Abstract. An unmanned aerial vehicle monitoring provides operational
 information on soybean harvesting readiness for breeders and agronomists.
 The purpose of the study is to substantiate the choice of vegetation indices
 to assess the content of chlorophyll a and b, which contribute to determining
 the early readiness of soybean crops for harvesting, based on data obtained
 from an unmanned aerial vehicle. The research was conducted at the
 soybean breeding field in 2020. Seven broad-band vegetation indices NDVI,
 NDRE, ClGreen (GCI), CCCI, CVI, GNDVI, MCARI were used in the
 study, estimating changes in chlorophyll a and b content in soybean leaves.
 Vegetation indices, which in complex testify to the early readiness of
 soybean crops for harvesting, have been revealed. The statistical difference
 between the values of the indices of early maturing and late maturing
 samples was calculated. The data obtained contributed to the development
 of custom formulas for assessing the early harvesting readiness of soybeans.

 1 Introduction
 Chlorophyll a and b and carotenoids are the main classes of photosynthetic pigments
 found in green vegetation. One of the main pigments, chlorophyll, absorbs solar radiation to
 the greatest extent in the spectral ranges of the red and blue channels. While carotenoids,
 including xanthophylls, absorb small amounts of solar radiation in the blue and green bands
 and transmit it to the reaction center of photosynthesis [1]. Green vegetation is characterized
 by high reflection values in the green channel, giving the leaves their characteristic color [2].
 In digital agriculture, multispectral [3], thermal [4] and hyperspectral [5 – 6] cameras act
 as suspended equipment [7] for ground [8] and aerial vehicles [9]. In the soybean crops
 research, unmanned aerial vehicles (UAVs) of fixed-wing [10] and multi-rotor [11] types are
 used. UAVs complete with suspended equipment [12 – 13] allow obtaining accurate and
 high-quality data with a high spatial resolution up to 10 centimeters/pixel [14] on the state of
 agricultural biological objects. After processing the aerial photography data, there is the
 creation of an orthophotoplane, a digital terrain model and the calculation of vegetation
 indices, and the generation of maps for these indices.

 *
 Corresponding author: smedia@vim.ru

 © The Authors, published by EDP Sciences. This is an open access article distributed under the terms of the Creative
 Commons Attribution License 4.0 (http://creativecommons.org/licenses/by/4.0/).
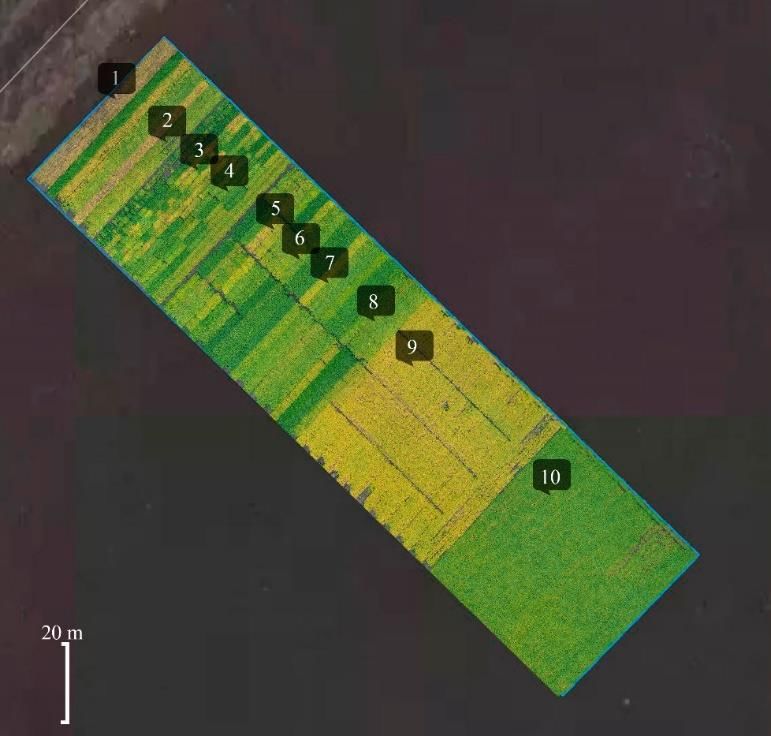
E3S Web of Conferences 273, 01008 (2021) https://doi.org/10.1051/e3sconf/202127301008 INTERAGROMASH 2021 Researchers often use broadband vegetation indices, for example, NDRE - Normalized difference red edge index [15], CVI - Chlorophyll vegetation index, CCCI - Canopy Chlorophyll Content Index [16], ClGreen (GCI) - Chlorophyll Index Green [17], GNDVI – Green Normalized Difference Vegetation Index [18], and narrow-band vegetation indices, for example, CCI – Chlorophyll/Carotenoid index [19], CARI – Chlorophyll Absorption Ratio Index [20], LCI – Leaf Chlorophyll Index [21] and others [16] to study the chlorophyll content in plants. The use of vegetation indices is popular to assess chlorophyll content, among other things, to record changes in plant photosynthetic activity [22], biomass [23] the nitrogen starvation presence [24] fixation of wilting processes [25] and plants senescence [26]. The plants' senescence process has key importance in the formation of crop yields. With the plants' premature senescence caused by unfavorable environmental conditions, a decrease in yield occurs. Senescence begins at the final stages of the annual crop growing season. At this time, chlorophyll is destroyed, leaves wither and turn yellow, seeds develop, nutrients are remobilized into seeds, so more than 70% of nitrogen enters seeds from senescent leaves [27]. It is possible to estimate the chlorophyll concentration in the leaves and assess the degree of plants senescence by measuring the absorption of light in the red and red edge ranges. According to the degree of plants senescence, breeders can assess their readiness for harvesting, for example, soybean plants are ready for harvesting when the leaves and stems turn yellow, and the seed pods turn brown or black. There is a use of remote sensing data for phenotyping soybean crops [28 – 29], stress detection [4], predicting readiness for harvesting [27], and yield [30], determination of crop density [31]. The question of determining the early soybean crop's readiness for harvesting using a UAV has not been sufficiently disclosed. So, it is relevant to further research on this subject. The purpose of this article is to substantiate the vegetation indices choice that contributes to the determination of the early readiness of soybean crops for harvesting, based on data obtained from a UAV and a multispectral camera. 2 Materials and methods 2.1 Study Area The research took place on the breeding field of soybean crops ISA - a branch of the Federal Scientific Agroengineering Center VIM in the Ryazan region (54°579505N, 39°552494E). There were two stages for field sowing: on May 8 - the collection farm and on May 12 other plots. There were eight flights: 06/11/2020 (31 and 35 days after planting (DAP)); 06/22/2020 (42 and 46 DAP); 07/02/2020 (52 and 56 DAP); 07/17/2020 (67 and 71 DAP); 07/31/2020 (81 and 85 DAP); 08/14/2020 (95 and 99 DAP); 08/26/2020 (107 and 111 DAP) and 09/08/2020 (120 and 124 DAP) in the main phases of soybean vegetation: shoots, branching, flowering, fruit formation, seed filling, ripening. The harvesting of crops was during the period from August 27 to September 24. The total area under research was 0.9956 ha. When analyzing the vegetative growth of soybean crops in the breeding area, researchers selected ten points, where samples No. 1 and No. 9 correspond to early ripening varieties, No. 2-8 - to medium ripening ones, and No. 10 - to late-ripening soybeans (Figure 1). The coordinates of each spot were recorded. There also was data recording of considered indices in each of the ten samples during the main phases of soybean vegetation and the indices' average values by field. 2
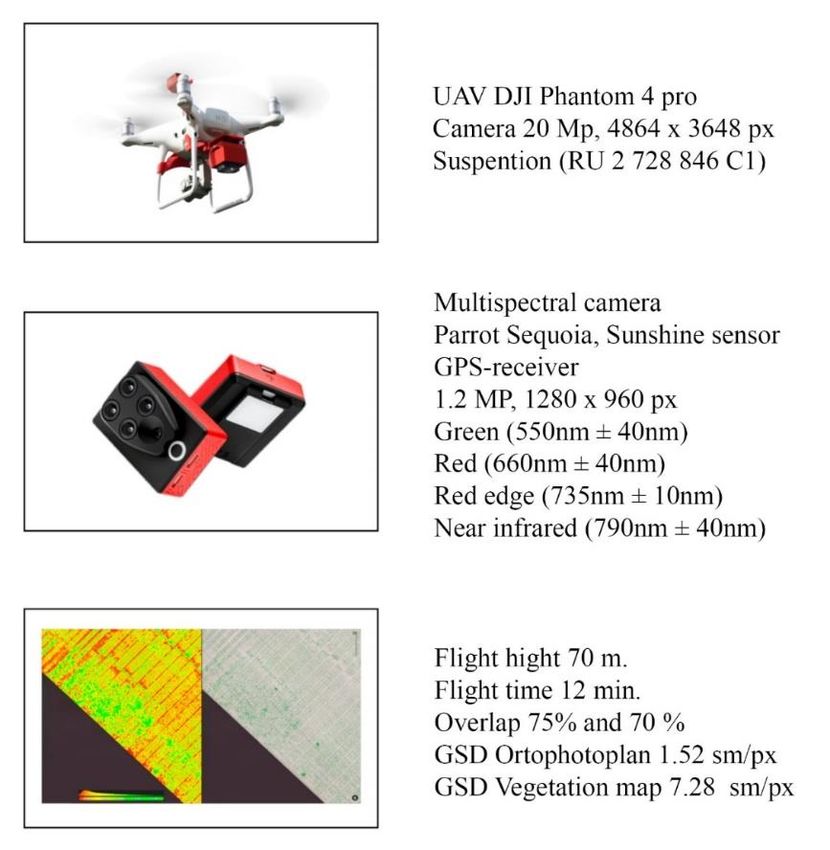
E3S Web of Conferences 273, 01008 (2021) https://doi.org/10.1051/e3sconf/202127301008 INTERAGROMASH 2021 Fig. 1. Location of samples No. 1-10 on the soybean breeding field 2.2 Weather conditions Breeders recorded weather conditions every day at the local weather station three times a day (at 9:00, 12:00, and 18:00). The meteorological station is located (54.584002, 39.557963) in the Podvyazye village, Ryazan District, Ryazan Region, Russia. They also registered the minimum, maximum, and average temperature per day and the amount of precipitation in mm, that fell during the day. The online service (Yandex Pogoda https://yandex.ru/pogoda/) provided the average statistical data on weather conditions for the last ten years. 2.3 Unmanned Aerial Vehicle Platform and Sensor A DJI Phantom 4 pro quadrocopter was used in the research (Dajiang Innovation Technology Co., China) with an attached multispectral camera Parrot Sequoia 4.0. The designed suspension, which took into account the sensors and detectors of the UAV (RU 2 728 846 C1), attached the camera to the drone [32]. The flights had altitudes at 70 meters during 12 minutes with a side and front overlap of 75% and 70% (Figure 2). 3
E3S Web of Conferences 273, 01008 (2021) https://doi.org/10.1051/e3sconf/202127301008
INTERAGROMASH 2021

 Fig. 2. Platform characteristics

 2.4 Data Processing
 For photogrammetric processing, Pix4D Mapper software, Ag Multispectral template was
 used. There was a creation of highly detailed orthophotoplane, a digital surface model,
 reflection maps, and spectral maps of seven vegetation indices (Table 1). These broadband
 vegetation indices were selected based on the available spectral channels and their ability to
 estimate the chlorophyll content in plants.
 Table 1. Broadband vegetation indexes for chllorophil estimation
 Name Formula* References [16]
 Normalized NDVI N– R Rouse et al.
 difference N + R
 vegetation ındex
 Normalized NDRE N – RE Caroline et al.
 difference red edge N + RE
 index
 Canopy CCCI N − RE El-Shikha et al.
 Chlorophyll N + RE
 Content Index N−R
 N+R
 Chlorophyll CVI R Vincini et al.
 vegetation index N× 2
 G
 Chlorophyll Index ClGreen N Ahamed et al.
 Green (GCI) −1
 G

 4
E3S Web of Conferences 273, 01008 (2021) https://doi.org/10.1051/e3sconf/202127301008
INTERAGROMASH 2021

 Green Normalized GNDVI N−G Lu et al.
 Difference N+G
 Vegetation Index
 Modified MCARI RE Daughtry et al.
 [(RE − R) − 0,2 × (RE − G)] ×
 chlorophyll R
 absorption in
 reflectance ındex
 *where G is the reflection in the green spectrum; R - reflection in the red spectrum; RE - reflection
 in the red edge spectrum; N - near-infrared reflection.
 The Jenks method (Jenks natural breaks classification method) performed data clustering.
 This method created class boundaries in such a way as to minimize differences within a class
 and maximize differences between them.
 In the statistical analysis, Student's t-test was used to determine the presence of
 differences between the values of the vegetation indices of early and late maturing soybean
 varieties. The breeders verified the data on the early maturity of types based on observations
 of the growth and development of soybean crops.

 3 Result and Discussion

 3.1 Weather conditions
 The weather in May-September 2020 did not differ radically from the average for past years
 in Podvyaz. Temperature indicators were close to the average over the past ten years and
 differed by no more than 7°C. At the same time, in May-August, there were extremely low
 and unfavorable temperatures for the development and growth of soybean crops respectively:
 0.0 °C, + 8.0 °C, + 7.5 °C, + 6 °C. Precipitation fell unevenly, increasing rainy periods or
 periods of drought, for example, in June, precipitation was 168.51% (112.9 mm.) with an
 average of 67 mm (Figure 3).

 30.0 35.0 Average daily air temperature, °С
 25.0 30.0
 25.0
 20.0
 Precipitation, мм

 20.0
 15.0
 15.0
 10.0
 10.0
 5.0 5.0
 0.0 0.0

 Date

 Precipitation, мм Average daily air temperature, °С

 Fig. 3. Weather data for the period May - September 2020, Podvyaz, Ryazan region

 3.2 Data Processing

 5
E3S Web of Conferences 273, 01008 (2021) https://doi.org/10.1051/e3sconf/202127301008
INTERAGROMASH 2021

 The prevailing weather conditions in May and early June contributed to the slow growth
 of soybeans and low vegetation indices, for example, on June 11, 2020, the average index
 values were: NDVI – 0.395; NDRE – 0.147; GNDVI – 0.44 (Figure 4).

 1
 0.9
 0.8
 0.7
 0.6
 Index value

 0.5
 0.4
 0.3
 0.2
 0.1
 0
 6/11/2020 7/11/2020 8/11/2020
 Date

 NDVI NDRE CCCI GNDVI

 Fig. 4. Average values of vegetation indices NDVI, NDRE, CCCI, GNDVI in the main phases of
 soybean vegetation
 To advance the growth of crops on July 2, 2020, the additional fertilizing "Raikat
 Development" was introduced, which is supposed to improve the stage of development and
 growth of new plant tissues. In the period under review from 07/02/2020 to 07/17/2020 the
 average values of NDVI and GNDVI remained unchanged and were 0.887; 0.885 and 0.72;
 0.725 respectively (Figure 4). The NDVI and GNDVI are statistically equal at the Student t-
 test of 0.831424505 (the differences are considered significant at 5% significance level if tcr
 ≥ 2.179, and 1% if tcr ≥ 4.318, with n1 = 7; n2 = 7).
 The NDRE and CCCI indices were used to assess the photosynthetic activity of the
 vegetation cover and the saturation of leaves with nitrogen. The average values of the indices
 in the period from 07/02/2020 to 07/31/2020 indicated the presence of nitrogen starvation in
 crops 0.419; 0.186; 0.174 and 0.488; 0.226; 0.205 respectively. At the same time, feeding did
 not improve performance. Statistically, the differences in the mean values of these indices
 could be considered significant, with the Student's t-test equal to 2.394341416 (p = 0.05).
 After applying the second additional fertilizing "Atlante" on July 31, 2020, the average
 values of the NDRE and CCCI indices increased from 0.174 to 0.296 and from 0.205 to 0.399
 (Figure 4). "Atlante" was a liquid fertilizer containing phosphorus and potassium. The
 average values of the NDRE index were statistically different from the average values of the
 NDVI index, with the Student's t-test equal to 5.216421165 (p = 0.01).
 Among the other considered indices that reflected changes in the introduction of
 fertilizing were the indices: ClGreen (GCI) and CVI (Figure 5). They estimated the total
 chlorophyll content in the plant mass, while the CVI index was more sensitive to changes in
 the chlorophyll content in the leaves. The CVI index values showed an increase in the period
 from July 31 to August 14, 2020, from 2.941 to 3.264. Statistically, the mean values of these
 indices were equal, with the Student's t-test 1.140571105 (p = 0.05).

 6
E3S Web of Conferences 273, 01008 (2021) https://doi.org/10.1051/e3sconf/202127301008
INTERAGROMASH 2021

 6
 5
 Index value

 4
 3
 2
 1
 0
 6/11/2020 7/11/2020 8/11/2020 Date
 CVI MCARI Clgreen (GCI)

 Fig. 5. Average values of vegetation indices CVI, MCARI, ClGreen (GCI) in the main phases of
 soybean vegetation
 The average values curve of the MCARI index described the natural changes in the
 chlorophyll concentration in the leaves during the main phases of the growing season, without
 reflecting the application of fertilizing. Peak values obtained on July 17, 2020, for the
 MCARI index were: 3.564.
 The addition of "Atlante" did not affect the chlorophyll amount (ClGreen index (GCI)) in
 early maturing varieties - samples No. 1 and No. 9 in Figure 6 marked with red markers,
 because the crops were already in the ripening phase. While the index values in No. 3, 4, and
 8 increased during the seed filling phase (Figure 6 marked with blue markers). The values
 comparison between the spots of early and late-ripening varieties showed that the data of the
 first one was statistically different from the last one, with the Student's t-test equal to
 2.87521064 (p = 0.05). The values of the NDVI index also showed a sharp decrease in the
 phytomass index for samples 1 and 9, which breeders considered as early ripening varieties,
 in Figure 7 - marked with red markers.

 8

 6
 Index value

 4

 2

 0
 6/11/2020 7/11/2020 8/11/2020

 Date
 Average value Sampel No. 1 Sampel No. 2
 Sampel No. 3 Sampel No. 4 Sampel No. 5
 Sampel No. 6 Sampel No. 7 Sampel No. 8
 Sampel No. 9 Sampel No. 10

 Fig. 6. Values of the ClGreen (GCI) index in the main phases of the soybean growing season

 7
E3S Web of Conferences 273, 01008 (2021) https://doi.org/10.1051/e3sconf/202127301008
INTERAGROMASH 2021

 1

 0.8
 Index value

 0.6

 0.4

 0.2

 0
 6/11/2020 7/11/2020 8/11/2020 Date
 Average value Sampel No. 1 Sampel No. 2
 Sampel No. 3 Sampel No. 4 Sampel No. 5
 Sampel No. 6 Sampel No. 7 Sampel No. 8
 Sampel No. 9 Sampel No. 10

 Fig. 7. Values of the NDVI index in the main phases of the soybean growing season
 The difference between the samples values No. 1 and No. 10 was also shown by the
 GNDVI index analysis, which showed the degree of crops wilting and senescence (Figure 8).
 Comparison of these samples revealed that the data of No. 1 were statistically different from
 the data of No. 10 with the Student's t-test equal to 2.639182917 (p = 0.05).
 1

 0.8
 Index value

 0.6

 0.4

 0.2

 0
 6/11/2020 7/11/2020 8/11/2020 Date
 Average value Sampel No. 1 Sampel No. 2
 Sampel No. 3 Sampel No. 4 Sampel No. 5
 Sampel No. 6 Sampel No. 7 Sampel No. 8
 Sampel No. 9 Sampel No. 10

 Fig. 8. Values of the GNDVI index in the main phases of the soybean growing season
 The Table 2 displays the indices values that did not reflect the application of additional
 fertilizer, early ripening samples No. 1 and No. 9, as well as the late-ripening sample No. 10.
 The Table clearly shows a sharp decline in indicators for 14 days from July 31 to August 14,
 2020. The difference between the values was calculated using the formula [33]:
 1 − 2
 = × 100%, (1)
 1

 where D - the difference between the vegetation indices values in percent; VI1 - the value of the
 vegetation index as of July 31, 2020; VI2 - the value of the vegetation index as of August 14, 2020.

 8
E3S Web of Conferences 273, 01008 (2021) https://doi.org/10.1051/e3sconf/202127301008
INTERAGROMASH 2021

 Table 2. Vegetation indices (VI) values for samples No. 1, No. 9, and No. 10

 Sample 1 Sample 9 Sample 10

 VI
 95 85 85 99
 81 DA Difference DA 99 Difference DA DA Difference
 DAP P ,% P DAP ,% P P ,%
 NDVI 0.81 0.35 56.79 0.85 0.46 45.88 0.88 0.87 1.14
 Clgreen
 (GCI) 2.71 1.97 27.31 4.04 1.52 62.38 5.81 4.17 28.23
 GNDVI 0.57 0.5 12.28 0.69 0.53 23.19 0.74 0.72 2.70
 MCARI 2.3 0.05 97.83 2.64 0.26 90.15 2.37 1.65 30.38
 For early maturing varieties samples, there was a tendency to change the values of indices
 (NDVI, Clgreen (GCI), GNDVI, MCARI) in the ripening phase. The vegetation index
 MCARI showed the largest changes. The values of the NDVI index approached the minimum
 for the vegetation cover, and the difference in values reached 56.79%. Changes in the indices’
 values of the late-ripening sample were insignificant, so for NDVI and GNDVI - less than
 5%, the indices with a bigger difference (Clgreen (GCI) and MCARI) still had high values
 of chlorophyll content in plants.
 Based on the obtained data, custom index formulas were derived. These indices had a
 statistical difference between the values of the early and late maturing samples.
 ClGreen (GCI) and GNDVI formulas showing only their minimum values:
 NIR 0 NIR
 ClGreen (GCI) = (Green − 1) + (0; (Green − 1) − 2), (2)

 NIR−Green 0 NIR−Green
 GNDVI = NIR+Green + (0; NIR+Green − 0.4), (3)

 The values of 2 and 0.4 were taken as the average values of the ClGreen (GCI) and
 GNDVI indices of soybean crops with identified early readiness for harvest.
 The vegetation maps ClGreen (GCI)min (Figure 9 a) and GNDVImin (Figure 9 b) showed
 crops with only the minimum amount of chlorophyll as of 08/14/2020, including samples
 No. 1 and No. 9 of early maturing soybean varieties. ClGreen (GCI)min and GNDVImin
 indices took minimum values. The maximum value of the ClGreen (GCI)min index was 2,
 GNDVImin - 0.4.

 9
E3S Web of Conferences 273, 01008 (2021) https://doi.org/10.1051/e3sconf/202127301008
INTERAGROMASH 2021

 Fig. 9. Vegetation maps of crops ready for harvest a) ClGreen (GCI)min; b) GNDVImin

 4 Conclusions
 When studying the change in the chlorophyll content in the soybean leaves, seven broadband
 vegetation indices NDVI, NDRE, ClGreen (GCI), CCCI, CVI, GNDVI, MCARI were used.
 Each of these indices reacted differently to changes in the plant condition during the growing
 season. The alterations of the vegetation phases, weather conditions, and the application of
 additional fertilizer influenced the changes in the plant content. Unstable weather conditions
 contributed to an increase in the duration of the growing season. For early ripening varieties,
 the growing season was 112 days (sowing on May 8 and harvesting on August 27), which
 was longer than the ripening time of early ripening varieties typical for growing in the region
 under consideration. For example, the early ripening variety of soybean Kasatka matured in
 76-85 days (according to the Register of the State Sorting Commission of the Russian
 Federation https://reestr.gossortrf.ru/sorts/9908136/).
 Analysis of the average values of the considered indices indicates that when analyzing
 changes in the chlorophyll content in soybean crops, it is necessary to use a complex of
 several broadband vegetation indices for a comprehensive assessment of the plant state.
 NDVI for evaluating the general plant condition, CCCI and NDRE for recording crops

 10
E3S Web of Conferences 273, 01008 (2021) https://doi.org/10.1051/e3sconf/202127301008
INTERAGROMASH 2021

 nitrogen starvation, ClGreen (GCI), CVI or MCARI for assessing chlorophyll content in
 plant leaves, GNDVI for assessing wilting processes of plants.
 Regular crop monitoring helped to assess the early crops' readiness for harvesting. The
 MCARI index showed a rapid drop in the chlorophyll content in soybean leaves. The
 observed change in combination with a significant decrease in the NDVI values, ClGreen
 (GCI), GNDVI indices testified to the early readiness of crops for harvesting.
 The statistical difference between the indices of early and late maturing samples (p=0.05)
 contributed to the development of custom formulas ClGreen (GCI)min and GNDVImin.
 These equations were calculated to reflect only crops with the minimum chlorophyll content
 in the leaves. The use of the obtained formulas is advisable to determine the soybean crops
 early readiness for harvesting during the ripening phase, for early ripening varieties 7-10 days
 before the expected minimum maturity date.

 References
 1. Y. Zhang, Y. Li, R. Wang, L. Xu, M. Li et al., Frontiers in Plant Science 11, 1244 (2020)
 doi:10.3389/fpls.2020.01244
 2. N.B. Claypool, J.H. Lieth, Scientia Horticulturae 268, 109371 (2020)
 doi:10.1016/j.scienta.2020.109371
 3. M. Yuan, J.C. Burjel, J. Isermann, N.J. Goeser and C.M. Pittelkow, Journal of Soil and
 Water Conservation 74(4), 350-359 (2019) doi:10.2489/jswc.74.4.350
 4. L.G.T. Crusiol, M.R. Nanni, R.H. Furlanetto, R.N.R. Sibaldelli, E. Cezar et al.,
 International Journal of Remote Sensing 41(9), 3243-3265 (2020)
 doi:10.1080/01431161.2019.1673914
 5. Y.A. Yan, L. Deng, X.L. Liu and L. Zhu, Remote Sensing 11(23), 2753 (2019)
 doi:10.3390/rs11232753
 6. X. Zhang, J. Zhao, G. Yang, J. Liu, J. Cao at el., Remote Sensing 11(23), 2752 (2019)
 doi:10.3390/rs11232752
 7. D. Li, J.M. Chen, X. Zhang, Y. Yan, J. Zhu et al., Remote Sensing of Environment 248,
 111985 (2020) doi:10.1016/j.rse.2020.111985
 8. H.C. Bazame, F.A.C. Pinto, D.S. Queiroz, D.M. De Queiroz and D. Althoff, Tropical
 Grasslands-Forrajes Tropicales 8(2), 60-71 (2020) doi:10.17138/TGFT(8)60-71
 9. A.B. Tekin, M. Fornale, Turkish Journal of Agriculture and Forestry 43(3), 288-298
 (2019) doi:10.3906/tar-1806-1
 10. L. Zhao, Y. Shi, B. Liu, C. Hovis, Y. Duan at el., Remote Sensing 11(24), 3012 (2019)
 doi:10.3390/rs11243012
 11. R.L. Davis II, J.K. Greene, F. Dou, Y.-K. Jo, T.M. Chappell, Agronomy 10(5), 633
 (2020) doi:10.3390/agronomy10050633
 12. A.A. Artyushin, R.K. Kurbanov, L.A. Marchenko and O.M. Zakharova, Electrical
 technologies and electrical equipment in the agro-industrial complex 4(37), 36-43 (in
 Russian with an abstract in English) (2019)
 13. R.K. Kurbanov, N.I. Zakharova and O.M. Gayduk, Electrical technologies and electrical
 equipment in the agro-industrial complex 3(40), 87-94 (in Russian with an abstract in
 English) (2020) doi:10.22314/2658-4859-2020-67-3-87-94
 14. D.J. Mulla, Biosystems Engineering SI 114(4), 358-371 (2013)
 doi:10.1016/j.biosystemseng.2012.08.009

 11
E3S Web of Conferences 273, 01008 (2021) https://doi.org/10.1051/e3sconf/202127301008
INTERAGROMASH 2021

 15. M. Yang, M.A. Hassan, K. Xu, C. Zheng, A. Rasheed et al., Frontiers in Plant Science
 11, 927 (2020) doi:10.3389/fpls.2020.00927
 16. J.R. Xue, B.F. Su, Journal of Sensors, 1353691 (2017) doi:10.1155/2017/1353691
 17. N. Lu, W.H. Wang, Q.F. Zhang, D. Li, X. Yao et al., Frontiers in Plant Science 10, 1601
 (2019) doi:10.3389/fpls.2019.01601
 18. T. Ahamed, L. Tian, Y. Zhang, K.C. Ting, Biomass & Bioenergy 35(7), 2455-2469
 (2011) doi:10.1016/j.biombioe.2011.02.028
 19. T. Merrick, M.L.S.P. Jorge, T.S.F. Silva, S. Pau, J. Rausch et al., International Journal
 of Remote Sensing 41(17), 6755-6782 (2020) doi:10.1080/01431161.2020.1750731
 20. P.D. Liu, R.H. Shi and W. Gao, Earth Science Informatics 11(1), 147-156 (2018)
 doi:10.1007/s12145-017-0319-1
 21. S. Liu, H.Y. Yu, M.C. Chen, Z.J. Piao, T. Yu et al., Spectroscopy and Spectral Analysis
 40(5), 1575-1580 (2020) doi:10.3964/j.issn.1000-0593(2020)05-1575-06
 22. J. Yue, H. Feng, Q. Tian, C. Zhou, Plant Methods 16, 104 (2020) doi:10.1186/s13007-
 020-00643-z
 23. B. Boiarskii, H. Hasegawa, Journal of Mechanics of Continua and Mathematical
 Sciences SI 4, 20-29 (2019) doi:10.26782/jmcms.spl.4/2019.11.00003
 24. M. Yuan, J.C. Burjel, J. Isermann, N.J. Goeser and C.M. Pittelkow, Journal of Soil and
 Water Conservation 74(4), 350-359 (2019) doi:10.2489/jswc.74.4.350
 25. J. Zhou, J. Zhou, H. Ye, Md. Ali, H. Nguyen et al., Computers and Electronics In
 Agriculture, 175, 105576 (2020) doi:10.1016/j.compag.2020.105576
 26. J. Zhou, D. Yungbluth, C.N. Vong, A. Scaboo and J. Zhou, Remote Sensing, 11(18),
 2075 (2019) doi:10.3390/rs11182075
 27. E.V. Tyutereva, V.A. Dmitrieva and O.V. Voitsekhovskaja, Agricultural Biology, 52(5),
 843-855 (2017) doi:10.15389/agrobiology.2017.5.843eng
 28. I. Borra-Serrano, T. De Swaef, P. Quataert, J. Aper, A. Saleem et al., Remote Sensing
 12(10), 1644 (2020) [doi:10.3390/rs12101644].
 29. M. Maimaitijiang, A. Ghulam, P. Sidike, S. Hartling, M. Maimaitiyiming et al., ISPRS
 Journal of Photogrammetry and Remote Sensing 134(43), 58 (2017)
 doi:10.1016/j.isprsjprs.2017.10.011
 30. M. Maimaitijiang, V. Sagan, P. Sidike, S. Hartling, F. Esposito et al., Remote Sensing
 of Environment 237, 111599 (2019) doi:10.1016/j.rse.2019.111599
 31. P. Ranđelović, V. Đorđević, S. Milić, S. Balešević-Tubić, K. Petrović, et al., Agronomy
 10(8), 1108 (2020) doi:10.3390/agronomy10081108
 32. I.G. Smirnov, R.K. Kurbanov, M.A. Litvinov, O.M. Zakharova, N.I. Zakharova et al.,
 RU 2 728 846 C1 (2020)
 33. S. Dutta, S.K. Singh, S. Panigrahy, Journal of the Indian Society of Remote Sensing
 42(2), 353–361 (2014) doı:10.1007/s12524-013-0325-9

 12
You can also read