Keller Group plc Half year results 2019 - 29 July 2019 - keller.com
←
→
Page content transcription
If your browser does not render page correctly, please read the page content below
Keller Group plc
Half year results 2019
29 July 2019

                     keller.com
Cautionary statements

This document contains certain ‘forward looking statements’ with         For a more detailed description of these risks, uncertainties and
respect to Keller’s financial condition, results of operations and       other factors, please see the Risk Management approach and
business and certain of Keller’s plans and objectives with respect       Principal Risks section of the Strategic Report.
to these items.                                                          All written or verbal forward looking statements, made in this
Forward looking statements are sometimes, but not always,                document or made subsequently, which are attributable to Keller or
identified by their use of a date in the future or such words as         any other member of the group or persons acting on their behalf
‘anticipates’, ‘aims’, ‘due’, ‘could’, ‘may’, ‘should’, ‘expects’,       are expressly qualified in their entirety by the factors referred to
‘believes’, ‘intends’, ‘plans’, ‘potential’, ‘reasonably possible’,      above. Keller does not intend to update these forward looking
‘targets’, ‘goal’ or ‘estimates’. By their very nature forward-looking   statements.
statements are inherently unpredictable, speculative and involve         Nothing in this document should be regarded as a profits forecast.
risk and uncertainty because they relate to events and depend on
circumstances that will occur in the future.                             This document is not an offer to sell, exchange or transfer any
                                                                         securities of Keller Group plc or any of its subsidiaries and is not
There are a number of factors that could cause actual results and        soliciting an offer to purchase, exchange or transfer such securities
developments to differ materially from those expressed or implied        in any jurisdiction. Securities may not be offered, sold or
by these forward-looking statements. These factors include, but          transferred in the United States absent registration or an applicable
are not limited to, changes in the economies and markets in which        exemption from the registration requirements of the US Securities
the group operates; changes in the regulatory and competition            Act of 1933 (as amended).
frameworks in which the group operates; the impact of legal or
other proceedings against or which affect the group; and changes
in interest and exchange rates.

                                                                                                                                              2
Agenda

   Summary

   Financial results

   Business update

   Outlook

   Questions and answers
Summary
                         Underlying      Underlying
                         operating       operating    Underlying
Revenue                  profit          margin       EPS             Order book       Dividend

£1,092m                  £37.5m          3.4%         28.5p           £1bn             12.6p
Up 2%                    Down 24%        Down 1.2%    Down 30%        No change         Up 5%
(Down 2% CC)             (Down 29% CC)                (Down 36% CC)

• First half results in line with expectations driven by an increased momentum in the second
  quarter offsetting a weak start to the year
• Year-on-year profit decrease primarily driven by completion of two large EMEA projects in 2018
• Net debt decreased year-on-year by £33.5m to £333.5m - represents 2.1x net debt/EBITDA (on
  a covenant and IAS 17 basis)
• Restructuring programme started in 2018 has progressed well
• Reorganisation of North American business, effective January 2020, expected to drive material
  revenue growth in the medium term
• Full year expectations unchanged with stronger second half anticipated

CC = Constant currency

                                                                                                   4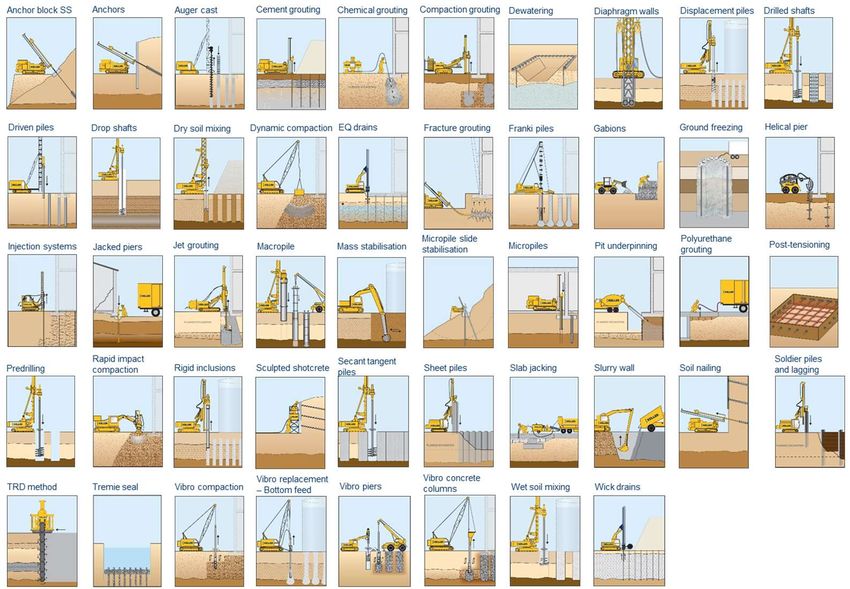
Summary of management actions

Area       Issue / opportunity           Actions

ASEAN      • Tough markets and poor      • New business unit leadership
             project performance –
             significant loss in 2018    • Comprehensive restructuring
                                         • Exit of product lines (heavy
                                           foundations)
                                         • A focus on ground improvement
                                         • Returned to profit in H1

Waterway   • Difficult market            • Waterway restructuring extended
             conditions and poor           and business will cease operations
             project performance           from October 2019
           • No material
             improvement in quality of
             contract awards

                                                                                5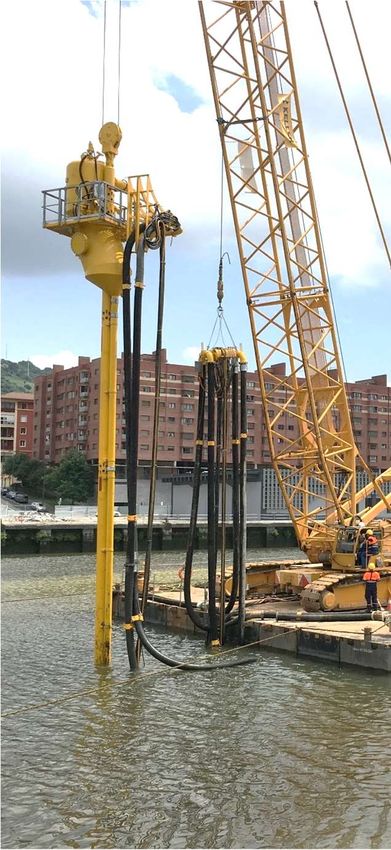
Area            Issue / opportunity          Actions

Brazil          • Still tough markets        • Capacity reduction in 2018
Franki Africa                                • Further cost actions potentially
                                               required in H2 2019

Suncoast        • Steel cost increases and   • Pricing increases now passed
                  margin compression in        through and margin restored
                  2018

Large project   • Successful completion      • Steady underlying improvement
pipeline          of two large EMEA            in EMEA core business
                  projects in 2018
                                             • Active engagement globally on
                                               prospects in 2020+

North           • Potential to combine       • Reorganising foundation
American          capabilities, strengthen     businesses to operate as one
foundation        market position and          Keller in each local market,
businesses        provide platform for         offering all products and
                  further growth               services, effective January 2020

                                                                                  6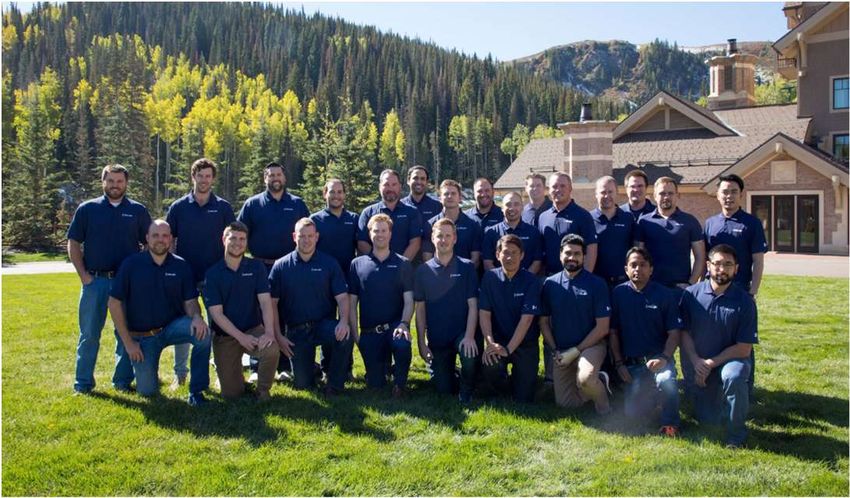
Financial
results
Summary income statement

                                                                                                         H1 20192                                                                                         H1 2018
                                                      Underlying                 Effect of             Underlying                 Non-                      Total                Underlying                Non-                         Total
£m                                                   (IAS 17 basis)              IFRS 161            (IFRS 16 basis)            underlying            (IFRS 16 basis)          (IAS 17 basis)            underlying              (IAS 17 basis)

Revenue                                                 1,091.7                        -                 1,091.7                       -                 1,091.7                  1,075.1                           -              1,075.1
Operating costs                                        (1,054.3)                     0.8                (1,053.5)                   (7.4)               (1,060.9)                (1,026.0)                       (0.5)            (1,026.5)
Amortisation of acquired
                                                              -                        -                       -                    (1.7)                   (1.7)                           -                    (5.8)                 (5.8)
intangibles
Other operating income                                        -                        -                       -                     3.3                     3.3                            -                       -                    -
Share of post-tax profits from
                                                            0.1                        -                     0.1                       -                     0.1                            -                       -                    -
JVs
Operating profit                                           37.5                      0.8                    38.3                    (5.8)                   32.5                     49.1                        (6.3)                 42.8
Operating profit margin (%)                               3.4%                         -                   3.5%                        -                    3.0%                    4.6%                            -                  4.0%
Net finance costs                                         (8.6)                     (2.2)                 (10.8)                       -                   (10.8)                   (6.9)                           -                  (6.9)
Profit/(loss) before tax                                   28.9                     (1.4)                   27.5                    (5.8)                   21.7                     42.2                        (6.3)                 35.9
Taxation                                                  (8.1)                      0.4                   (7.7)                   (10.2)                  (17.9)                  (11.8)                         1.2                  (10.6)
Profit/(loss) for the period                               20.8                     (1.0)                   19.8                   (16.0)                    3.8                     30.4                        (5.1)                 25.3
Diluted earnings per share (p)                             28.5                                             27.1                                             4.8                     40.7                                              33.7
Interim dividend per share (p)                                                                                                                              12.6                                                                       12.0

1 The group adopted IFRS 16 on 1 January 2019 using the modified retrospective method of adoption. Under this method, the standard is applied retrospectively with the cumulative effect of initially applying the standard recognised at the date
of adoption. As such, comparative information has not been restated.
2 For the first time, the half year results have been subject to review by the group’s external auditors

                                                                                                                                                                                                                                   8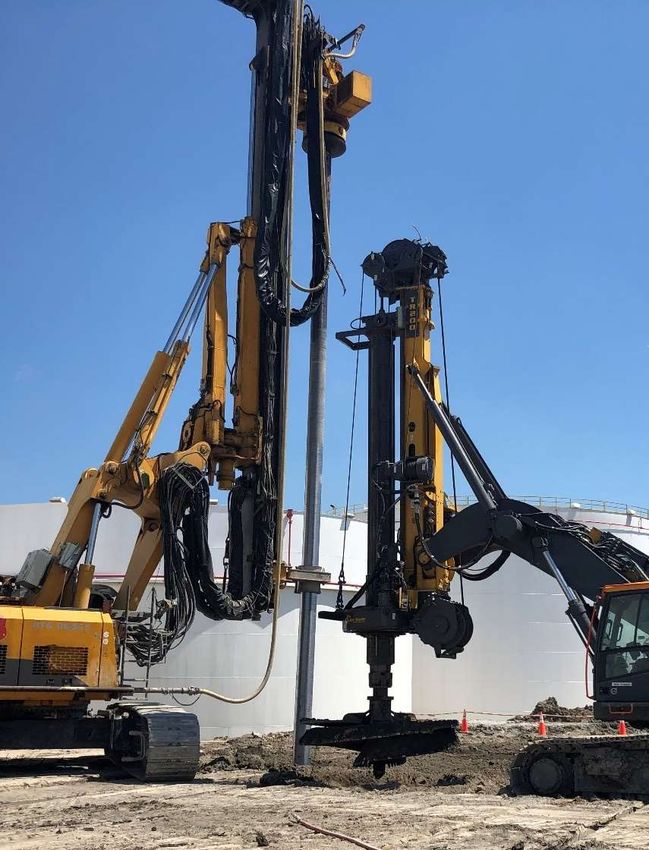
Summary income statement - Underlying
Revenue
Organic -5%
H1 20192 Moretrench +3%
Underlying Effect of Underlying Non- Total Constant currency -2%
£m (IAS 17 basis) IFRS 161 (IFRS 16 basis) underlying (IFRS 16 basis) FX +4%
Total +2%
Revenue 1,091.7 - 1,091.7 - 1,091.7
Operating costs (1,054.3) 0.8 (1,053.5) (7.4) (1,060.9) Operating profit
Amortisation of acquired Organic -36%
- - - (1.7) (1.7) Moretrench +7%
intangibles
Constant currency -29%
Other operating income - - - 3.3 3.3
FX +5%
Share of post-tax profits from Total -24%
0.1 - 0.1 - 0.1
JVs
Net financing costs
Operating profit 37.5 0.8 38.3 (5.8) 32.5
Increase of £1.7m due to increases in the
Operating profit margin (%) 3.4% - 3.5% - 3.0% average level of borrowings, margin and
base rates, compounded by FX headwinds.
Net finance costs (8.6) (2.2) (10.8) - (10.8)
Profit/(loss) before tax 28.9 (1.4) 27.5 (5.8) 21.7
Taxation
Taxation (8.1) 0.4 (7.7) (10.2) (17.9) Effective tax rate for 2019 & 2018 28%
Profit/(loss) for the period 20.8 (1.0) 19.8 (16.0) 3.8
Dividend
Diluted earnings per share(p) 28.5 27.1 4.8 Board recommendation 12.6p
Full year dividend per share(p) 12.6 Growth of 5%
Earnings cover 2.3x
1The group adopted IFRS 16 on 1 January 2019 using the modified retrospective method of adoption. Under this method, the standard is applied retrospectively with the cumulative effect of initially applying the standard recognised at the
date of adoption. As such, comparative information has not been restated.
2For the first time, the half year results have been subject to review by the group’s external auditors
9
Underlying operating profit bridge
       H1 2018 to H1 2019
65.0                                                   EMEA           APAC
                       North America                                                  Central items
                       Down £1.5m                      Down £10.4m    Down £2.2m      Down £1.0m
60.0
                                4.0    (2.3)
                                               (6.4)
55.0                    3.2

                 3.5
50.0                                                   (11.3)
       49.1
45.0
                                                                       3.7    (5.9)
                                                                0.9
40.0                                                                                  (1.0)             0.8

                                                                                               37.5           38.3
35.0

30.0
        H1                                                                                     H1              H1
       2018                                                                                   2019            2019
       (IAS 17                                                                                (IAS 17         (IFRS 16
        basis)                                                                                 basis)           basis)

                                                                                                                10
Summary income statement – IFRS 16
H1 20192 IFRS 16 Operating costs
Depreciation charge on
Underlying Effect of Non-
Underlying Total right-of-use assets (11.9)
£m (IAS 17
IFRS 161 (IFRS 16 basis) underlying (IFRS 16 basis)
basis) Operating lease expense 12.7
0.8
Revenue 1,091.7 - 1,091.7 - 1,091.7
Operating costs (1,054.3) 0.8 (1,053.5) (7.4) (1,060.9)
Net finance costs
Amortisation of acquired Lease liability interest expense
- - - (1.7) (1.7)
intangibles
Other operating income - - - 3.3 3.3
Taxation
Share of post-tax profits from Effective tax rate 28%
0.1 - 0.1 - 0.1
JVs
Operating profit 37.5 0.8 38.3 (5.8) 32.5
Balance sheet
Operating profit margin (%) 3.4% - 3.5% - 3.0% Opening balance take on:
Net finance costs (8.6) (2.2) (10.8) - (10.8) Right-of-use assets 86.3
Lease liabilities (87.1)
Profit/(loss) before tax 28.9 (1.4) 27.5 (5.8) 21.7
Taxation (8.1) 0.4 (7.7) (10.2) (17.9) Closing balance H1 2019:
Right-of-use assets 84.4
Profit/(loss) for the period 20.8 (1.0) 19.8 (16.0) 3.8
Lease liabilities (87.6)
Diluted earnings per share (p) 28.5 27.1 4.8
Full year dividend per share (p) 12.6
1The group adopted IFRS 16 on 1 January 2019 using the modified retrospective method of adoption. Under this method, the standard is applied retrospectively with the cumulative effect of initially applying the standard recognised at the date
of adoption. As such, comparative information has not been restated.
2For the first time, the half year results have been subject to review by the group’s external auditors
11Summary income statement – Non underlying
H1 20192 Non underlying operating costs
Underlying Waterway restructuring charge (11.0)
Effect of Underlying Non- Total
£m (IAS 17
IFRS 161 (IFRS 16 basis) underlying (IFRS 16 basis)
ASEAN restructuring provision release 4.9
basis)
Other (0.8)
Revenue 1,091.7 - 1,091.7 - 1,091.7 Net restructuring charge (6.9)
Acquisition costs (0.5)
Operating costs (1,054.3) 0.8 (1,053.5) (7.4) (1,060.9)
Amortisation of acquired Total (7.4)
- - - (1.7) (1.7)
intangibles
Other operating income - - - 3.3 3.3 Amortisation of acquired intangibles
Moretrench (0.7)
Share of post-tax profits from Austral (0.8)
0.1 - 0.1 - 0.1
JVs
Sivenmark (0.2)
Operating profit 37.5 0.8 38.3 (5.8) 32.5 Total (1.7)
Operating profit margin (%) 3.4% - 3.5% - 3.0% Other operating income
Net finance costs (8.6) (2.2) (10.8) - (10.8) Proceeds from contract dispute
settlement 3.3
Profit/(loss) before tax 28.9 (1.4) 27.5 (5.8) 21.7
Statutory profit
Taxation (8.1) 0.4 (7.7) (10.2) (17.9)
Underlying profit (IAS 17 basis) 20.8
Profit/(loss) for the period 20.8 (1.0) 19.8 (16.0) 3.8 IFRS 16 impact (1.0)
Diluted earnings per share (p) 28.5 27.1 4.8 Non-underlying items (16.0)
Statutory profit 3.8
Full year dividend per share (p) 12.6
1 The group adopted IFRS 16 on 1 January 2019 using the modified retrospective method of adoption. Under this method, the standard is applied retrospectively with the cumulative effect of
initially applying the standard recognised at the date of adoption. As such, comparative information has not been restated.
2 For the first time, the half year results have been subject to review by the group’s external auditors
12Cash flow
H1 2019 Depreciation/Capex
£m H1 2018
(IAS 17 basis)
Capex/Depreciation 73%
Underlying operating profit 37.5 49.1
Fleet renewal programme complete
Depreciation and amortisation 34.7 34.4
Underlying EBITDA 72.2 83.5
Working capital
Non-cash items 0.6 1.3
Compared to H2 2018
Share of post-tax results of joint ventures (0.1) - Volume 11
(Increase)/decrease in working capital (66.3) (73.1) Performance (77)
Outflows from provisions and retirement benefit Working capital cash flow (66)
(3.3) (4.3)
liabilities
Net capital expenditure (25.3) (38.9)
Compared to H1 2018
Sale of other non-current assets 1.5 3.3
Volume (4)
Operating cash flow (20.7) (28.2) Performance 5
Adjusted operating cash flow to adjusted operating Movement in working capital 1
(55)% (57)%
profit
Net interest paid (8.7) (6.7)
Cash tax
Cash tax paid (3.5) (9.2)
Reduction in tax cash due to Caspian tax
Free cash flow (32.9) (44.1) payment in H1 2018 and US tax refund in H1
Dividends paid to shareholders (17.2) (17.6) 2019
Acquisitions - (62.3)
Non-underlying items 8.9 (0.5)
Free cash flow
Foreign exchange movements (6.1) (13.0)
Seasonal outflow improved on prior year
Movement in net debt (47.3) (137.5) despite lower operating profit
Opening net debt (286.2) (229.5)
Closing net debt - bank covenant definition (333.5) (367.0)
Leverage ratio - bank covenant definition 2.1x 2.1x
Closing net debt - IFRS16 basis (419.6) (367.0)
Leverage ratio - IFRS 16 2.5x -
13Balance sheet – IFRS 16 impact
FY 2018 Tangible fixed assets
£m H1 2019 H1 2018
(Audited) Opening 422.0
Right-of-use assets 84.4
Intangibles 153.3 153.4 187.6
Capex 26.8
Disposals/transfers (1.0)
Managed assets Depreciation (34.4)
Impairment (6.9)
Tangible fixed assets 488.0 422.0 429.4 Other/FX (2.9)
Debtors and inventory 759.6 691.2 771.8 Closing 488.0
Other non-current assets 44.3 53.0 60.3
Net debt
Total managed assets 1,291.9 1,166.2 1,261.5 Net debt (IAS 17 basis) 333.5
Lease liabilities 86.1
Total net debt 419.6
Trade payables, provisions, tax
(591.7) (588.1) (598.7)
and other
853.5 731.5 850.4
Funded by:
Net debt 419.6 286.2 367.0
Shareholders’ funds 433.9 445.3 483.4
Total 853.5 731.5 850.4
14Net debt profile (£m) 2018 2019
367 379 365 367 371
352 347 359 355
328 343 336 339 334
323
268 287
258
Jan Feb Mar Apr May Jun Jul Aug Sep Oct Nov Dec
• Term debt and committed facilities comprise $125m of US private placements maturing 2021 to 2024 and £375m
multi-currency credit facility expiring 2023
• Group is operating well within all covenant limits
− Net debt to EBITDA ratio at year end was 2.1x, well within limit of 3.0x
− Recognising equity capital market sentiment to UK construction market, Board reduced leverage guidance from
1.5x-2.0x to 1.0x-1.5x
− Covenants protected from effect of IFRS 16 ‘Leases’
• At 30 June, the group had undrawn borrowing facilities of £175.5m
• Average month end debt was £334.3m and minimum headroom on banking facility was £95.7m (cash balance at that
time was £64.0m)
• Uncommitted borrowing facilities totalled £61.1m of which £9.1m was utilised
• No material discounting or factoring in place and low incidence of prepayments
• On a constant currency basis net debt decreased by 11% from 30 June 2018
15Financial modelling considerations
2018 2019 Status
Trading/profit
NA Moretrench acquisition £9.2m Small annualisation effect Annualisation = £3.2m
NA Suncoast pricing £(7.1)m YoY Substantial recovery expected H1 = £4.0m
EMEA large projects £(29.1)m YoY £(16.0)m YoY H1 = (£11.3)m
APAC recovery £(18.0)m loss Return to profit H2 Unchanged
Operating profit Reduction Recovery Unchanged
Operating profit phasing H1 bias Normal H2 bias Unchanged
Interest £(16.1)m US rates up, debt down Unchanged
Tax rate 28% 28% +/- 1% Some upward pressure
Cash/debt
Net capex £77.1m < Depreciation Unchanged
Working capital Flat despite growth = Flat Unchanged
Acquisitions Moretrench No material acquisitions Unchanged
Leverage guidance 1.5-2.0x 1.0-1.5x Unchanged
16Phasing H1 vs H2 – Historical patterns
Revenue split H1 vs H2 Operating profit split H1 vs H2
56% 55% 100%
54%
53% 53% 78%
52% 52% 52% 52% 80% 68% 72%
52% 51% 63% 64% 63%
53% 61% 60%
60% 49%
47% 45%
48% 49%
48% 48% 48% 48% 40% 55%
51%
47% 40%
46% 47% 37% 39% 36% 37%
44% 20%
45% 32% 28%
22%
40% 0%
2009 2010 2011 2012 2013 2014 2015 2016 2017 2018 2009 2010 2011 2012 2013 2014 2015 2016 2017 2018
H1 H2 H1 H2
H1 average: 48% H2 average: 52% H1 average: 38% H2 average: 62%
Operating profit margin %
10.0%
Drivers of H2 performance
8.1%
8.0% 7.1%
6.2%
7.0%
6.4% 6.0% • Strong order book
6.0% 7.7% 5.2% 5.0%
3.7% 4.1% • Sustain strong momentum of Q2
4.0% 5.0% performance in North America
4.4% 4.5% 4.2% 4.4% 4.6%
2.0%
2.8%
2.2% • Specific contract wins in Australia
0.0% 1.2%
2009 2010 2011 2012 2013 2014 2015 2016 2017 2018 • Continued success in implementing
H1 H2 restructuring programme
H1 average: 4.1% H2 average: 5.9%
The phasing in 2018 is materially impacted by the benefit of EMEA projects in H1 and the burden of the restructuring in APAC in H2
17Business update
Safety performance

• Accident Frequency Rate is 30% lower than a                        • 50% reduction in working
  year ago and 70% lower than five years ago                           platform incidents in 2019 as we
• 0.16 compared to US industry norm of 0.6*                            embed a new global standard

Accident Frequency Rate (AFR)
Per 100,000 hours

   1.2

             0.61

                       0.39       0.35   0.34
                                                0.23   0.19   0.16
                                                              H1
   2012     2013       2014       2015   2016   2017   2018   2019

 *US Bureau of Labor Statistics

                                                                                                      19
Healthy order book in excess of £1bn
Geographic mix Order book (£m)
(Full order book)
1200
North America 1100
£607m +8% 1000
900 EMEA large
EMEA projects ASEAN reset
800
£267m +3 % 700
APAC 600
£156m -36% 500
400
2012 2013 2014 2015 2016 2017 2018 H1 2019
20Building on our excellent customer reputation
Complex hill stabilisation, Wyoming, US
1 Removal of 40,000 yards of earth and
construction of horizontal drains to prevent
landslides bordering a local school.
2 Washington DC Wharf redevelopment, US
Jet grouting; displacement, soldier and sheet
piles; rigid inclusions and dewatering by 3
Hayward Baker, Case and Moretrench. 2
1
3 Hafenparkquartier, Frankfurt, Germany 4
Excavation of a 15,000m2 construction pit in
an area subject to heavy bombardment during 5
WWII – an unexploded bomb led to
evacuation of everyone within the area.
4 East Port Said development Phase 2, Egypt
6
Another 27,500km of prefabricated vertical
drains to the 82,500km already installed which
together would run 2.7 times around the world.
NESTE expansion project, Singapore
5 Following successful work by Keller in 2008,
foundations for further plant expansion with 150
people on site at the peak of the work.
West Gate Tunnel, Melbourne, Australia
6 Piling works for 6km eight-lane elevated 7,000 projects Average size
roadway including 3,500 precast piles. per year £325k
21North America
Operating review
£m H1 2019 H1 2018 Constant
£m £m currency
Revenue 611.0 534.3 7%
Underlying operating profit 32.4 31.7 -4%
Underlying operating margin 5.3% 5.9% n/a
Order book* 607.1 564.1 8%
* Comparative order book stated at constant currency
• Increased revenue driven by Moretrench acquisition
• Margin decline driven by adverse weather, related inefficiencies,
non-recurring emergency recovery and data centre work
• Foundation businesses had a disappointing first half,
particularly in the first quarter
• Moretrench acquisition continues to perform well
• Margin improvement at Suncoast with customer pricing
recovering adverse material cost inflation in 2018
• Marginal improvement in Canada but still not at full potential
• US construction market remains stable
• Strong order book +8% YoY Aston Martin Residences
Miami, United States
22North American reorganisation
• Integrating all foundation businesses into one unified
company, and rebranding to Keller
• Seven geographically based business units plus
specialty services
• Suncoast and Moretrench Industrial will stay as separate
businesses and retain their brands
• Effective 1 January, 2020 – announced well in advance to
ensure smooth transition
Benefits
• Easier for customers to work with us with one company in
each local market offering all products and services
• More standardised and efficient organisation
Financial benefit / cost
• Project cost between £2.5 and £4.0m through 2019
and 2020
• Medium term cost and efficiency benefit between £4.5
and £6.0m and strengthening of market share
• We expect material revenue growth in the medium term
23EMEA
Operating review
£m H1 2019 H1 2018 Constant
£m £m currency
Revenue 342.4 324.7 5%
Underlying operating profit 10.6 19.7 -50%
Underlying operating margin 3.1% 6.1% n/a
Order book* 267.3 258.3 3%
* Comparative order book stated at constant currency
• Increased revenue
• Decline in profitability due to non-repeat of two highly profitable
projects in first half of 2018
− Excluding these, revenue was up 11% and profit up 4% on
constant currency basis
• South East Europe continues to perform strongly
• Germany also busy through 2019
• Despite tough market backdrop, UK performing reasonably well
• Poland and Middle East quiet
• South Africa and Brazil continue to face tough market conditions S Alpha Dive
San Ignacio Bridge
Bilbao, Spain
24HS2
Early works involvement
Section C2/3
• Engaged with Professional Services
Agreements on the Central Sections (C1
and C2/3)
• Awarded advance trials on C1 for ALIGN
• Tendering for main works
− C1 JV with Intrafor
− C2/3 JV with Bauer
− South and Central instrumentation and Section C1
monitoring JVs
• HS2 scheme value £1bn+ over three years
for UK geotechnical contracting industry
• No significant revenue in our current order
book but upside potential for 2020
25APAC Sun Metals Corporation
zinc refinery
Operating review Queensland, Australia
£m H1 2019 H1 2018 Constant
£m £m currency
Revenue 138.3 216.1 -35%
Underlying operating profit (2.6) (0.4) n/a
Underlying operating margin -1.9% -0.2% n/a
Order book* 156.4 243.9 -36%
* Comparative order book stated at constant currency
• Revenue decline reflecting market softness in Australia and our
actions to reduce capacity
• Good performance by ASEAN
• Weak first half in Australia due to delays in mining projects,
federal election impacting contract awards and no improvement
in Waterway order book
• Tendering activity in Australia stronger and second half
expected to return to more normal levels
• Confident APAC will return to profitability in the second half
26Progress in ASEAN
• 2018 decision to exit Heavy
Foundations (bored piling, driven
piling and diaphragm walls) in
Singapore and Malaysia
• Successful execution of this
managed exit is nearing
completion
Business returned to profit in first half
Effective restructuring has resulted in
lower than expected costs
A number of high quality contract wins
totalling more than £40m
27Waterway to
cease operations
• Many years of delivering important
high-quality marine infrastructure
along the east coast of Australia
• Marine market dynamics have
changed significantly in recent years
• Despite best efforts to trade through
the challenges, not able to achieve
success
• With no material improvement in H1 loss of £4m
award of quality contracts have
taken decision to cease operations Restructuring charge of £11m: largely
from October 2019 non-cash
28Outlook
Strategic priorities
for 2019
                                                   Tank farm,
What we said in March still stands:              Galveston, US

•   Continue connecting and professionalising
    the group

•   Deliver group-wide business improvement
    projects

•   Continue to focus on under-performing
    areas of portfolio

•   Strengthen risk management and improve
    project management rigour

•   Operational cash focus and capex restraint

•   No material acquisitions in 2019

                                                    30
Outlook
We reiterate full year guidance
• Market fundamentals remain healthy
• Quality order book in excess of £1bn
Drivers
• Maintaining Q2 momentum in North America
• Specific project wins in Australia
• Continuing to deliver on restructuring programme
Leads to expectations for the full year
• Revenue broadly flat
• Increase in profit driven by margin improvement
• Strong cash generation
• Net debt/EBITDA (IAS 17 basis) to reduce to 1.0-1.5x
31Questions and answers
Keller
overview
Keller today

 Every day millions of people around the world
 live, work and play on ground prepared by Keller
                                                     3 divisions
 Our purpose      Our vision        Our values      22 business units
 To help create   To be the world   Integrity
 infrastructure   leader in
 that improves    geotechnical      Collaboration
                                                        190
 the world’s      solutions         Excellence          branches
 communities

                                                        2.2bn
                                                        revenue pa

                                                        10,000
                                                        employees

                                                        7,000
                                                        contracts pa

                                                                       34
Keller investment case
We operate in the large The specialist geotechnical
and growing global contracting sub-sector has
construction and higher margins and
infrastructure market favourable market trends
We are the number 1 business worldwide given our size, profitability
1
and capabilities (wide product portfolio, branch network, equipment
fleet, technical leadership and operational track record)
We still have many areas We have a stable business
for improvement and a model with a long-term
strategy to deliver the track record of growth
benefits and value creation
35Geotechnical market size and share
Market size Share of addressable market
Global geotechnical
contracting market
$54bn
Geotechnical
contracting markets
where Keller operates today
$26bn
Keller
today
$2.85bn*
Non-addressable market mainly Keller Trevi (contracting)
China, Korea, Japan and Russia Soletanche/Bachy/Menard General contractor-owned
Source: IHS Global Insight, Keller 2018 data Country/regional
Bauer (contracting) specific, smaller players
* 1 USD = 0.78 GBP as of 31 Dec 2018
36Specialist versus
generalist business model
Project lifespan
Keller
General contractor
Ground engineering General construction
• Early stage, short contracts • Longer, larger projects
• Specialist design capability • Some design and build
• Low complexity of supply chain • Integration of multiple suppliers and subcontractors
• Lower cyclicality through global • Generally national players
geographic and sector diversity • Low asset base
• Directly owned plant and • Low to negative working capital
equipment
• Positive working capital
37Market demand trends
play to our strengths
More than half the world’s population lives
01 Urbanisation and more large-
scale development projects
in cities, and 65m people will be
added to the urban population every year
Increasing land shortage,
02 driving a need to use more
brownfield and marginal land
More than 450,000 brownfields
in the US alone
World will need to spend $57 trillion on
03 Infrastructure renewal and
expansion eg road, rail, power
infrastructure by 2030 to keep up
with global GDP growth
Increasing demand from More demand for early involvement,
04 customers for complete
solutions not just products
partnership and collaboration
throughout the construction supply chain
05 Increasing technical complexity
Rising number of governments and clients are
mandating the use of BIM for their projects
Sources: OECD - Regions and Cities at a Glance 2018; US Environmental Protection Agency 2018; The McKinsey Global Institute 2018
38North American markets stable
No sign of a downturn in US market US construction output value (US$ million)
with confidence remaining strong
2018-2022 CAGR = 2.2%
Increasingly difficult to hire skilled
employees
Residential construction down year on
year but highly regional, with Texas
and Florida remaining buoyant
Good opportunities in industrial sector
Canadian construction output value (CA$ million)
Infrastructure generally strong with a
2018-2022 CAGR = 1.8%
number of large road and rail projects
Canada remains regionally more
mixed
Source: Dodge Q2 2019, Global Insight Oct 2018
39Growth in other main markets
German construction output value (€ million)
German market
• Steady market with growth of 1-2% 2018-2022 CAGR = 1.9%
per annum
• Still strong internal demand
• Good opportunities in general
market and larger infrastructure
projects
Australian market
Australian construction output value (AUD million)
• Mining activity returning as iron ore
prices healthy (in maintenance 2018-2022 CAGR = 3.9%
spending)
• East Coast infrastructure projects
still in planning
• Defence infrastructure spending
increasing (marine naval facilities)
Source: Global Insight 2018, data measured at year end
40Factors to consider in
geotechnical engineering
Site conditions Requirements Loading Constraints
• Performance conditions • Neighbouring
• Sand, silt, clay,
rock, organic (allowable • Spread, low buildings
settlements) intensity
• Loose, soft, stiff, • Noise, vibration
hard, porous • Schedule • Slender, high
• Utilities, other
intensity, sensitive
• Deep, shallow, • Cost underground
cavities • Seismic loading structures
and liquefaction
• Water levels
(high, low) • Dynamic, wind
41Full product range
Right
combination
of products
leads to
optimal
solutions for
the soil
conditions
and structure
type
42Value engineering
Employ around 50% of our projects are
1,500 geotechnical ‘design and build’ where
engineers worldwide; value engineering can
over 200 focused reduce cost by up to
purely on design 40% and save time
Maiden Lane, New York
57-storey tower, lower Manhattan
Congested site where conventional Drilled shafts
solution unbuildable
Keller provided solution using
jet grouting which saved $5m
(31%) and three months
Jet grouting
43The equipment advantage
Large fleet and design and
manufacture capability
Keller total fleet
• Total equipment fleet is 1,300 rigs
− The largest equipment fleet in
the world
Keller manufactured fleet
• We manufacture specialist
equipment in Germany
• Available only to Keller
• 20% of our projects are
executed using Keller equipment
generating a revenue over £300m
44The people advantage
Enabling high performance by investing in our people
Project Manager Academy
• 150 project managers trained globally
− Significant improvement in gross
margin already being evidenced
Field Supervisor Academy
• 120 supervisors have attended
− Improving both performance and
retention of key population
Business Development Academy
• 170 leaders have attended global
sales training across NA and APAC
− EMEA implementing from 2020
45Medium term financial targets
Revenue Profitability
• Organic growth ahead of market • ROCE in excess of 20%
− 2012-2017: Keller 4.9% − Last five years: 13-20.5%
− Relevant construction markets 1.3%
Dividend Gearing
• Continued progressive growth through • Headline net debt between
the cycle (rebased upwards in 2017) 1.0x and 1.5x EBITDA
46Capital allocation priorities
01 02 (on hold in 2019) 03
Profitable Bolt-on Ordinary
organic acquisitions dividends
growth meeting Keller’s At a level allowing
dividend growth
opportunities investment through the cycle
criteria
04 Return capital to shareholders
• Only where the balance sheet allows
• Unlikely to be considered if could take net debt to >1.5x EBITDA
− After taking account of other investment opportunities/cash
requirements
• Any short term return of capital likely to be share buy-back
47Financial performance since listing in 1994
Revenue (£m) Underlying operating profit (£m)
2,400 140
2,000 120
100
1,600 CAGR = 11% CAGR = 10%
80
1,200
60
800
40
400 20
0 0
Dividend per share (pence) Share price (pence)
40 1,250
35
1,000
30
25 CAGR = 9% CAGR = 7%
750
20
15 500
10
250
5
0 0
TSR of 9.6% CAGR vs 7.0% FTSE-all-share CAGR*
* As at 9/07/19
48Strategic progress
Growing our • Moretrench integration continues to contribute
product range and positively
entering new markets, • Global product teams proactive on
organically and by knowledge and technology transfer
acquisition
• Reorganisation of foundation businesses in
Building strong, North America
customer-focussed • Global instrumentation and monitoring
businesses businesses re-branded as GEO-Instruments
• Restructuring in ASEAN, Brazil and South
Africa
• Rollout of Winning Business workshops
• Rollout of common internet site platform, look
and feel
First cutter project
in Canada
• Good functional momentum adding value
Leveraging the especially on Procurement and IT
scale and expertise • Common operating system for group wide
of the group policies, standards and procedures
• Continued progress with BIP$ across
all divisions
49Strategic progress
Enhancing our • Clear product strategies developed
engineering and • Equipment innovation
operational • Investment in Lean leadership and 5S to
capabilities reduce variation and waste
• New digital app to simplify site
administration will launch by end 2019
• Keller Data Acquisition programme to make
project performance data accessible globally
in real-time
• Continuous year-on-year improvement in
Investing in our Accident Frequency Rate
people • Bolstered leadership at Board, Executive
Committee, group and business unit levels
• Improved governance regime
• Tangible financial results being evidenced
from Project Manager Academy and Field
Leadership training
50Keller fact sheet
• Established 1860, now number 1 geotechnical specialist • Contracts over £5m revenue make up around 2% of the
contractor globally number of contracts, but account for c25% of total
• Revenue by division: 56% North America, 31% EMEA, revenue
13% APAC (only c3% of business in UK) • Typical contract value range £25k to £10m
• Revenue by sector: 33% Infrastructure/Public buildings, • On average c25 sites mobilised every day, across the
23% Residential, 23% Power/Industrial, 17% world
Office/Commercial, Marine 4% • We typically spend a few weeks on site (smaller
• Room to grow: projects) with up to two years for large projects
• Global geotechnical contracting market - $54bn • We have over 50 techniques or products, with 10 major
• Geotechnical contracting markets where Keller product groups
operates - $26bn (excludes China, Japan, Korea and • Product split: 37% Heavy foundations, 23% Ground
Russia) improvement, 18% Earth retention, 12% Grouting, 9%
• Keller today c$2.85bn – a 5% global market share Post-tension systems, 1% Instrumentation and
and a 10% share of the markets in which we operate monitoring
• Operate in 40 countries, across six continents • Industry trends are favourable to Keller:
Urbanisation/large scale development,
• Three divisions, 22 business units, 190 branches Brownfield/marginal land, Infrastructure renewal,
• About 10,000 employees, of which around 1,500 are Complete Solutions, Technical complexity
geotechnical engineers, >200 focused purely on design • We are the leading consolidator in the industry - over 20
• 1,300 rigs globally acquisitions since 2000
• About 20% of our capex is spent on our own equipment, • Strong safety focus, AFRInvestor Relations contact
Caroline Crampton
Interim Head of Investor Relations
+44 20 7616 7575
caroline.crampton@keller.com
52You can also read