Label-free plasmon-enhanced Raman detection of biomarkers in neurodegenerative disorders - Paolo MATTEINI
←
→
Page content transcription
If your browser does not render page correctly, please read the page content below
Label-free plasmon-enhanced Raman
           detection of biomarkers in
         neurodegenerative disorders
                                             Paolo MATTEINI

            Institute of Applied Physics “Nello Carrara” (IFAC)
                      Italian National Research Council (CNR)
                                              Florence – ITALY

                                            p.matteini@ifac.cnr.it
bnlab.ifac.cnr.it/index.php/research- topics/
                                     NanoBioSpectroscopy Lab.                      nano-biospectroscopy

                                                 @ bnlab IFAC-CNR
                                                                                       Noble metal NPs
                                                                                       synthesis
                                                                                       (AgNWs, AgNCs,
              TERS spectroscopy
                                                                                       AuNSs, others)
              of biomolecules
                                                                                       Nanoscale 2015,
               Small 2018,
                                                                                       ChemNanoMat 2019
               Materials 2019

                                                                                Fabrication of 2D/3D
            Fiber-enhanced                                                      substrates for optical
            Raman spectroscopy                                                  sensing (NPs, hybrid
                                                                                graphene coated)
            J Biomed Opt 2020 (in press)
                                                                               Beilst J Nanotechnol 2016
                                                                               RSC Advances 2020

Theoretical simulations (FEM, MD)
                                            Optical detection in
Nanoscale 2015,                             neurological diseases
ACS Appl Mater Interfaces 2016
                                                                             Development of optical methods for biomedical
                                           Chem Comm 2019, Ann Neurol 2019
                                                                             analysis in physiological environments, in cells
                                                                             ACS Nano 2017, Sci Rep 2018
Outline
• Alzheimer’s disease (AD): current diagnostic strategies and their limits
• Amyloid Oligomers for early diagnosis of the Alzheimer’s disease
• Raman & Plasmon Enhanced spectroscopy
• Identification and Characterization of Amyloid Oligomers
• Conclusions

•   Progressive neurodegeneration of the brain
•   Cognitive disabilities, memory loss, challenges with daily tasks
•   AD: up to 70% of all dementia cases
•   5th major cause of death by the next 20 years
•   Early diagnosis is vital since there are already medications in the maket
    that may slow progress of disease. So earlier could allow to maintain a
    better level of brain activity
Alternative diagnostic strategies of AD
The most widely accepted and validated predictors of AD are:
1. Brain atrophy by Magnetic Resonance Imaging (MRI)
2. Amyloid β deposition by Positron Emission Tomography (PET)
3. Molecular biomarker detection in Cerebrospinal Fluid (CSF)
                                                                PET
                                                                      PET

                           Healthy
                           patient
Alternative diagnostic strategies of AD
The most widely accepted and validated predictors of AD are:
1. Brain atrophy by Magnetic Resonance Imaging (MRI)
2. Amyloid β deposition by Positron Emission Tomography (PET)
3. Molecular biomarker detection in Cerebrospinal Fluid (CSF)
                                                                      PET
                                                                            PET

                           Healthy
                           patient

                                              CSF in direct contact
                                              with the brain and
                                              reflects molecular
                                              changes occurring
                                              inside the brain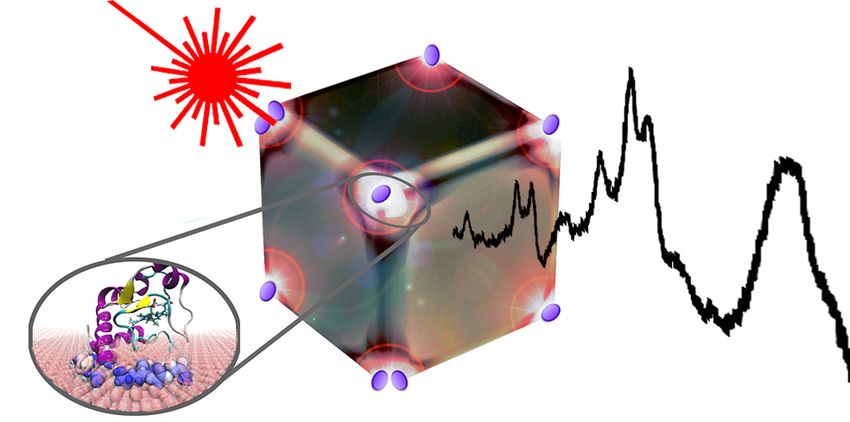
Aβ oligomers for early Alzheimer’s disease diagnosis
• Misfolding of β-amyloid peptide and its oligomerization are early molecular events that lead to AD.

• Recent evidences suggest that trace-amounts of misfolded Aβ might
  be found in peripheral tissues, like CSF, of patients in the very early
  stages of AD.

                       early
                     diagnosis         SPEEDY Project:
                                       Recognition of Aβ oligomers in CSF
 β-amyloid                             and other biofluids by optical
 detection                             techniques (2018/2021)
and analysis
                       Alzheimer’s
                                      • IRCCS Foundation “Carlo Besta”
                                        Neurological Institute, Italy

                                      • Tel-Aviv University
         Optical detection
                                      • SME: 3D-nano
Raman & Plasmon Enhanced Raman Spectroscopy
Raman spectroscopy provide information on molecular vibrations (fingerprint of molecules)
exploiting the inelastic scattered light by the sample under a Visible (or NIR) laser irradiation.

                                                   • Molecular identification, structural changes, folding
                                                     states, etc.
                                                   • Raman effect is very weak: only a small portion
                                                     (0.000001%) of the scattered radiation has
                                                     frequencies different from that of the incident beam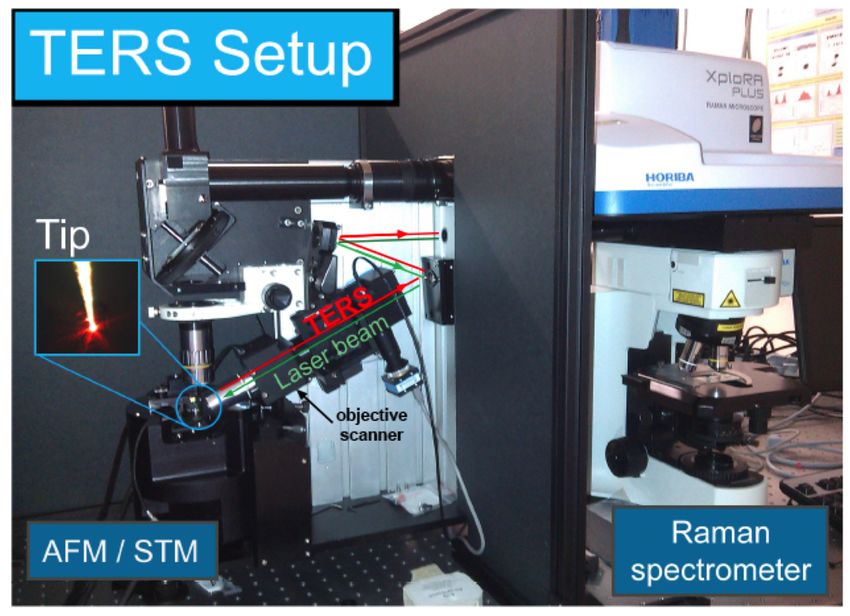
                                                                                                      hot-spot
 •   Plasmonic NPs can increase the Raman signal up to 1014 once molecules are              Ag Nanocube
     adsorbed on their surface (typical enhancement = 104- 107 )
 Upon light excitation of a metal
 nanoparticle the electric field of the
 radiation drives the conduction electrons
 into collective oscillations on the particle
 surface (Localized Surface Plasmon
 Resonances- LSPRs)                                                                             80%EF

     Enhancement of the local electromagnetic field (MAX at the
     nanoparticle surface and rapidly falls off with distance)
AgNWs@PTFE membranes for SERS detection of Aβ
                                                                                         5µm
                                                                                       80 nm

                                                                                               Optical image of a
                                                                                               SERS chip showing
                                                                                               2 mm in diameter
                                                                                               SERS-active spots

                                                                                2 mm

                                             Aβ42 species
               micropipette                                         SERS

AgNWs          drop (5µL)
spot
               PTFE membrane

        DEPOSITION             EVAPORATION                  ADSORPTION & SERS

  Banchelli M et al, ChemNanoMat. 2019, 5, 1036-43
AgNWs@PTFE membranes for SERS detection of Aβ
5µm
80 nm
Optical image of a
SERS chip showing
2 mm in diameter
SERS-active spots
2 mm
EF 106
air |E|/E0|MAX
= 35
• Effective interstitial SERS hotspots (10/µm2)
generated in the gaps between crossed AgNWs
Banchelli M et al, ChemNanoMat. 2019, 5, 1036-43AgNWs@PTFE membranes for SERS detection of Aβ
Amyloid β(1-42) Hexafluoroisopropanol Amyloid β(1-42) Ladiwala et al Biomarker detection at different
monomer NaOH, PBS days 0-4 toxic oligomers and J Biol Chem
287 24765
aggregation stages
non-toxic prefibrillar
aggregates (2012) • Rapid procedure
• Nice signals at 1x10⁻⁶M !
Tyr10 Amyloid β(1-42) 1x10⁻⁶M • Tracking amyloid conformation
λEX = 785 nm; 20 s X 20 points =
7 min X sample (+20 min sample
(and toxicity) by following 897,
Lys28, Lys16
preparation) 935, 1047,1460 cm-1 of Lys and
850,1605 cm-1 of Tyr
toxicity
++
Banchelli M et al, RSC Adv 2020, 10 21907AgNWs@PTFE membranes for SERS detection of Aβ
Amyloid β(1-42) Hexafluoroisopropanol Amyloid β(1-42) Ladiwala et al Biomarker detection at different
monomer NaOH, PBS days 0-4 toxic oligomers and J Biol Chem
287 24765
aggregation stages
non-toxic prefibrillar
aggregates (2012) • Rapid procedure
• Nice signals at 1x10⁻⁶M !
Amyloid β(1-42) 1x10⁻⁶M • Tracking amyloid conformation
λEX = 785 nm; 20 s X 20 points =
7 min X sample (+20 min sample
(and toxicity) by following 897,
preparation) 935, 1047,1460 cm-1 of Lys and
850,1605 cm-1 of Tyr
• Characteristic “toxic
fingerprint” for the 24h -
most neurotoxic species
• Neurotoxic stages can be
identified from a body fluid
sample and promptly
diagnosed?
• Preliminary screening of
potential/suspected AD
patients
Banchelli M et al, RSC Adv 2020, 10 21907Tip-Enhanced Raman Spectroscopy (TERS) discrimination of toxic vs non-
toxic amyloid species
• TERS combines scanning probe microscopy (SPM) with optical (Raman) spectroscopy,
conferring chemical specificity to SPM and nano-resolution to Raman
In TERS the enhancing substrate is
Horiba Xplora Plus Raman reduced to a single local 'hot spot' at the
micro-spectrometer
AIST NT – AFM equipped with end of a very sharp tip, which can be
STM module accurately positioned on the sample
Reflection Mode-Side
illumination surface by SPM
Excitation Wavelength
@638nm
Dr. P. Gucciardi -IPCF – CNR
Messina (Italy)
JPK NanoWizard Sense
Renishaw InVia RamanJPK NanoWizard Sense SPM
SPM
Spectrometer + Renishaw InVia Raman
Spectrometer
Transmission Mode-Bottom
Illumination
Excitation Wavelength
@632nm
Dr. P. Matteini -IFAC – CNR
Sesto Fiorentino (Italy)HypF-N as β-amyloid olig. Model
The N-terminal domain of the Escherichia coli protein HypF (HypF-N) is a small stably folded α/β protein
with 91-residues (10 kDa).
It forms toxic oligomers and/or amyloid-like fibrils similar to those associated with Alzheimer’s disease.
TOXIC OLIG – TYPE A
50 mM acetate buffer, 12% (v/v) trifluoroethanol (TFE)
2 mM DTT, pH 5.5
• 2 distinct types of stable oligomers
• Same polypeptide sequence
• Similar morphological properties
• Different abilities to cause cellular dysfunction
HypF-N
Monomer
(50 µM) NON-TOXIC OLIG - TYPE B
20 mM trifluoroacetic acid (TFA) 330 mM NaCl, pH 1.7
C. Capitini et al ChemComm 54 8637 (2018)TERS spectra
TERS spectra C. D’Andrea et al Small 14 1800890 (2018)
• High signal variations are consequential to the molecular complexity inspected at the
nanoscale
• An immediate discrimination between Type A and B is not trivial
• A post-processing data analysis is required (fitting curves + statistical analysis)
a) Type A – toxic oligomers b) Type B - non-toxic oligomers
Aromatic AA
Aromatic AA
Amide II
Amide II
Amide I
Amide I
Phe
Phe
His
His
500 cts 100 cts
/ cts
/ cts
Intensity (cts)
Intensity (cts)
TERS Intensity
TERSIntensity
TERS
TERS
800 1000 1200 1400 1600 1800 800 1000 1200 1400 1600 1800
Raman
RamanShift
Shift /(cm
cm) -1-1
Raman
Raman Shift / cm)
Shift (cm -1 -1
Samples prepared incubating a gold commercial substrate in the 1µM Oligs solution for 16h, then rinsing in water and drying in air.
TERS maps: 64 points, 200nm x 200nm, step 25nm - λexc = 638nm – Power 2.51mW – Time 1s - Grat 1200 gr/mmTERS spectra analysis
Spectra deconvolution through Lorentzian multi-peak fit
1000 1020 1040 1500 1550 1600 1650 1700
His +
Amide II
Amide I
Trp
Tyr
Phe
1000 1020 1040 1500 1550 1600 1650 1700
Raman Shift (cm-1) C. D’Andrea et al Small 14 1800890 (2018)TERS spectra analysis
Intensities were normalized to Phe mode at 1003 cm-1 to rule out local
fluctuations of the molecular density and EF of the sample.
I/I1003 Peaks Intensity ratio
9 Type A
Amide II + His
Type B
8 His
Amide I and Amide II modes intensities overlap
Trp
Trp
7 (≈ Phe)
Tyr + Phe
6
Amide II
Tyr
5 Histidine (His) and Aromatic Amino Acids (Trp,
Tyr) are ≈ 4 times more intense for type A
Phe
4
Phe
Amide I
(toxic) oligomers
3
2
Outer exposition of these AA on the surface of
1 type A oligomers where TERS tip can primarily
0 boost their Raman intensity
1000 1500 1550 1600 1650
• A peculiar superficial structuring of Type A could
Raman Shift / cm-1
justify its tendency to cause neuron dysfunction
Fluctuations of His and Trp are expected due to the heterocyclic moieties
and possible chemical interactions (charge transfer) with the gold tip
C. D’Andrea et al Small 14 1800890 (2018)Conclusions
SERS & TERS appear effective tools
for neurological disease research
SERS TERS
SERS
• SERS identification of AD biomarkers • TERS description of structural
• Simple procedure with minute amounts of characteristics of amyloids that can be
liquid sample connected with particular functional
• Low-cost SERS substrates are desirable in activities (e.g. high toxicity levels)
view of a clinical use • TERS can support pharmacological research
in identifying specific molecular targets
applied research
diagnosis fundamental research
therapyAcknowledgements
People: Projects:
NanoBioSpectroscopy group @ IFAC – CNR
Florence SPEEDY
Paolo Matteini - 1st Researcher (2019-21)
Marella De Angelis – Researcher Surface-enhanced Raman scattering with nanophotonic and biomedical
Cristiano D’Andrea - Researcher amplifying systems for an early diagnosis of Alzheimer’s disease pathology -
Martina Banchelli - Researcher ID221, UE/MIUR, EuroNanoMed3 H2020 (2019-2021)
Chiara Amicucci PhD student
Edoardo Farnesi PhD student SENSOGM(2018-21)
REGIONE TOSCANA
FONDO EUROPEO DI SVILUPPO REGIONALE UNIONE EUROPEA
Development of biophotonic sensors for the environmental detection of
Nanosoft lab @ IPCF – CNR Messina GMOs (Regione Toscana, POR-CREO 2014-2020)
Pietro G. Gucciardi, Onofrio Maragò
Antonino Foti DESWEAT (2019-21)
Dep. of Biochem., Exp. and Clinical Development of a cost effective wearable metal nanowire-based chip sensor
Sciences, Univ. of Florence for optical monitoring of metabolites in sweat –MAECI Joint Res Proj Korea-
Fabrizio Chiti Italy (2019-2021)
PRAMA (2020-23)
Proteomics, RAdiomics & Machine learning-integrated strategy for precision
medicine for Alzheimer’s (Regione Toscana, Bando Salute2018)
p.matteini@ifac.cnr.itYou can also read