Latitude. longitude. altitude - IR Solutions

Page created by Wallace Garner
 
CONTINUE READING
Latitude. longitude. altitude - IR Solutions
FEDEX ANNUAL REPORT 2016

                             FEDEX CORPORATION
                             ANNUAL REPORT 2016
                                                  latitude.
                                                  longitude.
                                                  altitude.

FEDEX CORPORATION
942 South Shady Grove Road
Memphis, Tennessee 38120
fedex.com
Latitude. longitude. altitude - IR Solutions
FedEx is flying higher.

FY16 once again

                                                  50+ 1.6                                                      9
showcased the                                    $                              $                                     %
successful strategy of
managing our portfolio                           BILLION                        BILLION PROFIT                  INCREASE IN FEDEX
                                                 FY16 REVENUE                   IMPROVEMENT                     GROUND PACKAGE
of services to achieve                                                          PLAN                            VOLUME
                                                 In FY16 FedEx
outstanding growth.                              Corporation revenue            FedEx Express                   Average daily volume,
                                                 exceeded $50 billion           achieved its profit             driven by growth in
                                                 for the first time.            improvement goal                e-commerce, grew
                                                                                outlined in FY13.               9 percent year over year.

                                                 ACQUISITIONS                   PRICING                         PAY FOR
                                                 FedEx acquired TNT
                                                                                LEADERSHIP                      PERFORMANCE
                                                 Express for €4.4 billion       Strategic actions include       Most team members
                                                 on schedule, and the           general rate increases,         earned higher variable
                                                 integration processes          higher pricing on larger        incentive compensation
                                                 are well underway at           packages and fuel               year over year.
                                                 GENCO and FedEx                surcharge adjustments.
                                                 CrossBorder (formerly
                                                 Bongo International).

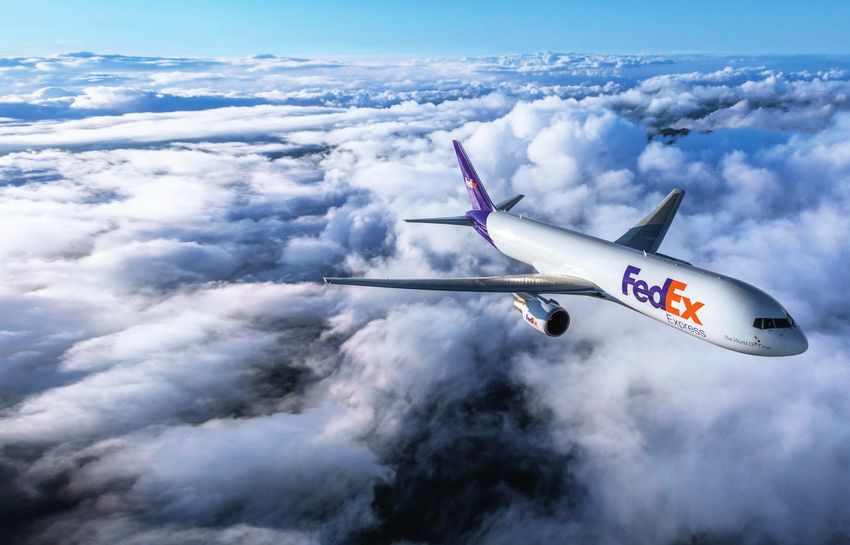
On the cover: Boeing 767-300 Freighters are more fuel-efficient with lower emissions and lower unit operating costs than the aircraft they
are replacing. Modernizing the FedEx Express fleet with these new aircraft is improving margins and adding flexibility to our domestic
and international operations.
Latitude. longitude. altitude - IR Solutions
LETTE R FRO M T H E C H A I R M A N

                                TO OUR SHAREOWNERS,
                                In FY16, FedEx reached new heights as one of the
                                world’s unique enterprises. Through disciplined strategy
                                and execution, our shareowners, team members and
                                customers benefited greatly from new solutions and
                                higher revenues and profits, despite an environment
                                of low economic growth.

Frederick W. Smith              > In FY13, we stated we would meet the FedEx
Chairman, President and CEO
                                 Express profit improvement goal ‑– to exit FY16 with
                                 an annual run rate of $1.6 billion in additional operating
                                 profit ‑– and we did it. Moreover, we believe FedEx
                                 Express profitability and productivity will continue
                                 to increase for years to come, assuming continued
                                 modest growth in the U.S. and global economies.

                                >W
                                  e announced we would acquire the Dutch delivery
                                 company TNT Express in the first half of calendar
                                 2016. We officially acquired the company on May 25.

MISSION                         >W
                                  e committed to continue improving FedEx
                                 Corporation’s margins, earnings per share, cash flows
FedEx Corporation will
                                 and returns over the long term. We successfully
produce superior financial       advanced each of these goals in FY16.
returns for its shareowners
by providing high value-added   To achieve our stated mission to produce superior
logistics, transportation and   financial returns for shareowners, we manage our
related business services       operating companies as a portfolio of solutions.
                                Customers as well as FedEx benefit: Ninety-six percent
through focused operating
                                of U.S. revenue is generated by customers using two
companies. Customer             or more of our transportation companies ‑– FedEx
requirements will be met in     Express, FedEx Ground and FedEx Freight. About
the highest quality manner      77 percent of U.S. revenue comes from customers
appropriate to each market      using all three transportation companies. Our customer
                                base is large and diverse by design. No single customer
segment served. FedEx will
                                represents more than 3 percent of our total revenue.
strive to develop mutually
rewarding relationships         Our investments are paying off, and we expect
with its employees, partners    positive financial momentum to continue into FY17.
and suppliers. Safety will      While we integrate our acquisitions, we’ll continue our
be the first consideration      successful investments in FedEx Express aircraft fleet
                                modernization and expand the capacity of the highly
in all operations. Corporate
                                automated FedEx Ground network. We expect these
activities will be conducted    major programs will have high returns, which are
to the highest ethical and      integral to expanding corporate margins. It is important
professional standards.         to stress that we manage our operating companies

                                                               MORE > fedex.com/AnnualReport2016            1
Latitude. longitude. altitude - IR Solutions
L ET T E R F ROM TH E C H A IR MAN

         collaboratively to achieve overall results for FedEx Corporation.
         This means we do not necessarily maximize the profitability
         of each FedEx unit every year. And because our operating
         companies compete collectively as a portfolio, we are often
         funding initiatives that may incur costs for an operating
         company in the near term for long-term benefit to the
         enterprise as a whole.

         From FY14 through FY16, FedEx returned more than
         $8.8 billion to shareowners through our repurchase of more
         than 63 million shares and increased dividends by at least
         25 percent annually. Our strong balance sheet, profit and cash
         flow performance gave us the flexibility to sustain stock
         repurchase programs while continuing to execute our strategic
         growth initiatives.

         TRANSFORMATIVE ACQUISITIONS
         The TNT Express acquisition broadens our global portfolio and
         gives FedEx a global competitive advantage that will deliver
         long-term shareowner value. As we integrate TNT Express, the
         density of its powerful pan-European surface transportation
         network will make our operations more productive and efficient.
         Combining TNT Express with our intra-European and interconti‑
         nental FedEx Express services lowers our costs to serve the
         market and puts us front and center to profit from the growth
         of European commerce.

         After acquiring TNT Express, we were able to hit the ground
         running thanks to our detailed integration planning process,
         and we’re confident we’ll successfully integrate TNT Express
         with FedEx Express. We expect TNT Express to be accretive to
         earnings in FY18. Longer term, we anticipate this acquisition will
         generate substantial improvements in revenue and earnings.

         We are already reaping the rewards of our acquisitions in FY15
         of GENCO, part of our FedEx Ground segment, and Bongo
         International, recently rebranded as FedEx CrossBorder, a unit
         of FedEx Trade Networks. Thanks to complementary FedEx
         and GENCO transport management logistics services, we’re
         successfully working with customers to cross-sell our
         capabilities, including GENCO’s unmatched expertise in returns.
         Retailers highly value this service, because reverse logistics
         costs for consumer goods average 8 percent of total sales.

2   MORE > fedex.com/AnnualReport2016
Latitude. longitude. altitude - IR Solutions
LETTE R FRO M T H E C H A I R M A N

                                                                                           TNT EXPRESS:
                                                                                           STRATEGIC
                                                                                           INTEGRATION
                                                                                           TNT Express is the largest acquisition
                                                                                           in FedEx history, and its benefits are
                                                                                           expected to be equally significant.
                                                                                           The addition will transform our global
                                                                                           portfolio of solutions, particularly in
                                                                                           Europe, substantially lower our cost
                                                                                           to serve our European markets by
                                                                                           increasing density in our pickup and
                                                                                           delivery operations and accelerate our
                                                                                           global growth.
                                                                                           To help us realize the value of the
                                                                                           transaction, we’re applying our
                                                                                           ACQUIRE process that we’ve refined
                                                                                           over many acquisitions. It’s a cross-
                                                                                           functional management system used
                                                                                           to complete a transaction, integrate
                                                                                           a new company and help us obtain
                                                                                           the financial results we intend. Today
                                                                                           more than 20 FedEx and TNT Express
                                                                                           functional and geographical teams
                                                                                           are working together to ensure a
                                                                                           smooth integration and long-term
                                                                                           strategic success.

                                                                                       €
                                                                                           6.9
                                                                                           BILLION: 2015 TNT EXPRESS
                                                                                           REVENUE
The TNT Express acquisition elevates FedEx in air export
market rankings.

                         FedEx                    UPS                    DHL
                  (with TNT Express)

United States               1                       2                      3
Canada                      1                       2                      3
Europe                      2                       3                      1
Asia Pacific                2                       3                      1
Latin America               2                       3                      1
Rankings based on CY2015 company-reported data. FedEx and UPS estimates reported
as shipper-based. DHL and TNT Express reported as payor-based. For U.S. air export,
shipper-based estimates were used. Regional estimates are made based on FedEx region
definitions.
Source: FedEx Market Development.

                                                                                                                                             3
Latitude. longitude. altitude - IR Solutions
L ET T E R F ROM TH E C H A IR MAN

         FedEx CrossBorder is expanding services to               Our dense, ubiquitous networks create fundamental
         merchants in China and Japan this year, enabling         scale and scope advantages that aren’t easily
         shoppers to purchase goods internationally through       replicated. Nearly every business and person on
         a seamless checkout and delivery process that takes      the planet can order an item online and have it
         the guesswork out of what the total landed cost          affordably transported and delivered door-to-door
         will be, including international duties and taxes.       by FedEx across borders within one or two business
                                                                  days, customs cleared. For e-commerce to continue
         OUTSTANDING TEAM MEMBERS                                 to grow rapidly, our efficient and reliable global
                                                                  transportation solutions are vital.
         The 2015 peak holiday season was historic by many
         measures, and our team members responded to the
                                                                  FedEx Express. Profit improvement initiatives have
         challenge by delivering our Purple Promise, which
                                                                  been successful, and we plan to continue increasing
         simply states: “I will make every FedEx experience
                                                                  margins. For example, every aircraft we replace with
         outstanding.” They handled record demand, delivering
                                                                  a new Boeing 767-300 Freighter adds millions of
         more than 25 million packages per day on multiple
                                                                  dollars annually to profits because the new planes
         days, more than double our average daily volume.
                                                                  use 30 percent less fuel, are more reliable and require
         Their stellar performance and close collaboration
                                                                  less maintenance expense than the older planes
         with our customers helped us achieve holiday season
                                                                  they replace.
         service levels that were among the highest ever,
         despite higher-than-expected volumes and difficult
                                                                  FedEx Ground. We’ve nearly tripled our ground
         weather in some locations.
                                                                  market share during the last two decades and
                                                                  continue to widen our competitive advantage by
         Thanks to our team members’ commitment to the
                                                                  investing in highly automated facilities that can quickly
         customers and communities we serve, we were
                                                                  process growing volumes of packages. To gain even
         proud to be once again recognized by FORTUNE
                                                                  more operational efficiencies and flexibility, we
         magazine as one of the world’s 10 most-admired
                                                                  combined our FedEx Ground and FedEx SmartPost
         companies and No. 1 in the delivery industry.
                                                                  networks and are introducing new routing technolo‑
                                                                  gies to make our deliveries more efficient, particularly
         SUPERIOR NETWORKS
                                                                  in residential areas.
         Our unrivaled transportation networks provide
         competitive advantages for our customers. FedEx          FedEx Freight. We’re enthusiastic about our efforts
         Express is the world’s largest express transportation    to extend our market-leading position by reshaping
         company, with an unmatched global flight system.         the LTL market, just like FedEx has done in both the
         FedEx Ground continues to increase market                express and ground segments. We are connecting
         share and is faster to more U.S. locations than its      customers with more convenient, parcel-like shipping
         competitors. FedEx Freight is the less-than-truckload    solutions, such as zone-based pricing and the recently
         (LTL) market leader with similar transit advantages in   introduced FedEx Freight box, a simplified way to ship
         its sector. FedEx Office provides unique digital print   LTL that increases security and shipment protection.
         and package services. Given these facts, we believe      To more accurately cost and price LTL shipments, we
         reports warning of possible near-term disruptions to     continue to expand our use of dimensional scanners.
         the package shipping industry by new local delivery
         business models to be fantastical, devoid of in-depth    FedEx Services. Yield management is a critical
         knowledge of large logistics systems and the markets     component of our financial success. We continue
         FedEx serves.                                            to sharpen our revenue management and pricing

4   MORE > fedex.com/AnnualReport2016
Latitude. longitude. altitude - IR Solutions
LETTE R FRO M T H E C H A I R M A N

    E-COMMERCE:
    INVESTING IN
    GROWTH
    The holiday season of 2015 made it
    clear that e-commerce has enabled
    a full-scale retail revolution.
    The value proposition, however,
    remains the same — the ability to order
    a product online and have it reliably
    delivered to the consumer. FedEx is one
    of only three enterprises that together
    deliver 95 percent of all e-commerce
    orders in the United States. We are
    at the center of e-commerce and one
    of the most profitable e-commerce
    companies in the world.

    It’s imperative that we continue
    investing for profitable growth by
    expanding our network capacity
    to match the predicted increase in
    e-commerce shipments. FedEx Ground
    invested $1.6 billion in FY16, including
    automated hubs in Tracy, California,
    and Ocala, Florida, and 19 additional
    automated stations. This will bring the
    number of automated hubs to 35 and
    the number of automated stations to
    68. These operations are designed to
    sort packages at a high rate, minimize
    handling and lower costs. Since
    2005, network enhancements have
    accelerated service by at least one day
    to more than 70 percent of the U.S.

$
    2.4
    TRILLION: ESTIMATED VALUE OF
    E-COMMERCE SALES WORLDWIDE
    BY 2018, A 26 PERCENT INCREASE
    FROM 2016

                                                      5
Latitude. longitude. altitude - IR Solutions
L ET T E R F ROM TH E C H A IR MAN

         science. Our world-class pricing group analyzes               In November 2015, we welcomed John C. Inglis,
         revenue data to better balance volume growth and              former Deputy Director of the National Security Agency,
         yield improvements. We’re currently evaluating and            to the FedEx Board of Directors. His cybersecurity
         executing multiple pricing initiatives to increase            and information technology expertise and significant
         margins and profits.                                          leadership experience will be very valuable to
                                                                       FedEx, particularly as a knowledgeable expert on
         We are just as focused on simplifying and modernizing         our Information Technology Oversight Committee.
         our information technology footprint, which lowers
         costs. As we do so, we spend less on infrastructure           FY16 was a year of significant accomplishments, and
         and upgrades. Equally important, these information            we plan to build on this success for many years to
         technology initiatives make FedEx more agile and flexible     come. By creating new solutions for our customers,
         in meeting customers’ needs.                                  we help them grow and prosper. We continue to
                                                                       advocate trade and economic policies that create
         FedEx Office is at the center of solutions designed to        opportunities for business while helping the communities
         handle large volumes of e-commerce shipments while            we serve flourish.
         making it easier for customers to pack, ship and pick
         up packages. Across the country, we’re also piloting          FedEx is committed to the highest standards of
         neighborhood third-party retail locations to supplement       regulatory and legal compliance, acting with integrity
         our convenience network.                                      in everything we do, everywhere we do business.
                                                                       Ethical conduct supports the reputation FedEx has
         ACCOUNTABLE SUSTAINABILITY                                    earned as one of the most admired brands in
                                                                       the world.
         Delivering is our business; doing it sustainably is our
         responsibility. We committed to increasing FedEx
                                                                       As we’ve demonstrated, we’ve done the things we
         Express vehicle fuel economy by 30 percent by 2020
                                                                       said we’d do. We predict a bright future for FedEx,
         from a 2005 baseline, and we surpassed our goal ahead
                                                                       and based on our record, we hope our customers,
         of schedule. In FY15, FedEx nearly doubled the number
                                                                       team members and shareowners have confidence
         of alternative fuel vehicles in our global fleet, including
                                                                       in our commitment to their success as well.
         approximately 1,900 hybrids, electric, compressed
         natural gas, propane auto gas and hydrogen vehicles.
         Please take time to review our Global Citizenship Report
         at csr.fedex.com. It outlines current goals and the
         progress we’ve made, plus our pledge to invest
                                                                       Frederick W. Smith
         $200 million in 200 communities worldwide by 2020.
                                                                       Chairman, President and CEO

6   MORE > fedex.com/AnnualReport2016
Latitude. longitude. altitude - IR Solutions
LETTE R FRO M T H E C H A I R M A N

    TRADE:
    REMOVING BARRIERS
    Free trade increases the world’s prosperity by
    opening markets, and it has been an American
    policy objective since 1934, when disastrous
    tariffs that shackled global commerce were
    overturned. History shows that trade made
    easy, affordable and fast begets more trade.
    At least 95 percent of the world’s consumers
    live outside the United States. More than
    3 billion people are connected to the internet,
    and the overall market for international
    door-to-door express shipping continues to
    increase, driven by e-commerce.
    Today’s remarkable transport systems and
    technologies will continue to improve and
    facilitate an even larger global economy as
    individual trade becomes almost frictionless.
    With virtually all of the world’s products at
    one’s fingertips, millions of items can be
    quickly found, ordered with a few clicks and
    delivered in one or two days to our doors
    from any point on the globe to any other.
    These factors and more have created a global
    trade market that exceeds $15 trillion per year.
    From less than $50 billion in trade 50 years
    ago, the U.S. now imports and exports about
    $4 trillion per year in goods and services.
    FedEx actively supports the policies and
    infrastructure that enable the global supply
    chain to operate as seamlessly as possible and
    works tirelessly to increase understanding of
    the profound benefits of free trade. By working
    together, we help businesses efficiently deliver
    the new products and services desired by
    consumers around the world and create jobs
    that lift our communities to higher standards
    of living.

15
$

    TRILLION: GLOBAL
    TRADE MARKET

                                                                                        7
L ET T E R F ROM TH E C H A IR MAN

                                     FUEL EFFICIENCY:
                                     ACCELERATING RESULTS
                                     Five years ahead of plan, FedEx Express
                                     surpassed its goal to boost vehicle fuel
                                     efficiency 30 percent by 2020 from a 2005
                                     baseline. When we set the goal, we knew
                                     that most of the technology we needed
                                     didn’t exist at the time. But we got the job
                                     done thanks to a well-defined strategy:
                                     Reduce, Replace, Revolutionize.

                                     > R
                                        EDUCE overall mileage by optimizing
                                       routes and assigning the right truck to
                                       the right route so that our 50,000-strong
                                       vehicle fleet travels the minimum miles
                                       needed to serve our customers.

                                     > REPLACE vehicles with more fuel-efficient
                                       models and maximize fuel economy
                                       by reprogramming vehicles to run at
                                       optimal levels for their weight and load.

                                     > R
                                        EVOLUTIONIZE the fleet by adopting
                                       new technologies such as electric
                                       vehicles, fuel cells, natural gas and
                                       hybrids. In major metropolitan areas,
                                       we’re moving toward electric vehicles.
                                       We’re also focusing on hydrogen fuel
                                       cells, which can help expand the zero-
                                       emission range for electric vehicles.

                                     Since starting the Reduce, Replace,
                                     Revolutionize program, we’ve saved more
                                     than 137 million gallons of fuel and avoided
                                     nearly 1.5 million metric tons of CO2e
                                     emissions. Go to csr.fedex.com for more
                                     about our sustainability goals and progress.

                                     137
                                     MILLION GALLONS OF
                                     FUEL SAVED SINCE 2008
FINANCIAL HIGHLIGHTS
                                                                                                                                                                                  Percent
(in millions, except earnings per share)                                                                                       2016(1)(2)                   2015(2)(3)            Change
Operating Results
  Revenues                                                                                                               $ 50,365                     $ 47,453                             6
  Operating income                                                                                                          3,077                        1,867                            65
  Operating margin                                                                                                             6.1%                         3.9%                         220bp
  Net income                                                                                                                1,820                        1,050                            73
  Diluted earnings per common share                                                                                          6.51                         3.65                            78
	Average common and common equivalent shares                                                                                 279                          287                            (3)
  Cash provided by operating activities                                                                                     5,708                        5,366                             6
  Capital expenditures                                                                                                      4,818                        4,347                            11

Financial Position
 Cash and cash equivalents                                                                                               $ 3,534                      $ 3,763                              (6)
 Total assets                                                                                                             46,064                        36,531                             26
 Long-term debt, including current portion                                                                                13,867                         7,268                             91
 Common stockholders’ investment                                                                                          13,784                        14,993                             (8)

       Comparison of Five-Year Cumulative Total Return*                                                        (1)	Results for 2016 include provisions related to independent contractor
                                                                                                                    litigation matters at FedEx Ground for $256 million, net of recognized
                                                                                                                    immaterial insurance recovery ($158 million, net of tax, or $0.57 per diluted
$200                                                                                                                share) and expenses related to the settlement of a U.S. Customs and Border
                                                                                                                    Protection notice of action in the amount of $69 million, net of recognized
$180                                                                                                                immaterial insurance recovery ($43 million, net of tax, or $0.15 per diluted
                                                                                                                    share). Total transaction, financing and integration planning expenses related
$160                                                                                                                to our TNT Express acquisition, as well as TNT Express’s immaterial financial
                                                                                                                    results from the time of acquisition, were $132 million ($125 million, net of
$140                                                                                                                tax, or $0.45 per diluted share) during 2016. In addition, 2016 results include
                                                                                                                    a $76 million ($0.27 per diluted share) favorable tax impact from an internal
$120                                                                                                                corporate restructuring to facilitate the integration of FedEx Express and
                                                                                                                    TNT Express.
$100                                                                                                           (2)	Results include mark-to-market losses of $1.5 billion ($946 million, net of
                                                                                                                    tax, or $3.39 per diluted share) in 2016 and $2.2 billion ($1.4 billion, net of
 $80                                                                                                                tax, or $4.81 per diluted share) in 2015.
                                                                                                               (3)	Results for 2015 include impairment and related charges of $276 million
       5/11               5/12               5/13                5/14               5/15                5/16        ($175 million, net of tax, or $0.61 per diluted share) resulting from the
                                                                                                                    decision to permanently retire and adjust the retirement schedule of certain
                                                                                                                    aircraft and related engines. Additionally, results for 2015 include a charge
               FedEx Corporation              S&P 500              Dow Jones Transportation Average                 of $197 million ($133 million, net of tax, or $0.46 per diluted share) in the
                                                                                                                    fourth quarter to increase the legal reserve associated with the settlement
       *$100 invested on 5/31/11 in stock or index, including reinvestment of dividends. Fiscal year               of a legal matter at FedEx Ground to the amount of the settlement.
         ended May 31.

                                                                                                                                                                                                      9
MANAGEMENT’S DISCUSSION AND ANALYSIS
OF RESULTS OF OPERATIONS AND FINANCIAL CONDITION

     OVERVIEW OF FINANCIAL SECTION                                               Our FedEx Services segment provides sales, marketing, information
                                                                                 technology, communications, customer service, technical support,
     The financial section of the FedEx Corporation (“FedEx”) Annual             billing and collection services, and certain back-office functions that
     Report (“Annual Report”) consists of the following Management’s             support our transportation segments. In addition, the FedEx Services
     Discussion and Analysis of Results of Operations and Financial              segment provides customers with retail access to FedEx Express
     Condition (“MD&A”), the Consolidated Financial Statements and the           and FedEx Ground shipping services through FedEx Office and Print
     notes to the Consolidated Financial Statements, and Other Financial         Services, Inc. (“FedEx Office”). See “Reportable Segments” for
     Information, all of which include information about our significant         further discussion.
     accounting policies and practices and the transactions that underlie        The key indicators necessary to understand our operating results
     our financial results. The following MD&A describes the principal           include:
     factors affecting the results of operations, liquidity, capital
     resources, contractual cash obligations and critical accounting             >	the overall customer demand for our various services based on
     estimates of FedEx. The discussion in the financial section should            macro-economic factors and the global economy;
     be read in conjunction with the other sections of this Annual Report,       >	the volumes of transportation services provided through our networks,
     particularly our detailed discussion of risk factors included in              primarily measured by our average daily volume and shipment
     this MD&A.                                                                    weight and size;
     Organization of Information                                                 >	the mix of services purchased by our customers;
     Our MD&A is composed of three major sections: Results of Operations,        >	the prices we obtain for our services, primarily measured by yield
     Financial Condition and Critical Accounting Estimates. These sections         (revenue per package or pound or revenue per hundredweight and
     include the following information:                                            shipment for LTL freight shipments);
     >	Results of operations includes an overview of our consolidated 2016      >	our ability to manage our cost structure (capital expenditures and
       results compared to 2015 results, and 2015 results compared to 2014         operating expenses) to match shifting volume levels; and
       results. This section also includes a discussion of key actions and
       events that impacted our results, as well as our outlook for 2017.        >	the timing and amount of fluctuations in fuel prices and our ability
                                                                                   to recover incremental fuel costs through our fuel surcharges.
     >	The overview is followed by a financial summary and analysis
       (including a discussion of both historical operating results and          Many of our operating expenses are directly impacted by revenue
       our outlook for 2017) for each of our transportation segments.            and volume levels. Accordingly, we expect these operating expenses
                                                                                 to fluctuate on a year-over-year basis consistent with changes in
     >	Our financial condition is reviewed through an analysis of key           revenues and volumes. Therefore, the discussion of operating expense
       elements of our liquidity, capital resources and contractual cash         captions focuses on the key drivers and trends impacting expenses
       obligations, including a discussion of our cash flows and our             other than changes in revenues and volumes. The line item “Other
       financial commitments.                                                    operating expenses” predominantly includes costs associated with
     >	Critical accounting estimates discusses those financial statement        outside service contracts (such as security, facility services and cargo
       elements that we believe are most important to understanding the          handling), insurance, legal reserves, professional fees and uniforms.
       material judgments and assumptions incorporated in our financial          Except as otherwise specified, references to years indicate our fiscal
       results.                                                                  year ended May 31, 2016 or ended May 31 of the year referenced and
     >	We conclude with a discussion of risks and uncertainties that may        comparisons are to the prior year. References to our transportation
       impact our financial condition and operating results.                     segments include, collectively, our FedEx Express group, including
                                                                                 the FedEx Express and TNT Express reportable segments, the FedEx
     Description of Business                                                     Ground segment and the FedEx Freight segment. Because TNT Express
     We provide a broad portfolio of transportation, e-commerce and              was acquired so late in 2016, its financial results are immaterial and
     business services through companies competing collectively, operating       are included in “Eliminations, corporate and other.” In 2017, TNT
     independently and managed collaboratively, under the respected              Express’s results will be disclosed as a reportable segment and
     FedEx brand. Our primary operating companies are Federal Express            combined with the FedEx Express reportable segment in a new
     Corporation (“FedEx Express”), the world’s largest express transportation   reporting structure referred to as the FedEx Express Group. This
     company; TNT Express B.V., formerly TNT Express N.V. (“TNT Express”),       reporting structure will continue throughout the integration of the
     an international express, small-package ground delivery and freight         TNT Express and FedEx Express businesses. Once these businesses
     transportation company that was acquired near the end of our 2016           are integrated, our segment reporting structure could change based
     fourth quarter; FedEx Ground Package System, Inc. (“FedEx Ground”),         on how we are operating, managing and assessing the performance
     a leading North American provider of small-package ground delivery          of the integrated businesses.
     services; and FedEx Freight, Inc. (“FedEx Freight”), a leading U.S.
     provider of less-than-truckload (“LTL”) freight services. These
     companies represent our major service lines and, along with FedEx
     Corporate Services, Inc. (“FedEx Services”), form the core of our
     reportable segments.
10
MANAGEMENT’S DISCUSSION AND ANALYSIS

RESULTS OF OPERATIONS
Consolidated Results
The following table compares summary operating results (dollars in millions, except per share amounts) for the years ended May 31.
                                                                                                                                                                  Percent Change
                                                                                          2016(4)                  2015                     2014              2016/2015      2015/2014
Consolidated revenues                                                                   $ 50,365                $ 47,453                 $ 45,567                     6               4
FedEx Express Segment operating income(1)                                                  2,519                   1,584                    1,428                    59              11
FedEx Ground Segment operating income                                                      2,276                   2,172                    2,021                     5               7
FedEx Freight Segment operating income                                                       426                     484                      351                   (12)             38
Eliminations, corporate and other(2) (3)                                                  (2,144)                 (2,373)                      15                    10            NM
  Consolidated operating income(3)                                                         3,077                   1,867                    3,815                    65             (51)
FedEx Express Segment operating margin(1)                                                     9.5%                    5.8%                     5.3%                 370 bp           50 bp
FedEx Ground Segment operating margin                                                       13.7%                   16.7%                    17.4%                 (300)bp          (70)bp
FedEx Freight Segment operating margin                                                        6.9%                    7.8%                     6.1%                 (90)bp         170 bp
  Consolidated operating margin(2) (3)                                                        6.1%                    3.9%                     8.4%                 220 bp        (450)bp
Consolidated net income(3)                                                              $ 1,820                 $ 1,050                  $ 2,324                     73             (55)
Diluted earnings per share                                                              $ 6.51                  $ 3.65                   $ 7.48                      78             (51)

The following table shows changes in revenues and operating income by reportable segment for 2016 compared to 2015, and 2015 compared
to 2014 (in millions).
                                                                                                Year-over-Year Changes
                                                                                        Revenues                   Operating Income
                                                                               2016/2015        2015/2014      2016/2015(4)    2015/2014
FedEx Express segment   (1)
                                                                                  $ (788)          $ 118         $ 935           $ 156
FedEx Ground segment                                                                 3,590           1,367            104             151
FedEx Freight segment                                                                    9             434            (58)            133
FedEx Services segment                                                                  48               9              –               –
Eliminations, corporate and other(2) (3)
                                                                                        53             (42)           229          (2,388)
                                                                                   $ 2,912         $ 1,886        $ 1,210        $ (1,948)
(1)	FedEx Express segment 2015 expenses include impairment and related charges of $276 million resulting from the decision to permanently retire and adjust the retirement schedule of certain
     aircraft and related engines.
(2)	Operating income includes a loss of $1.5 billion in 2016, $2.2 billion in 2015 and $15 million in 2014 associated with our mark-to-market pension accounting further discussed in Note 13 of the
     accompanying consolidated financial statements.
(3)	Operating income in 2016 includes provisions related to independent contractor litigation matters at FedEx Ground for $256 million and expenses related to the settlement of a U.S. Customs and
     Border Protection notice of action in the amount of $69 million, in each case net of recognized immaterial insurance recovery. 2015 operating income includes a $197 million charge in the fourth
     quarter to increase the legal reserve associated with the settlement of a legal matter at FedEx Ground to the amount of the settlement, which is further discussed in Note 18 of the accompanying
     consolidated financial statements.
(4)	Includes transaction, financing and integration planning expenses related to our TNT Express acquisition, as well as immaterial financial results of TNT Express from the date of acquisition,
     aggregating $132 million during 2016. These expenses are predominantly included in “Eliminations, corporate and other.”

Overview                                                                                            insurance recovery ($43 million, net of tax, or $0.15 per diluted share).
Our results for 2016 include a $1.5 billion loss ($946 million, net of                              These items are included in “Eliminations, corporate and other” and
tax, or $3.39 per diluted share) associated with our fourth quarter                                 are further described below in this MD&A.
mark-to-market (or MTM) benefit plans adjustment. Our 2016 results                                  We acquired TNT Express on May 25, 2016. We incurred transaction,
also include provisions for the settlement of and expected losses                                   financing and integration planning expenses related to this acquisition
related to independent contractor litigation matters involving FedEx                                of $132 million ($125 million, net of tax, or $0.45 per diluted share)
Ground for $256 million, net of recognized insurance recovery                                       in 2016, which includes the impact of certain costs not deductible for
($158 million, net of tax, or $0.57 per diluted share) and expenses                                 tax purposes as a result of the acquisition. These expenses also include
related to the settlement of a U.S. Customs and Border Protection                                   TNT Express’s financial results from the time of acquisition, which are
(“CBP”) notice of action regarding uncollected duties and merchandising                             immaterial, and are predominantly included in “Eliminations, corporate
processing fees in the amount of $69 million, net of recognized                                     and other” in 2016.

                                                                                                                                                                                                         11
MANAGEMENT’S DISCUSSION AND ANALYSIS

     During 2016, a favorable tax impact from an internal corporate                                      FedEx Express U.S. Domestic
     restructuring to facilitate the integration of FedEx Express and TNT                                Average Daily Package Volume
     Express was recorded in the amount of $76 million (or $0.27 per                                                                   2,683
                                                                                           2,700
     diluted share). See the “Income Taxes” section of this MD&A and                                                                                     2,713

     Note 12 of the accompanying consolidated financial statements for
     more information.                                                                     2,600
                                                                                                        2,543
                                                                                                                            2,571
     Our 2016 results benefited from higher operating income at FedEx
                                                                                           2,500
     Express as our profit improvement program that commenced in
     2013 continued to constrain expense growth while improving revenue                                  FedEx Express U.S. Domestic
     quality, and the positive net impact of fuel. Two additional operating                2,400         Average Daily Package Volume
                                                                                                        2013                2014         2015            2016
     days benefited all our transportation segments in 2016. These factors                                                             2,683
                                                                                           2,700
                  FedEx
     were partially         Express
                         offset       U.S.than
                                by lower    Domestic
                                                anticipated revenue at FedEx                             FedEx Express International(1) 2,713
     Freight, and Average
                       networkDaily  Package
                                expansion       Volume
                                             costs, higher self-insurance expenses                       Average Daily Package Volume
     and
      2,700
            increased    purchased   transportation
                                          2,683       rates at FedEx Ground. In            2,600
                                                                                           1,000        2,543
     addition, higher incentive compensation accruals,  2,713
                                                                which were not                                              2,571        853             888
                                                                                                                  819
     impacted by the charges and credits described above, negatively                                     FedEx Express
                                                                                                        785    Ground U.S. Domestic
                                                                                             800
                                                                                           2,500
      2,600                                                                                              Average Daily Package Volume
     impacted     our overall results.
                 2,543
                                                                                           8,000        576                 580           586            575
                            2,571                                                            600                                       2,683            7,526
     In 2016, we repurchased an aggregate of $2.7 billion of our common                    2,700
                                                                                           2,400
                                                                                           7,500        2013                2014        2015            2,713
                                                                                                                                                        2016
      2,500
     stock through open market purchases. See additional information                        400
                                                                                           7,000                            6,774       6,911

               FedEx
     on the share      Expressprogram
                   repurchase    U.S. Domestic
                                         in Note 1 of the accompanying                     6,500
                                                                                           2,600
                                                                                                          FedEx
                                                                                                        6,280  Express International(1)
               Average Daily Package Volume                                                              Average Daily Package Volume
     consolidated
      2,400
              2013 financial statements.
                          2014        2015        2016
                                                                                             200
                                                                                           6,000        2,543
                                                                                                        2013                2014
                                                                                                                            2,571       2015             2016
                                            2,683                                          5,500
     Our
      2,700results for 2015 include a $2.2 billion loss ($1.4 billion, net of
                                                            2,713
                                                                                           1,000
                                                                                           2,500                International export         International domestic
                                                                                                                                                          888
                                                                                           5,000                                         853
     tax, or $4.81 per diluted share) associated with our fourth quarter                   4,500         FedEx
                                                                                                        785    Ground
                                                                                                                             819
                                                                                             800
     mark-to-market
      2,600                 benefit plans adjustment. In addition, we recorded             2,400
                                                                                           4,000         Average Daily Package Volume
                                                                                                        2013                2014        2015            2016
     impairment   2,543and related charges of $276 million ($175 million, net
                               2,571                                                       8,000
                                                                                             600
                                                                                                        2013
                                                                                                         576
                                                                                                                            2014
                                                                                                                            580
                                                                                                                                        2015
                                                                                                                                         586
                                                                                                                                                         2016
                                                                                                                                                         575
                                                                                                                                                        7,526
     of tax, or FedEx
                   $0.61 per   diluted share) associated with aircraft and
                            Ground                                                         7,500         FedEx Freight
      2,500
     engine retirements        at FedEx
                   Average Daily           Express,
                                       Package        and a $197 million ($133
                                                   Volume                                    400
                                                                                           7,000         Average Daily       6,911
                                                                                                                  6,774 LTL Shipments
     million,
      8,000     net of tax, or $0.46 per diluted share)    7,526
                                                                  charge in the fourth     6,500       6,280
                                                                                                                                                         98.8
     quarter
      2,400
      7,500     to2013increase the
                                2014 legal reserve
                                              2015    associated
                                                            2016    with the settlement      200
                                                                                           100.0
                                                                                           6,000        2013                2014        2015             2016
                                             6,911
     of7,000
          an independent contractor
                               6,774        litigation  matter at FedEx Ground.            5,500         FedEx    Ground
                                                                                                           International export       95.5 International domestic

     While
      6,500 these6,280 charges significantly impacted our consolidated results,            5,000         FedEx Express
                                                                                                         Average                and FedEx
                                                                                                                      Daily Package             Ground
                                                                                                                                           Volume
                                                                                                         Total Average 90.6     Daily Package Volume
     each of our transportation segments had strong performance during
      6,000                                                                                4,500
                                                                                           8,000
                                                                                            90.0                                                        7,526
                                                                                          12,500
     2015.
      5,500 All of our transportation segments experienced higher                          4,000
                                                                                           7,500
                                                                                                       2013
                                                                                                       85.7                  2014       2015             2016
                                                                                                                                        6,911
     volumes,
      5,000
                   coupled with improved yields at FedEx Ground and FedEx                 12,000
                                                                                           7,000                            6,774
                                                                                                                                                        11,702
      4,500
     Freight.   InFedEx
                    addition,Ground
                               our results benefited from our profit improvement           6,500
                                                                                          11,500
                                                                                                         FedEx
                                                                                                       6,280   Freight
      4,000        Average Daily Package Volume                                             80.0         Average Daily LTL Shipments
     program 2013 commenced2014in 2013, the   2015 positive2016
                                                              net impact of fuel, and a    6,000
                                                                                          11,000
                                                                                                        2013
                                                                                                                            11,033
                                                                                                                            2014        2015            2016
      8,000                                                                                5,500                            10,744
     lower year-over-year impact from severe winter        7,526
                                                                    weather. Our 2015      100.0
                                                                                                                                                         98.8
      7,500                                                                               10,500
                                                                                           5,000
     results
      7,000
               include     higher
                               6,774
                                    maintenance
                                             6,911 expense, primarily due to the                       10,184
                                                                                           4,500                                         95.5
     timing
      6,500
              of6,280
                   aircraft maintenance events at FedEx Express, and higher               10,000
                                                                                                         FedEx Express and FedEx Ground
                                                                                           4,000
     incentive
      6,000
                   compensation accruals, which were not affected by the                   9,500         Total Average
                                                                                                        2013      2014
                                                                                                                  90.6 Daily 2015
                                                                                                                             Package Volume
                                                                                                                                      2016
                                                                                                        2013                2014         2015            2016
     mark-to-market
      5,500                accounting adoption, the aircraft impairment or the              90.0
                                                                                          12,500

     legal
      5,000  reserve
                   FedEx adjustment
                            Express described
                                       and FedExabove.Ground                              12,000
                                                                                                        85.7
                                                                                                                                                        11,702
      4,500
                Total Average Daily Package Volume
     In  2015, we repurchased an aggregate of $1.3 billion of our common                  11,500
     12,500
      4,000                                                                                 80.0         FedEx Express U.S.11,033
                                                                                                                              Domestic
     stock  through
               2013 open market
                         2014   purchases.
                                    2015       2016
                                                                                          11,000
                                                                                                        2013     2014
                                                                                                         Revenue 10,744
                                                                                                                 per          2015
                                                                                                                        Package  – Yield                 2016
     12,000                                           11,702
     The following graphs for FedEx Express, FedEx Ground and FedEx                       $19.00
                                                                                          10,500         FedEx Express and FedEx Ground
                                                                                                       10,184
     11,500
     Freight show selected volume trends
                                   11,033 (in thousands) for the years                                   Total Average Daily Package Volume
                                                                                          $18.00
                                                                                          10,000                            $17.42
     ended
     11,000
            May 31:     10,744                                                            12,500       $17.33
                                                                                                                                       $17.13           $17.00
                                                                                           9,500
                                                                                          $17.00
     10,500   10,184                                                                      12,000        2013                2014        2015             2016
                                                                                                                                                        11,702
     10,000                                                                               11,500
                FedEx Express and FedEx Ground                                            $16.00
                                                                                                                                       11,033
      9,500     Total Average Daily Package Volume                                        11,000
               2013         2014         2015         2016                                $15.00                            10,744
     12,500                                                                                              FedEx Express U.S. Domestic
                                                                                          10,500       10,184
     12,000                                                                               $14.00         Revenue per Package – Yield
                                                      11,702                                            2013                2014         2015            2016
                                                                                          10,000
                                                                                          $19.00
     11,500
                FedEx Express U.S.11,033
                                    Domestic                                               9,500         FedEx Express International
                                                                                          $18.00       2013      2014        2015
     11,000     Revenue per
                        10,744Package – Yield                                                           Revenue
                                                                                                       $17.33
                                                                                                                 $17.42
                                                                                                                 per
                                                                                                         FedEx Ground  Package  – Yield 2016
                                                                                                                            $17.13      $17.00
     $19.00
     10,500
                                                                                          $70.00
                                                                                          $17.00   (1)	International
                                                                                                            Revenue    domestic  average daily
                                                                                                                           per Package       – package
                                                                                                                                                Yield volume represents
12            10,184                                                                                    our  international$58.92
                                                                                                          $58.72           intra-country operations.
                                                                                                                                         $57.50
                                                                                          $60.00
                                                                                           $9.00                                                        $54.16
     $18.00
     10,000                 $17.42                                                        $16.00
               $17.33
                                        $17.13                                            $50.00         FedEx Express U.S. Domestic
                                                     $17.00
      9,500                                                                                              Revenue per Package – Yield                     $7.80
11,033   11,033                                                                                                        $17.00
11,000    11,000                                                                             $17.00
                        10,744   10,744

10,500    10,500
          10,184   10,184                                                                    $16.00

10,000    10,000                                                                                                                      MANAGEMENT’S DISCUSSION AND ANALYSIS
                                                                                             $15.00
 9,500     9,500
           2013     20132014     20142015      20152016     2016                             $14.00
                                                                                                        2013             2014              2015              2016

The following graphs for FedEx Express, FedEx Ground and FedEx Freight show selected yield trends for the years ended May 31:

                   FedEx Express
            FedEx Express        U.S. Domestic
                          U.S. Domestic                                                                  FedEx
                                                                                                         FedEx Ground
                                                                                                                FedEx Express
                                                                                                               Express          International
                                                                                                                       International
            RevenueRevenue per Package
                    per Package – Yield – Yield                                                          Revenue per
                                                                                                                 per Package
                                                                                                         RevenueRevenue       –– Yield
                                                                                                                         per Package
                                                                                                                     Package     Yield – Yield
$19.00    $19.00                                                                              $9.00
                                                                                             $70.00    $70.00
                                                                                                       $58.72           $58.92
                                                                                                                    $58.72            $58.92
                                                                                                                                          $57.50        $57.50
                                                                                             $60.00    $60.00                                               $54.16        $54.16
$18.00    $18.00        $17.42   $17.42                                                       $8.00                                                          $7.80
          $17.33    $17.33                                                                   $50.00    $50.00
                                     $17.13   $17.13
                                                  $17.00   $17.00
                                                                                                                                           $7.16
$17.00    $17.00                                                                             $40.00    $40.00
                                                                                              $7.00                      $6.75
                                                                                                       $6.60
$16.00    $16.00                                                                             $30.00    $30.00

                                                                                             $20.00
                                                                                              $6.00    $20.00
$15.00    $15.00                                                                                       $6.99        $6.99$6.95
                                                                                             $10.00    $10.00                         $6.95$6.49         $6.49$5.65        $5.65
$14.00    $14.00                                                                              $5.00
                                                                                                 $–        $–
           2013     20132014     20142015      20152016     2016                                        2013
                                                                                                        2013         20132014
                                                                                                                         2014          20142015
                                                                                                                                           2015          20152016
                                                                                                                                                             2016          2016

                                                                                                                      International
                                                                                                        International export        export composite
                                                                                                                             composite                     International domestic
                                                                                                                                             International domestic

                   FedEx Ground
            FedEx Ground                                                                                 FedEx Freight
            RevenueRevenue per Package
                    per Package – Yield – Yield                                                          LTL Revenue per Shipment
 $9.00     $9.00                                                                            $250.00

 $8.00     $8.00                                   $7.80    $7.80
                                                                                                                                          $240.09
                                                                                            $240.00
                                     $7.16    $7.16
                                                                                                                        $234.23
 $7.00     $7.00        $6.75    $6.75
          $6.60     $6.60
                                                                                                       $231.52
                                                                                            $230.00
 $6.00     $6.00                                                                                                                                            $232.11

 $5.00     $5.00                                                                            $220.00
           2013     20132014     20142015      20152016     2016                                        2013             2014              2015               2016

                   FedEx Freight
            FedEx Freight
 Revenue              LTL Revenue
            LTL Revenue        per Shipmentper Shipment                            FedEx Home Delivery       service
                                                                                                        Average        and Cost
                                                                                                                   Average
                                                                                                                     Fuel   commercial
                                                                                                                              Fuel
                                                                                                                                 perCost  business,
                                                                                                                                            per Gallon
                                                                                                                                        Gallon        the inclusion
 Revenues
$250.00      increased 6% in 2016 driven by the FedEx Ground segment
         $250.00                                                                   of GENCO results from the date of acquisition and increased yields.
 due to volume growth in our residential services coupled with rate                At FedEx Freight,
                                                                                             $4.50     revenues
                                                                                                       $4.50
                                                                                                      $3.81         increased
                                                                                                                 $3.81
                                                                                                                      $3.76    8% in 2015 primarily due to
                                                                                                                              $3.76

 increases, and the inclusion of$240.09 GENCO $240.09
                                                 Distribution System, Inc.         higher average daily shipments and revenue per shipment. Revenues
                                                                                             $3.50     $3.50                       $3.13     $3.13
$240.00  $240.00
 (“GENCO”) revenue$234.23for a full$234.23
                                     year. In addition, revenues increased         at FedEx Express were flat during 2015, as U.S. domestic and
                                                                                                      $3.22      $3.22$3.13
 approximately                                                                     international
                                                                                             $2.50 package
                                                                                                       $2.50 volume growth was offset by$2.24
                                                                                                                              $3.13
                                                                                                                                                   lower fuel
         $231.52 $1.2    billion in 2016 as a result of recording FedEx
                    $231.52                                                                                                                               $2.24
 SmartPost
$230.00       service revenues on a gross basis, versus our previous
         $230.00
                                                                                   surcharges and the negative impact of exchange  $2.47      rates.
                                                                                                                                             $2.47
                                                    $232.11    $232.11
 net treatment, as further discussed in this MD&A and in Note 1 of                            $1.50     $1.50
                                                                                                                                                             $1.52         $1.52
 the accompanying consolidated financial statements. Lower fuel                    Retirement Plans MTM Adjustment
$220.00  $220.00                                                                               $.50     $.50
 surcharges2013had a 2013
                      significant
                          2014      negative
                                    2014 2015   impact
                                                  20152016on revenues
                                                                2016   at all of   We incurred noncash 2013 pre-tax
                                                                                                                 2013mark-to-market
                                                                                                                     2014      20142015 losses
                                                                                                                                             2015of
                                                                                                                                                 2016$1.5 billion
                                                                                                                                                           2016   in
 our transportation segments in 2016. Unfavorable exchange rates                   2016 ($946 million, net of tax, orVehicle
                                                                                                                          $3.39 per   diluted share),
                                                                                                                                  Vehicle
                                                                                                                                    Jet       Jet       $2.2 billion in
 also negatively impacted revenues at FedEx Express in 2016. Two                   2015 ($1.4 billion, net of tax, or $4.81 per diluted share) and $15 million
 additional operating days benefited revenues at all our transportation            in 2014 ($9 million, net of tax, or $0.03 per diluted share) from actuarial
 segments in 2016.                                                                 adjustments to pension and postretirement healthcare plans related to
                                                                                   the measurement of plan assets and liabilities. For more information
Revenues increased 4% in 2015 due to improved performance at all
                                                                                   see further discussion in the “Critical Accounting Estimates” section of
our transportation segments. At FedEx Ground, revenues increased
                                                                                   this MD&A and Note 1 and Note 13 of the accompanying consolidated
12% in 2015 due to higher volume from continued growth in both our
                                                                                   financial statements.

                                                                                                                                                                                    13
MANAGEMENT’S DISCUSSION AND ANALYSIS

     Operating Expenses                                                                                      Our operating expenses for 2016 include a $1.5 billion loss
     The following tables compare operating expenses expressed as dollar                                     ($946 million, net of tax) associated with our annual MTM adjustment
     amounts (in millions) and as a percent of revenue for the years ended                                   described above. In addition, we recorded corporate level provisions
     May 31:                                                                                                 for the settlement of and expected losses related to independent
                                                                                                             contractor litigation matters involving FedEx Ground and the settlement
                                         2016      2015      2014                                            of the CBP matter and expenses related to our acquisition of TNT
     Operating expenses:                                                                                     Express as described above. Operating expenses also increased due
      Salaries and employee benefits $ 18,581 $ 17,110 $ 16,171                                              to higher salaries and employee benefits at FedEx Freight, and higher
                                                                                                             purchased transportation expenses due to the recording of FedEx
      Purchased transportation           9,966     8,483     8,011
                                                                                                             SmartPost revenues on a gross basis, network expansion costs, higher
      Rentals and landing fees           2,854     2,682     2,622                                           self-insurance expenses and increased purchased transportation rates
      Depreciation and amortization      2,631     2,611     2,587                                           at FedEx Ground. In addition, higher incentive compensation accruals
      Fuel                               2,399     3,720     4,557                                           impacted our overall operating expenses.
      Maintenance and repairs            2,108     2,099     1,862                                           Our operating margin benefited from the reduced year-over-year loss
      Impairment and other charges           –       276(1)      –                                           from our MTM adjustment, the strong performance of our FedEx
      Retirement plans mark-to-market                                                                        Express segment due to the continued execution of our profit
     		adjustment                        1,498     2,190        15                                           improvement program and the positive net impact of fuel (as further
                                                                                                             described below). However, operating margin was negatively
      Other                              7,251 (2)
                                                   6,415 (3)
                                                             5,927
                                                                                                             impacted in 2016 by higher salaries and employee benefits at FedEx
     		 Total operating expenses      $ 47,288 $ 45,586 $ 41,752                                             Freight, and network expansion costs, higher self-insurance expenses
     		 Total operating income        $ 3,077 $ 1,867 $ 3,815                                                and the recording of FedEx SmartPost revenues on a gross basis at
                                                                                                             FedEx Ground, transaction and integration planning expenses related
                                                                  Percent of Revenue                         to our TNT Express acquisition, and higher incentive compensation
                                                                                                             accruals.
                                                               2016      2015      2014
     Operating expenses:                                                                                 Our operating expenses included an increase in purchased
                                                                                                         transportation costs of 17% in 2016 due to the recording of
      Salaries and employee benefits     36.9%                                    36.1%            35.5%
                                                                                                         FedEx SmartPost service revenues on a gross basis (including postal
      Purchased transportation           19.8                                     17.9             17.6 fees in revenues and expenses) and higher volumes and increased
      Rentals and landing fees            5.7                                      5.7              5.7 rates at FedEx Ground. Salaries and employee benefits expense
      Depreciation and amortization       5.2                                      5.5              5.7 increased 9% in 2016 due to the inclusion of GENCO results for a full
      Fuel                                4.7                                      7.8             10.0 year, pay initiatives coupled with increased staffing at FedEx Freight,
                                                                                                         higher healthcare costs and higher incentive compensation accruals.
      Maintenance and repairs             4.2                                      4.4              4.1
                                                                                                         Other expenses were 13% higher in 2016 due to the inclusion of
      Impairment and other charges          –                                      0.6(1)             – GENCO results for a full year, higher self-insurance costs at FedEx
      Retirement plans mark-to-market 		                                                                 Ground and the CBP matter described above. Rentals and landing fees
     		adjustment                         3.0                                      4.6                – increased 6% in 2016 due to network expansion and the inclusion
      Other                              14.4(2)                                  13.5(3)          13.0 of GENCO results for a full year at FedEx Ground. Retirement plans
     		 Total operating expenses         93.9                                     96.1             91.6 mark-to-market adjustment expenses decreased 32% in 2016, as
     Operating margin                     6.1%                                     3.9%             8.4% favorable demographic assumption experience partially offset the
                                                                                                         actuarial loss on pension plan asset returns in 2016.
     (1)	Includes charges resulting from the decision to permanently retire and adjust the retirement
          schedule of certain aircraft and related engines at FedEx Express.
     (2)	Includes provisions for the settlement of and expected losses related to independent contractor
          litigation matters involving FedEx Ground for $256 million, and $69 million in expenses related
          to the settlement of a CBP notice of action, in each case net of recognized immaterial insurance
          recovery.
     (3)	Includes a $197 million charge in the fourth quarter to increase the legal reserve associated
          with the settlement of a legal matter at FedEx Ground to the amount of the settlement.

14
$8.00                                           $7.80

                                     $7.16
  $7.00                 $6.75                                                                                                    MANAGEMENT’S DISCUSSION AND ANALYSIS
            $6.60

  $6.00

          Our operating expenses for 2015 included a $2.2 billion loss                  Fuel
  $5.00   ($1.4
             2013
                  billion, net
                            2014
                                of tax) associated
                                          2015
                                                     with
                                                       2016
                                                           our mark-to-market pension   The following graph for our transportation segments shows our
          accounting as described above. In addition, we recorded charges               average cost of jet and vehicle fuel per gallon for the years ended
          of $276 million ($175 million, net of tax) associated with the decision       May 31:
          to permanently
              FedEx Freight
                               retire and adjust the retirement schedule of certain
          aircraft   and  related
              LTL Revenue per       engines   at FedEx Express, and a $197 million
                                       Shipment                                                          Average Fuel Cost per Gallon
$250.00
          ($133 million, net of tax) charge in the fourth quarter to increase the
          reserve associated with the settlement of an independent contractor                  $4.50   $3.81
                                                                                                                   $3.76
          proceeding at FedEx Ground          to the amount of the settlement. Our
                                         $240.09
$240.00   2015 operating expenses also increased primarily due to volume-                      $3.50                               $3.13

          related growth      in salaries and employee benefits and purchased
                           $234.23                                                                     $3.22       $3.13
                                                                                               $2.50
          transportation expenses, higher maintenance and repairs expense
           $231.52
                                                                                                                                   $2.47
                                                                                                                                              $2.24
$230.00
          and higher incentive compensation accruals. $232.11   However, operating             $1.50
                                                                                                                                              $1.52
          margin benefited from revenue growth, our profit improvement
$220.00
          program, which we commenced in 2013, the net impact of fuel                           $.50
          (as2013
               further described
                            2014     below)
                                          2015and a lower
                                                       2016 year-over-year impact                       2013        2014           2015       2016

          from severe winter weather.                                                                                  Vehicle      Jet

          Operating expenses included an increase in salaries and employee              Fuel expense decreased 36% during 2016 primarily due to lower
          benefits expense of 6% in 2015 due to the timing of merit increases           aircraft fuel prices. However, fuel prices represent only one component
          for many of our employees at FedEx Express, additional staffing to            of the two factors we consider meaningful in understanding the
          support volume growth and higher incentive compensation accruals.             impact of fuel on our business. Consideration must also be given
          These factors were partially offset by the positive impact of our             to the fuel surcharge revenue we collect. Accordingly, we believe
          voluntary buyout program completed in 2014. Other expenses were               discussion of the net impact of fuel on our results, which is a
          driven 8% higher in 2015 due to the legal reserve increase discussed          comparison of the year-over-year change in these two factors, is
          above and the inclusion of GENCO results. Purchased transportation            important to understand the impact of fuel on our business. In order
          costs increased 6% in 2015 due to volume growth and higher service            to provide information about the impact of fuel surcharges on the
          provider rates at FedEx Ground and volume growth, higher utilization          trend in revenue and yield growth, we have included the comparative
          and higher service provider rates at FedEx Freight. The timing of             weighted-average fuel surcharge percentages in effect for 2016,
          aircraft maintenance events at FedEx Express primarily drove an               2015 and 2014 in the accompanying discussions of each of our
          increase in maintenance and repairs expense of 13% in 2015.                   transportation segments.

                                                                                                                                                                  15
MANAGEMENT’S DISCUSSION AND ANALYSIS

     The index used to determine the fuel surcharge percentage for our           overall revenue and yield. Additional components include the mix of
     FedEx Freight business adjusts weekly, while our fuel surcharges for        services sold, the base price and extra service charges we obtain for
     the FedEx Express and FedEx Ground businesses incorporate a timing          these services and the level of pricing discounts offered.
     lag of approximately six to eight weeks before they are adjusted for
                                                                                 Fuel expense decreased 18% during 2015 primarily due to lower
     changes in fuel prices. For example, the fuel surcharge index in effect
                                                                                 aircraft fuel prices. The net impact of fuel had a significant benefit
     at FedEx Express in May 2016 was set based on March 2016 fuel
                                                                                 to operating income in 2015. This was driven by decreased fuel
     prices. In addition, the structure of the table that is used to determine
                                                                                 prices during 2015 versus the prior year, which was slightly offset
     our fuel surcharge at FedEx Express and FedEx Ground does not
                                                                                 by the year-over-year decrease in fuel surcharge revenue during
     adjust immediately for changes in fuel price, but allows for the fuel
                                                                                 these periods.
     surcharge revenue charged to our customers to remain unchanged
     as long as fuel prices remain within certain ranges.                        Interest Expense
     Beyond these factors, the manner in which we purchase fuel also             Interest expense increased $101 million in 2016 primarily due to
     influences the net impact of fuel on our results. For example, our          increased interest expense from our 2016 and 2015 debt offerings
     contracts for jet fuel purchases at FedEx Express are tied to various       used to fund our share repurchase programs and business acquisitions.
     indices, including the U.S. Gulf Coast index. While many of these           Interest expense increased $75 million in 2015 primarily due to
     indices are aligned, each index may fluctuate at a different pace,          increased interest expense from our January 2015 debt offering and
     driving variability in the prices paid for jet fuel. Furthermore, under     January 2014 debt offering.
     these contractual arrangements, approximately 75% of our jet fuel
     is purchased based on the index price for the preceding week, with          Income Taxes
     the remainder of our purchases tied to the index price for the              Our effective tax rate was 33.6% in 2016, 35.5% in 2015 and
     preceding month, rather than based on daily spot rates. These               36.5% in 2014. Due to its effect on income before income taxes, the
     contractual provisions mitigate the impact of rapidly changing daily        adjustment for MTM accounting reduced our 2016 effective tax rate
     spot rates on our jet fuel purchases.                                       by 120 basis points and our 2015 effective tax rate by 80 basis points,
     Because of the factors described above, our operating results may           and increased our effective tax rate by 20 basis points in 2014. Our
     be affected should the market price of fuel suddenly change by a            2016 tax rate was favorably impacted by $76 million from an internal
     significant amount or change by amounts that do not result in an            corporate restructuring done in anticipation of the integration of the
     adjustment in our fuel surcharges, which can significantly affect           foreign operations of FedEx Express and TNT Express. As part of this
     our earnings either positively or negatively in the short-term.             restructuring, our Canadian subsidiary made distributions to our U.S.
                                                                                 operations which resulted in the recognition of U.S. foreign tax credits
     We routinely review our fuel surcharges and our fuel surcharge              in excess of the U.S. taxes incurred from the distributions. This
     methodology. On November 2, 2015, we updated the tables used                favorable impact was partially offset by a $40 million tax expense
     to determine our fuel surcharges at FedEx Express, FedEx Ground             attributable to non-deductible expenses incurred as part of the TNT
     and FedEx Freight.                                                          Express acquisition. Our permanent reinvestment strategy with
     The net impact of fuel had a modest benefit to operating income in          respect to unremitted earnings of our foreign subsidiaries provided a
     2016. This was driven by decreased fuel prices during 2016 versus           benefit of approximately $48 million to our 2016 provision for income
     the prior year, which was partially offset by the year-over-year            taxes. Cumulative permanently reinvested foreign earnings were
     decrease in fuel surcharge revenue during these periods.                    $1.6 billion at the end of 2016 and $1.9 billion at the end of 2015.
                                                                                 The 2016 reduction in our permanently reinvested earnings was due
     The net impact of fuel on our operating results does not consider the       to the internal corporate restructuring discussed above.
     effects that fuel surcharge levels may have on our business, including
     changes in demand and shifts in the mix of services purchased by our        Additional information on income taxes, including our effective tax
     customers. While fluctuations in fuel surcharge percentages can be          rate reconciliation, liabilities for uncertain tax positions and our global
     significant from period to period, fuel surcharges represent one of the     tax profile can be found in Note 12 of the accompanying consolidated
     many individual components of our pricing structure that impact our         financial statements.

16
MANAGEMENT’S DISCUSSION AND ANALYSIS

Business Acquisitions                                                     results of operations of FedEx that would have been reported had the
On May 25, 2016, we acquired TNT Express for €4.4 billion                 acquisition been completed as of the beginning of 2015. Furthermore,
(approximately $4.9 billion). Cash acquired in the acquisition was        this unaudited pro forma information does not give effect to the
approximately €250 million ($280 million). As of May 31, 2016,            anticipated business and tax synergies of the acquisition and is not
$287 million of shares associated with the transaction remained           representative or indicative of the anticipated future consolidated
untendered, the majority of which were tendered subsequent to             results of operations of FedEx.
May 31, 2016, and are included in the “Other liabilities” caption         During 2015, we acquired two businesses, expanding our portfolio
of our consolidated balance sheets. We funded the acquisition             in e-commerce and supply chain solutions. On January 30, 2015,
with proceeds from our April 2016 debt issuance and existing cash         we acquired GENCO, a leading North American third-party logistics
balances. TNT Express’s financial results are immaterial from the time    provider, for $1.4 billion, which was funded using a portion of the
of acquisition and are included in “Eliminations, corporate and other.”   proceeds from our January 2015 debt issuance. The financial results
TNT Express collects, transports and delivers documents, parcels and      of this business are included in the FedEx Ground segment from the
freight to over 200 countries. This strategic acquisition broadens our    date of acquisition.
portfolio of international transportation solutions with the combined     In addition, on December 16, 2014, we acquired Bongo International,
strength of TNT Express’s strong European road platform and our           LLC, now FedEx CrossBorder, LLC (“FedEx CrossBorder”), a leader in
strength in other regions globally, including North America and Asia.     cross-border enablement technologies and solutions, for $42 million
Given the timing and complexity of the acquisition, the presentation      in cash from operations. The financial results of this business are
of TNT Express in our financial statements, including the allocation      included in the FedEx Express segment from the date of acquisition.
of the purchase price, is preliminary and will likely change in future    In 2014, we expanded the international service offerings of FedEx
periods, perhaps significantly as fair value estimates of the assets      Express by acquiring businesses operated by our previous service
acquired and liabilities assumed are refined during the measurement       provider, Supaswift (Pty) Ltd. (“Supaswift”), in seven countries in
period. We will complete our purchase price allocation no later than      Southern Africa, for $36 million in cash from operations. The financial
the fourth quarter of 2017.                                               results of these businesses are included in the FedEx Express segment
For more information and a presentation of unaudited pro forma            from their respective date of acquisition.
consolidated results, see Note 3 of the accompanying consolidated         The financial results of the GENCO, FedEx CrossBorder and Supaswift
financial statements. The accounting literature establishes guidelines    businesses were not material, individually or in the aggregate, to our
regarding the presentation of this unaudited pro forma information.       results of operations and therefore, pro forma financial information
Therefore, this unaudited pro forma information is not intended to        has not been presented.
represent, nor do we believe it is indicative of, the consolidated

                                                                                                                                                    17
You can also read