Lecture XI: Environmental effects on galaxies in clusters - Astrophysics of Galaxies 2019-2020
←
→
Page content transcription
If your browser does not render page correctly, please read the page content below
Lecture XI: Environmental effects on
               galaxies in clusters.
                                                             (main reference: Boselli & Gavazzi 2006)

Astrophysics of Galaxies
2019-2020
Stefano Zibetti - INAF Osservatorio Astrofisico di Arcetri

Lecture XI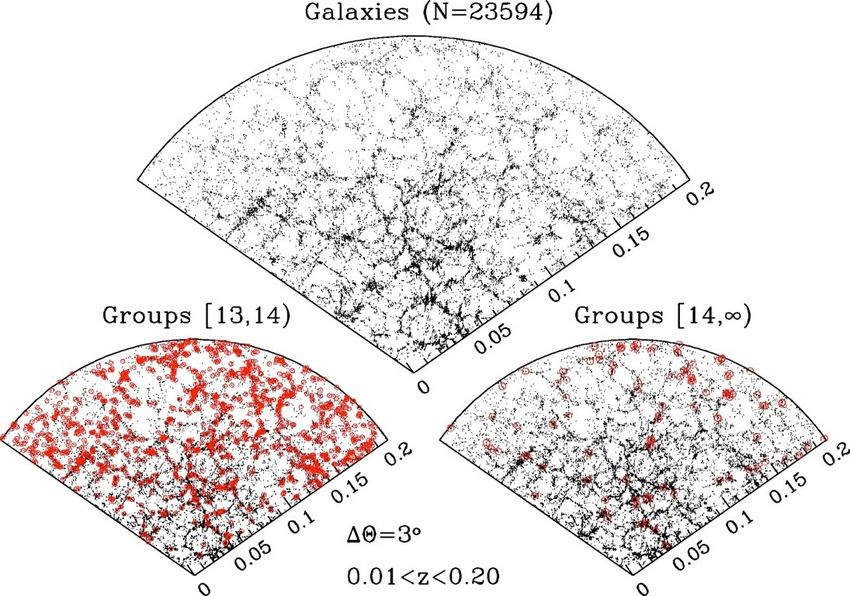
Stefano Zibetti - INAF OAArcetri - Astrophysics of Galaxies - Course 2019/2020 - Lecture XI

    Cosmic web and galaxy clustering
                                                                                             Yang et al. (2007, SDSS Group catalog)

✤   2-point correlation function

                           projected

                                                                                                                  3D real space
                                       Zehavi et al. (2005)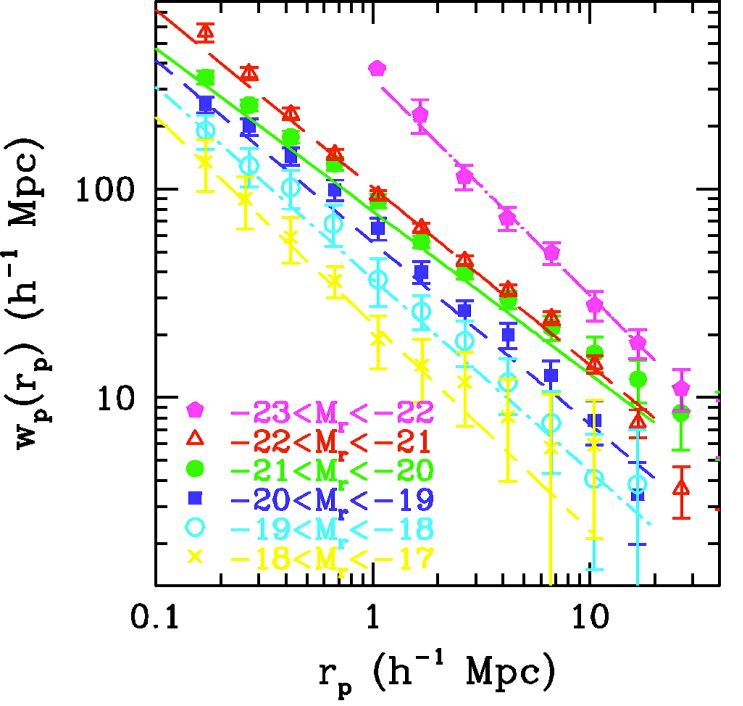
Stefano Zibetti - INAF OAArcetri - Astrophysics of Galaxies - Course 2019/2020 - Lecture XI
cia & Blaizot along with theTable authors who implemented them.
1. List of environment measures used in this study and the authors
ock two-point who implemented them, including references where applicable. See Sec-
tion 3 for further details. References: Baldry et al. (2006); Li et al. 1 2
What is environment?
3 4 5
ompare them (2011); Cowan & Ivezić (2008); Park et al. (2007); Grützbauch et al.
6 7
(2011); Gallazzi et al. (2009); Croton et al. (2005) and Wilman et al. 8
et al. (2005). 3.1 Nearest-neighbour(2010). environment measures
see Muldrew et al. (2011) Num. Method Author
measured by The principle of nearest-neighbour Neighbours
finding is tha
trained
✤ Haloinproperties
the closer neighbours 1
2 are in denserVoronoi environments.
Third nearest neighbour
Projected Podgorzec & Gray To c
Muldrew
Wall in✤ the real 6 S. I. Muldrew et 3al.Mean fourth and fifth nearest neighbours Baldry 1
mass, concentration measure for this, 4 a value of cylinder
Five-neighbour n is chosen that Li speci 2
5 Seventh projected nearest neighbour Ann
✤ Local densityinsideof thisneighbours
area or volume, around
the
6 denser the point
the environment
10-neighbour of isinterest.
Bayesian metric assumed CowanIn its 4 RsimE 3
4
c as possible,
✤ Large to be,
scale density and vice
projected versa.
surface
7
8
20-neighbour smooth density
density
64-neighbour of galaxies,
smooth density σ n
Choi & Park
, can
Pearce then
To inveb
Fixed aperture measures are often expressed as a density contrast,
nvironmental
✤ Different methods:
δ, instead of a density,
n ρ. Density Aperture
contrast rescales the aperture count
measur
9 1 h Mpc (± 1000 km s ) −1 Grützbauch & Conselicethe hos
−1 5
the less a few
✤ Neighbors with σn =
respect to the ,
mean and 10 is typically defined as
2 h Mpc (± 500 km s ) −1 Gallazzi −1
environ
6
πrn2 11 2 h Mpc (± 1000 km s ) −1 −1
Grützbauch & Conselice
med virialized 12
13
2 h Mpc (± 6000 km s )
5 h Mpc (± 1000 km s )
−1
−1
Gallazzi −1
−1
Grützbauch & Conselice
To f 6
δρ Ng − N̄g ‘percen
some haloes δ ≡ ρwhere
✤ Aperture = n
N̄g
is, the number of neighbours within
14 8 h Mpc spherical −1
(9)Croton the pr
galaxie
7
merger (e.g. analysis
✤ Multiscale rn , thewithradius to 15
the nth nearest neighbour.
Annulus
0.5–1.0 h Mpc (± 1000 km s ) −1Wilman & Zibetti
One
centage
−1 8
Wilman & Zibettibeing t
annuli
l galaxies are (probes
where quantifying
different
N g is the number environment
of
16
galaxies
17 found using
in the projected
0.5–2.0 h Mpc (± 1000 km s )
aperture
0.5–3.0 h Mpc (± 1000 km s ) and
−1
−1N̄ statistics
g is
Wilman & Zibettigalaxy
−1
−1i 8
8
physical regimes: core, halo,
the mean number of galaxies18that would
1.0–2.0 h beMpcexpected
(± 1000 kmin
s the
) aperture
ies can appear close together when they areZibettiin fa
−1Wilman & Zibetti −1 8
entre of their
outskirts, infall regions...)
if galaxies 19
were instead distributed 1.0–3.0 h Mpc (± 1000 km s )
randomly throughout the entire
−1Wilman & in the
−1s 8
20 2.0–3.0 h Mpc (± 1000 km s ) −1Wilman & Zibettinormal −1 8
es, especially volume. alignment and are actually separated by a larger estimat
Stefano Zibetti - INAF OAArcetri - Astrophysics of Galaxies - Course 2019/2020 - Lecture XI

Central vs. satellite galaxies

✤   Galaxies are born in their own
    DM halo
✤   Halos grow hierarchically
     ✤ some galaxies merge with the

       central one of the main halo
     ✤ some are accreted as satellites

       (likely dissolving their own
       DM halo in the main halo)
✤   Central and satellites experience
    different kind of interactions
    with the environment
✤   New approach: large
    spectroscopic surveys required!

                                                                                                                    Lacey & Cole (1996)
Stefano Zibetti - INAF OAArcetri - Astrophysics of Galaxies - Course 2019/2020 - Lecture XI
Systematic differences between
satellite and central galaxies 944 A. Pasquali et al.
✤ Easily seen after the main
dependence on stellar mass
is removed
✤ Satellite galaxies
systematically differ from
central galaxies at given
stellar mass, being older
and more metal rich (more
for more massive halos)
✤ Less massive galaxies suffer
much more from the
environmental effects
Figure
Figure5.5. Ages
Agesand
andmetallicities
metallicitiesof
ofcentral
centraland
andsatellite
satellitegalaxies
galaxiesas
Pasquali, Gallazzi et al. (2010)
Figure 5. Ages and metallicities of central and satellite galaxies as a function of stellar mass (left-hand panels) and halo mass (right-ha
asaafunction
functionof
ofstellar
stellarmass
mass(left-hand
(left-handpanels)
panels)and
andhalo
halomass
mass(right-han
(right-han
to bottom the panels show the luminosity-weighted ages (panels a and d), the mass-weighted ages (panels b and e) and the stellar metalStefano Zibetti - INAF OAArcetri - Astrophysics of Galaxies - Course 2019/2020 - Lecture XI The morphology-density relation
Stefano Zibetti - INAF OAArcetri - Astrophysics of Galaxies - Course 2019/2020 - Lecture XI

          Leo triplet

A small
group

                                                                                                        Copyright Andrew Harrison
Stefano Zibetti - INAF OAArcetri - Astrophysics of Galaxies - Course 2019/2020 - Lecture XI
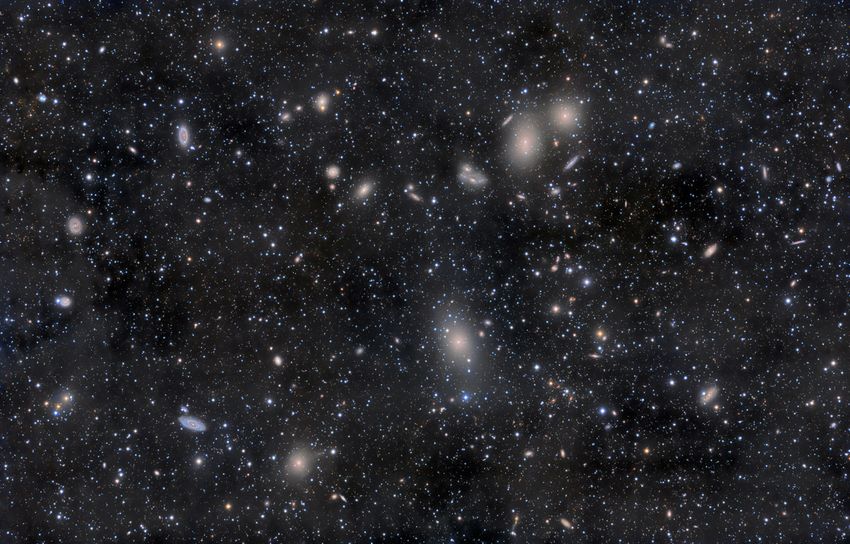
A cluster ~1014 M⦿: Virgo
Rogelio Bernal AndreoStefano Zibetti - INAF OAArcetri - Astrophysics of Galaxies - Course 2019/2020 - Lecture XI
A BIG cluster ~1015 M⦿: Coma
Copyright Bob Francke http://bf-astro.com/abell1656.htmStefano Zibetti - INAF OAArcetri - Astrophysics of Galaxies - Course 2019/2020 - Lecture XI
The morphology-density relation
1980ApJ...236..351D
Dressler (1980)Stefano Zibetti - INAF OAArcetri - Astrophysics of Galaxies - Course 2019/2020 - Lecture XI
The morphology-density relation
✤ Over 6 orders of magnitude in
density, covering field, groups
and clusters
Postman & Geller (1984)Stefano Zibetti - INAF OAArcetri - Astrophysics of Galaxies - Course 2019/2020 - Lecture XI
The morphology-radius relation
(in clusters!)
1993ApJ...407..489W
Whitmore et al. (1993)
Celestial distribution of galaxies brighter than 15.7 from the Catalogue of
Galaxies and of Clusters of Galaxies (Zwicky et al. 1968) in a 4 × 4 deg2 box
around the Coma Cluster. The 146 early-type (E+S0+S0a) galaxies (open
circles) clearly mark the cluster density enhancement, whereas the 49 late-
type (≥Sa) objects (including 10 unclassified spirals; filled circles) hardly trace
the cluster. A 1° radius circle is traced about the X-ray center. The X-ray
contours from XMM-Newton are superposed. Boselli & Gavazzi (2006)Stefano Zibetti - INAF OAArcetri - Astrophysics of Galaxies - Course 2019/2020 - Lecture XI
Morphology segregation
✤ Well established dependence of the fraction of morphological types on
density (or clustercentric radius, which is largely correlated to density)
✤ Appears to “saturate” at large densities
✤ Fraction of spirals decreases further in more X-ray-luminous clusters
✤ Appearance of cluster-specific type: dE
Sandage, Binggeli & Tamman (1985)Stefano Zibetti - INAF OAArcetri - Astrophysics of Galaxies - Course 2019/2020 - Lecture XI
The color density-relation
L102 BALOGH ET AL. Vol. 615
Balogh et al. (2004)
Fig. 1.—Filled circles in each panel show the galaxy color distribution for the indicated 1 mag range of luminosity (right axis) and the range of local projected
!2 1/2Stefano Zibetti - INAF OAArcetri - Astrophysics of Galaxies - Course 2019/2020 - Lecture XI
The SFR-density relation No. 1, 2003 STAR FORMATION IN SDSS 215
Gómez et al. (2003, SDSS)
2002MNRAS.334..673L
Negative tail due to stellar absorption
Fig. 4.—Left: Shaded area represents the distribution of corrected SFR (Hopkins et al. 2001) as a function of the projected local surface density of galaxies.
Right: The shaded area represents the distribution of SFRN (the normalized SFR; see text) as a function of the projected local surface density of galaxies. In
both plots, the top of the shaded area is the 75th percentile, while the bottom is the 25th percentile. The median is shown as a solid line. We have used all avail-
able galaxies in the SDSS EDR that satisfy our selection criteria. We have excluded galaxies near the edge of the survey and those that may have an AGN
present, based on the Kewley et al. (2001) prescription. Each bin contains 150 galaxies. These plots represents the density-SFR relation that is analogous to the
density-morphology relation of Dressler (1980). We note here that the SFRs presented here are not corrected for the 300 SDSS fiber aperture and are, therefore,
systematically lower, by a factor of $ 5, compared to total SFRs derived from the radio or by integrating the light from the whole galaxy (see A. M. Hopkins et
al., in preparation).
Lewis et al. (2002, 2dF) dispersion, in units of km s!1, using the formula as a function of clustercentric radius. As seen in Figures 3
Rv ’ 0:002!r h!1 100 Mpc from Girardi et al. (1998). For this and 4, the SFR of galaxies in dense regions differ from that
calculation, we used !r ð1Þ, as discussed in the Appendix. in the field in two ways: the whole distribution of SFRs (and
For consistency with the higher redshift work, we provide EWs) is shifted to lower values, and the skewness of the dis-
measurements for both the [O ii] and H" emission lines. In tributions decreases, with the tail of the distribution con-
Figure 6 we show the same as in Figure 5, but now for the taining high-SFR galaxies diminishing as one enters denser
SFR and SFRN of galaxies as a function of (projected) clus- environments. As discussed in x 3.1, this tail of strongly
tercentric radius. star-forming galaxies (H" EW > 5 Å) is dominated by late-
For comparison, we have also constructed a ‘‘ noncluster ’’ type galaxies. For comparison with higher redshift studies,
(or field) sample of galaxies that consists of all galaxies within the mean (median) of the H" and [O ii] EW distributions
our volume-limited sample that are located, in redshift space, within one virial radius of the clusters studied herein are 3.4
within 3:5!r of a cluster but are at a (projected) clustercentric (!0.7) and 3.2 (1.8) Å, respectively.
distance of greater than 25 Rv from any of our clusters. This The results in Figures 5 and 6 are qualitatively similar to
methodology guards against potential redshift selection those for distant (z $ 0:3) clusters of galaxies (Balogh et al.
effects and/or redshift evolution of the field population, 1997). A new aspect of our study, however, is that we can
because we have defined our field population in the same red- map this decrease in SFR all the way from the cluster cores
shift shells as the cluster galaxies. We note, however, that the into the field population. We have used the Kolmogorov-
difference in the mean (or median) SFR of galaxies of the field Smirnov (K-S) statistic to test the distributions of EWs and
population, as defined using our method, and that of taking SFRs in each radial bin of Figures 5 and 6 against the dis-
all galaxies, regardless of the presence of clusters, is less than tribution of EWs and SFRs derived from our field popula-
10% (with our mean SFR measurement being systematically tion. This test is designed to look for global differences
higher as expected). Our derived field values for the 25th and between two distributions and allows us to determine theStefano Zibetti - INAF OAArcetri - Astrophysics of Galaxies - Course 2019/2020 - Lecture XI
Clusters as evolutionary labs
✤ Environmental effects reach their maximum intensity
✤ Very high galaxy density
✤ Very high IGM density and temperature
✤ Evolution has proceeded extremely fast
✤ Probably not ideal for studying galaxy-galaxy interactions/mergers
due to the very high velocity dispersion (~1000 km/s); smaller groups
are better suited for thisStefano Zibetti - INAF OAArcetri - Astrophysics of Galaxies - Course 2019/2020 - Lecture XI
The realm of dwarf galaxies
✤ Some process(es) heavily affect the structure of galaxies, to the point
that a cluster-specific population of galaxies emerges: the dwarf
ellipticals (dE)
2005MNRAS.357..783T
Sandage, Binggeli &
Tamman (1985)
Credits Mihos
Trentham et al. (2005) (CWRU), JerjenStefano Zibetti - INAF OAArcetri - Astrophysics of Galaxies - Course 2019/2020 - Lecture XI
Properties of late-type galaxies
in clusters at z~0
✤ Late-type galaxies are the most affected by the harsh cluster
environment
✤ Most likely in the process of being transformed, but not fully
transformed yet (since they retain the late-type morphology)
✤ Are they different from field late-types?
✤ What indications do they give about the transformation mechanisms?Stefano Zibetti - INAF OAArcetri - Astrophysics of Galaxies - Course 2019/2020 - Lecture XI
HI properties
✤ In normal, isolated galaxies, the HI gas distribution extends beyond
the optical disk
✤ column densities ∼1020 atoms cm-2 observed at ∼1.8 times the
optical diameter, with a relatively flat radial distribution that
sometimes shows a central dip
✤ weakly bound and easy(ier) to remove than other components
✤ in fact, cluster galaxies have lower HI content than in fieldStefano Zibetti - INAF OAArcetri - Astrophysics of Galaxies - Course 2019/2020 - Lecture XI
HI properties
✤ HI deficiency parameter def(HI)=
logarithmic difference between
the observed HI mass and the
expected value in isolated
Boselli &
objects of similar morphological Gavazzi (2006)
type and linear size (Haynes &
Giovanelli, 1984)
✤ Galaxies with def(HI) ≤0.3 can be
treated as unperturbed objects
✤ Large fraction of HI-deficient
galaxies in clusters
✤ typically display truncated or
disturbed morphologyStefano Zibetti - INAF OAArcetri - Astrophysics of Galaxies - Course 2019/2020 - Lecture XI
Molecular gas (H2, CO)
✤ ~15% of total gas, but directly related to SF
✤ Environmental effect on molecular gas, directly affect SF
✤ Molecular content of cluster late-types appears normal
✤ molecular gas is much more bound than HI and not so extended:
hard to removeStefano Zibetti - INAF OAArcetri - Astrophysics of Galaxies - Course 2019/2020 - Lecture XI
Dust
21 cm HI
L. Cortese et al.: HeViCS. II. Truncated dust disks in HI-deficient spirals
(VLA)
NGC4567/68 NGC4330 NGC4424 NGC4388 NGC4569
defHI ∼0.13/0.38 defHI ∼0.80 defHI ∼0.97 defHI ∼1.16 defHI ∼1.47
g. 1. The optical (top), 250 µm (middle) and HI (bottom) maps for galaxies in our sample with different degrees of HI-deficiency.
Optical
(SDSS)
1′ 1′ 1′ 1′ 1′
250 µm
(SPIRE)
Fig. 3. The 350 µm flux per unit of 350 µm area (left)
21 cm HI and optical area
(VLA)(right) versus HI-deficiency. Symbols are as in Fig. 2.
our case. For λ > ∼ 100−200 µm, the dust emission does not come
Cortese
Fig. 1. The optical (top), et al.
predominantly(2010, and HHeViCS)
250 µm (middle) from I grains
(bottom) directly heated
maps for galaxies by sample
in our photons withassociated
different degrees of HI-deficiency.
with star formation activity, but from a colder component heated
by photons of the diffuse interstellar radiation field (e.g., Chini
et al. 1986; Draine et al. 2007; Bendo et al. 2010). Since this
colder component dominates the dust mass budget in galaxies,
g. 2. The ratio of the submm-to-optical diameters versus the trends here observed are likely not due to a reduction in the
-deficiency in the three SPIRE bands. Squares are for Sa-Sab, intensity of the ultraviolet radiation field, but they imply that in
ars for Sb-Sbc and hexagons for Sc and later types. For comparison, HI-deficient galaxies the dust surface density in the outer parts
e triangles show the same relation for the HI-to-optical diameter of the disk is significantly lower than in normal spirals.
✤ Dust truncation follows HI
tio, where the HI isophotal diameters are taken at a surface density
An alternative way to compare the properties of normal
vel of 1 M⊙ pc−2 (Chung et al. 2009). Fig. 3. The 350 µm flux per unit of 350 µm area (left) and optica
truncation: dust and HI are and gas-poor Virgo spirals is to look(right) at their
versussubmm-to-near-
infrared colours. Since the K-band is an ideal proxy for the stel-
HI-deficiency. Symbols are as in Fig. 2.
swept together?
vironment has already been proven (e.g., Vollmer 2009). lar mass and the SPIRE fluxes provideour
o, the difference in the dust distribution between gas-poor and dust mass, it is interesting to investigate Boselli
an case. For λ >
indication
predominantly
&starGavazzi
∼ 100−200
of the
from grains
µm, the dust emission does not c
total
(2006)directly heated by photons assoc
with how the f (250)/
formation activity,f (K)
but from a colder component he
s-rich spirals observed here is likely due to the effect of the and f (500)/ f (K) flux density ratios vary with
by photons defHI .interstellar
of the diffuse We radiation field (e.g., C
uster environment and is not just related to the intrinsic prop- find that highly HI-deficient galaxieset have al. 1986; Draine et
f (250)/ al. 2007;
f (K) and Bendo et al. 2010). SinceStefano Zibetti - INAF OAArcetri - Astrophysics of Galaxies - Course 2019/2020 - Lecture XI
Star formation
✤
Fraction of star-forming vs properties of
star-formation
✤
is the “mode” (intensity and/or spatial
extent) of star formation modified in the
cluster environment or is it just an on-off
switch?
Hα truncation radius
Distribution of individual Hα EW measurements in the Virgo
Cluster along the Hubble sequence (small circles), and of the
Top row, r-band continuum images with superposed HI isophotal contours adapted
median Hα EW in bins of Hubble type. Large circles with error
from Cayatte et al. (1990); middle, Hα NET images; bottom, r and Hα (NET) surface
bars are drawn at the 25th and 75th percentiles of the distribution.
brightness profiles (filled and open circles, respectively) for two galaxies in the Virgo
Filled circles represent (unperturbed) objects, and open circles
Cluster: the normal VCC 92 (NGC 4192) and the deficient VCC 1690 (NGC 4569).
give (HI–deficient) galaxiesStefano Zibetti - INAF OAArcetri - Astrophysics of Galaxies - Course 2019/2020 - Lecture XI
Hα (i.e. SFR) truncation
correlates with def(HI)
Ratio of the optical to Hα radius vs. the HI deficiency of late-type
galaxies in the Virgo Cluster. The Hα isophotal radius is computed
within 10−16.5 ergs cm−2 s−1 Å−1 arcsec−2, and the r-band isophotal
radius is within 24 mag arcsec−2 (Gavazzi et al. 2006).
A radial
dependence
within 1Mpc?Stefano Zibetti - INAF OAArcetri - Astrophysics of Galaxies - Course 2019/2020 - Lecture XI
Morphological segregation in
velocity No. 2, 2001 GALAXY POPULATIONS AND EVOLUTION. I.
✤ The late-type populations in
clusters displays broader velocity
distribution than ETG (reminiscent
also of the broader spatial
distribution) [e.g. Biviano+1997;
Binggeli+1987,1993;
Conselice+2001; Colless&Dunn
1996]
✤ LTGs not yet fully virialized?
✤ dE’s similar to Spirals
FIG. 5.ÈVelocity histograms for the Virgo ““ core ÏÏ population, with Ðtted Gaussian proÐles. The galaxies here are the subsample oStefano Zibetti - INAF OAArcetri - Astrophysics of Galaxies - Course 2019/2020 - Lecture XI
Anaemic and fading spirals
NGC4921
✤ “Anaemic” spirals (van den Bergh 1976)
✤ low arm-interarm contrast
✤ gas poor, low SF activity
✤ redder colors than spirals, but similar B/T
✤ inhabit cluster outskirts (Goto et al. 2003) Spirals
✤ Result from removing gas from normal spirals?
✤ Link in the transformation from Spirals to S0’s?
✤ Unlikely: present day Spirals are structurally S0
different from S0Stefano Zibetti - INAF OAArcetri - Astrophysics of Galaxies - Course 2019/2020 - Lecture XI
Conclusions
✤ Galaxy transformations in clusters are VERY COMPLEX
✤ Result from a number of mechanisms involving dynamics and
hydrodynamics of multiple phases
✤ Interactions with the IGM appear to dominate the transformation of
late type galaxies in present day clusters, but the efficiency of such
mechanisms is very inter-dependent on all the other mechanismsYou can also read