Local Morphological Measures Confirm that Folding within Small Partitions of the Human Cortex Follows Universal Scaling Law
←
→
Page content transcription
If your browser does not render page correctly, please read the page content below
Local Morphological Measures Confirm that
                                                Folding within Small Partitions of the Human
                                                    Cortex Follows Universal Scaling Law

                                                   Karoline Leiberg1 , Christoforos Papasavvas1 , and Yujiang Wang1
arXiv:2103.14061v1 [q-bio.NC] 25 Mar 2021

                                                  Newcastle University, Newcastle upon Tyne NE1 7RU, United Kingdom

                                                  Abstract. The universal scaling law of cortical morphology describes
                                                  cortical folding as the covariance of average grey matter thickness, pial
                                                  surface area, and exposed surface area. It applies for mammalian species,
                                                  humans, and across lobes, however it remains to be shown that local cor-
                                                  tical folding obeys the same rules. Here, we develop a method to obtain
                                                  morphological measures for small regions across the cortex and correct
                                                  surface areas by curvature to account for differences in patch size, result-
                                                  ing in a map of local morphology. It enables a near-pointwise analysis of
                                                  morphological variables and their regional changes due to processes such
                                                  as healthy ageing. We confirm empirically that the theorised covariance
                                                  of morphological measures still holds at this level of local partition sizes
                                                  as predicted, justifying the use of independent variables derived from
                                                  the scaling law to identify regional differences in folding, subject-specific
                                                  abnormalities, and local effects of ageing.

                                            1    Introduction
                                            Cortical morphology is a useful imaging-based biomarker for a range of applica-
                                            tions, including aging and disease. Measures that describe the shape and folding
                                            of a brain, such as gyrification and cortical thickness, are being used both over
                                            the entire cortex and locally to identify differences in individuals and cohorts of
                                            subjects [1–4]. Such measures are often studied separately, without taking their
                                            interaction into account.
                                                Only recently, a universal scaling law describing the interaction of cortical
                                            morphology measures has been proposed [5]. This scaling law captures the folding
                                            of the cortex as the covariance between the measure of average cortical thickness
                                            T , total pial surface area At and exposed surface area Ae in the equation
                                                                                √
                                                                             At T = kA1.25e   ,                             (1)

                                            where k is a constant. Empirically, k varies slightly between age groups, and has
                                            been interpreted as the tension/pressure applied to the cortical surface [8]. This
                                            relation has been shown to hold for different mammalian species [5], in human
                                            hemispheres [8], and within human cortices across the lobes [9]. It says that the
                                            three variables are interdependent. For example, if two brains of a similar age
                                            have the same total area, but one is thicker, it will also have more exposed area
2       K. Leiberg et al.

- and hence less gyrification. The scaling law can be visualised by the analogy of
crumpling a piece of paper into a ball: the thickness of the paper, its total area
and the force used to crush it determine the exposed surface area of the ball [5].
    The scaling law additionally allows us to derive three linearly independent,
interpretable morphological variables as linear combinations of log T 2 , log At and
log Ae [7]:
                                       1          5
                        K = log At + log T 2 − log Ae ,                           (2)
                                       4          4
                            I = log At + log T 2 + log Ae ,                         (3)
                              3         9         3
                        S=      log At − log T 2 + log Ae .                         (4)
                              2         4         4
K is derived directly from Eq. (1) by taking logarithms and arranging for log k.
It is a measure of tension/pressure acting on the cortex, or, in the analogy, pres-
sure applied to the paper ball. I describes the overall size of the brain or paper
ball. Changes in I correspond to an isometric scaling of the cortex. Lastly, S is
the inner product of K and I that contains information about shape; it can be
thought of as the “folding technique” of the paper ball. Using K, I, and S avoids
covarying variables, whilst keeping them interpretable. Otherwise, analysing cor-
tical thinning without accounting for surface area changes could miss signs of
atrophy that can be discovered when accounting for the covariance [7].
    However, one distinct challenge remains in regionalising these independent
measures of cortical morphology, K, I, and S. It is clear that the scaling law
cannot hold for arbitrarily small regions. The goal of this paper is to show that
the scaling law still holds for areas smaller than lobes, defined independently of
them. We first develop a method to find the raw variables T , At , and Ae in small
patches across the cortex, and correct the surface areas so they are independent
of the size chosen for patches. This allows us to compare the folding within the
regions to that of other partitions of the cortex or even the full hemisphere [9].
    If local cortical folding follows the scaling law, it justifies the use of K, I, and
S for further morphological analyses. For example, we will show that they can
be used to get a better understanding of regional age-related cortical atrophy.

2     Methods

2.1   MRI data and processing

To asses the rules of local cortical folding in a cohort of healthy subjects in
a large age range, we used the NKI Rockland Sample data (http://fcon 1000.
projects.nitrc.org/indi/pro/nki.html [6]).
    The MRIs were preprocessed with the FreeSurfer 6.0 recon-all pipeline to
obtain the fine, triangular mesh representing the grey matter surface, as well
as the grey matter thickness on each point of the mesh. We then ran the local
gyrification index processing stream to obtain the outer smooth (exposed) pial
surface.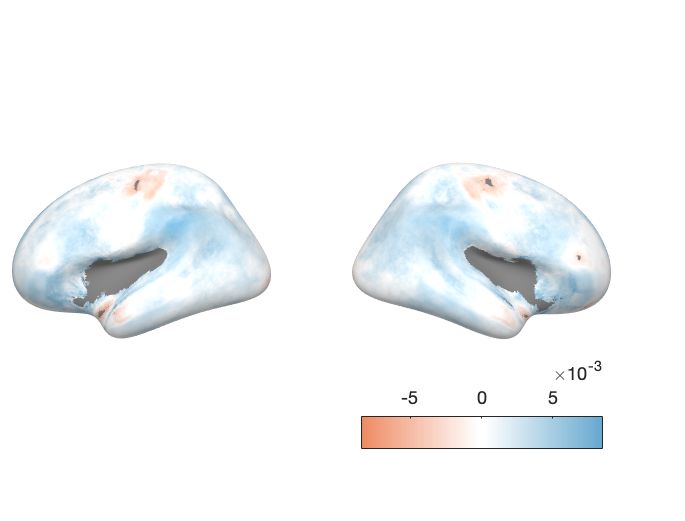
Folding within Small Partitions of the Cortex Follows Universal Scaling Law 3
Out of the 929 subjects for whom data was available, 95 subjects were re-
jected due to inadequate image quality, motion artifacts or parts of their grey
matter missing. We performed visual quality inspections on a random sam-
ple of 50 subjects and applied manual corrections where needed. We deemed
overall image quality and FreeSurfer processing to be adequate. The remain-
ing sample consists of 834 subjects, 508 female and 326 male, in an age range
from 6 to 85 years. A full list of subjects used can be found on github (https:
//github.com/KarolineLeiberg/folding pointwise).
2.2 Extraction of local morphological measures
The following describes the method in which morphological measures were com-
puted for each point on the pial surface. The full code is available on github:
https://github.com/KarolineLeiberg/folding pointwise.
The pial surface and smooth pial surface are reduced to 5% and 10% of
their original resolution respectively, using the downsampling function of the
MATLAB iso2mesh toolbox. This retains the main features of cortical folds, but
reduces the number of vertices in the pial to about 7000 per hemisphere.
The thickness map is converted from the original pial surface to the downsam-
pled pial by assigning the value of the nearest pial vertex for each downsampled
pial point. The pial thickness is subsequently transformed from being a pointwise
measure to a measure for each face in the mesh (https://github.com/cnnp-lab/
CorticalFoldingAnalysisTools).
Then, for each point p on the downsampled pial surface, a local patch around
p is defined as all vertices within a radius of 25mm, measured as Euclidean
distance, that are directly connected to p through neighbouring points which
are also in the patch - this is to avoid e.g. disconnected patches across two gyri
that are very close to each other, but the connecting sulcus is not included.
A visualisation of the process can be found in Figure 1 a-c. A corresponding
smooth patch is defined by first finding the nearest downsampled pial point for
each downsampled smooth pial point, and then including smooth pial points if
their neighbouring pial point is in the patch. (Fig. 1 d).
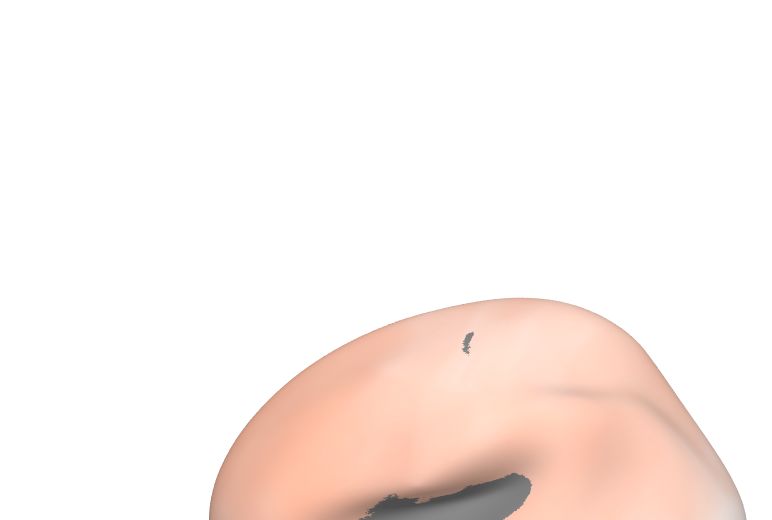
a b c d
Fig. 1. Defining a patch on the pial around a point. a-c Extracts of the process of
adding neighbouring points to the patch. c The final pial surface patch around this
point. d The corresponding patch on the smooth pial.
The total surface area Apt for the patch around p is then computed as the
sum of all triangular faces of the downsampled pial which are contained in p’s
4       K. Leiberg et al.

patch. Similarly, the average cortical thickness T p is the average thickness across
those faces. The exposed surface area Ape is computed as the sum of face areas
within the patch on the downsampled smooth pial.
    A convex hull is fitted over p’s downsampled smooth pial patch, and
the integrated Gaussian Curvature of the patch around p is approximated
as the sum of Gaussian curvatures of all points on the convex hull which
do not lie on the edge of the smooth patch (https://github.com/cnnp-lab/
CorticalFoldingAnalysisTools).
    Having computed the morphological measures for regions around each point
on the downsampled pial surface, the data is converted back to the original, full
pial, again using values of the nearest neighbour. This is done so the data can
later be projected to the FreeSurfer average subject to compare across subjects.

2.3   Surface area reconstruction

As shown in Wang et al. [9], the size of regions into which a cortex is partitioned
fully determines its surface areas and thus its location in the space of At , Ae
and T , making it impossible to compare patches to each other and infer whether
they align on the plane predicted by the scaling law. Each patch’s surface areas
are thus reconstructed to what they would be if the patch was a full hemisphere
of the same gyrification index, using the proportion of curvature it contains,
approximated via its convex hull. This correction is done using the formulas [9]

                                              4π
                                 A0p   p
                                  t = At ∗     p ,                              (5)
                                              IG

                                              4π
                                 A0p   p
                                  e = Ae ∗     p ,                              (6)
                                              IG

where Apt and Ape are the total and exposed surface areas of patch p before
correction, and A0p        0p
                  t and Ae are the values after correction using the integrated
                      p
Gaussian curvature IG over p. This correction of a patch’s surface areas by its in-
tegrated Gaussian curvature preserves its average cortical thickness, gyrification
index, and the average Gaussian curvatures of its total and exposed areas [9].
    Points that lie on particularly flat parts of the cortex or have very small
surface areas tend to have convex hulls with integrated curvatures close to zero.
In such cases, the correction of the surface areas leads to an overcorrection,
inflating the surface area to unreasonably large values. For simplicity, we will
exclude these points from our analysis, choosing not to investigate if they also
obey the scaling law at this stage. All points within 10mm to the left and right of
the midline of the brain and all points with a curvature below 0.16 are excluded.
We will discuss later on how future work may be able to investigate these more
challenging parts of the cortex, where the Gaussian curvature of the convex hull
is not a good representation of the proportion of the patch of interest.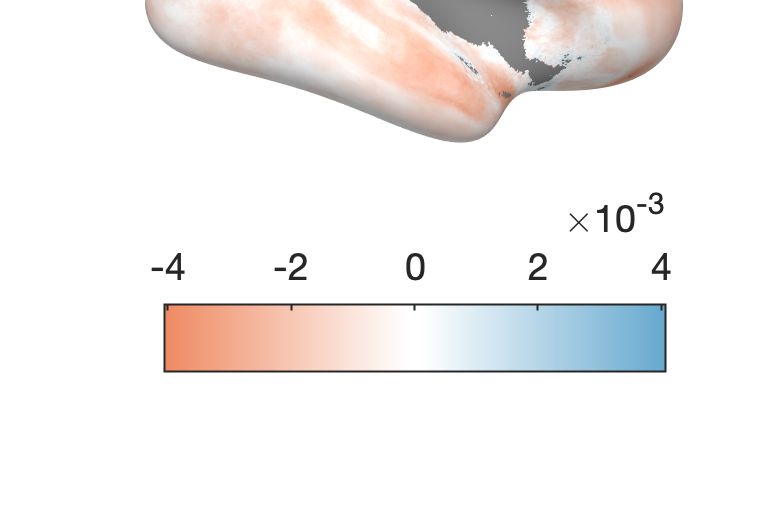
Folding within Small Partitions of the Cortex Follows Universal Scaling Law       5

2.4   Fitting the scaling law within subjects

We assess if local folding follows the scaling law by regressing within each subject
over all patches in the two-dimensional projection of the scaling law, where

                                   X = log A0p
                                            e ,                                 (7)
                                            √
                                Y = log(A0p
                                         t    T p ).                            (8)
Here, A0p        0p                                                        p
        t and Ae are the surface areas after correcting by curvature, T is the
observed thickness. The slope of the regression is a subject-specific estimation
of the exponent of Ae in Eq. (1). We verify if each subject’s local folding follows
the scaling law by seeing how close the slope is to 1.25.

2.5   Local age effects

To quantify the effect ageing has on morphology in the raw measures and in the
independent variables, we used the FreeSurfer function mri surf2surf to convert
all subjects’ morphology maps (i.e. pial surfaces with morphological measures
computed at each point) to the same surface space, where they can be compared
and analysed as a group. We compute the independent variables K, I, and S
on each point of the pial surface. We then fit linear regression models pointwise
across all subjects, including both sex and age as covariates. Points represented
in fewer than 10 subjects of either sex were excluded to ensure the regression
was representative of the population. We then use the coefficient of the ageing
covariate at each point and for each variable as an indicator of the local effect
of age-related atrophy on that measure.

3     Results

3.1   Surface area reconstruction by Gaussian curvature breaks down
      in insula and on midline

We apply Gaussian curvature corrections (Eq. (5),(6)) to all points to reconstruct
surface areas of patches to what they would be for a full hemisphere, but find
that some points have approximately zero integrated Gaussian curvature (Fig. 2a
shows the convex hull over one example patch). When we look across all points
of the cortex, we observe a distinct subset of points that display zero curvature
(Fig. 2b). These points are usually located in the insula or particularly deep
sulci, where the patch has a small, overall convex, exposed surface, or on the
midline, where the exposed surface might be large, but very flat. The midline
additionally contains points with very large curvature, where the convex hull
over a patch can contain an angle of 90° or more.
    Correcting points by extremely small curvatures leads to overcorrections
(Fig. 2c): Whilst most points naturally align in the X-Y -plane (Eq. (7),(8))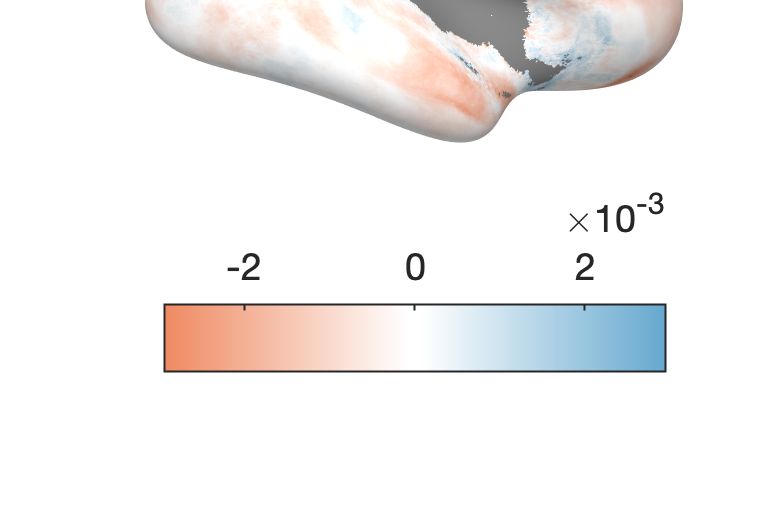
6                                     K. Leiberg et al.

with a slope of 1.25 after the surface areas are reconstructed, points with curva-
tures near zero are being overcorrected to the top-right of the plot. For simplic-
ity, we therefore exclude these points from our further analysis, acknowledging
that Gaussian curvature of the convex hull is not a good representation of the
proportion of those patches. This affects around 20% of all points on the pial
surface.

         a                                                                      c
                                                                                                       Before correction                 Included
                                                                                                       After correction                  Excluded
                                                                                               8
                                                                                                                          slope = 1.25

                                                                                               7

         b

                                                                               log10 (At �T)
                                                                                               6
                                      12
      Proportion of vertices (in %)

                                      10
                                                                                               5
                                      8

                                      6
                                                                                               4
                                      4

                                      2                                                        3

                                      0
                                           0        1          2         3                         3           4          5       6         7
                                               Integrated Gaussian curvature                                         log10 Ae

Fig. 2. Gaussian curvature and its effect on reconstructing surface areas in one example
subject. a Example of patch with zero curvature. b Distribution of curvature across
patches. c Sample of 150 patches plotted in the X-Y-plane, both before (round marker)
and after (asterisk) surface area corrections. Yellow lines with slope 1 indicate the shift
of points caused by the curvature corrections. Green points are included in further
analysis, purple points are excluded due to their low curvature or position relative to
the midline. The black line is a regression line through the green points after correction.

3.2           Local folding follows scaling law
To verify whether the scaling law still applies in small patches of the cortex,
meaning if the measures of T , At , and Ae covary locally as predicted, we fit
the scaling law within subjects, estimating the slope between points in X and
Y as described in Eq. (7) and (8). We find that the slope for each subject, i.e.
the subject-specific estimates of the coefficient of Ae in Eq. (1), are distributed
around a mean of 1.23 (Fig. 3), only slightly lower than the observed coefficient
of 1.25 for hemispheres and lobes. This shows that the scaling law still holds at
this level of patch sizes, meaning that when looking at small, local regions of
the cortex with spherical radii of 25mm, the average thickness, total area and
exposed area covary predictably according to Eq. (1). Note that the subjects
follow the scaling law without any age or sex corrections, because age differences
only affect the scaling law intercept (K), but not the slope [8].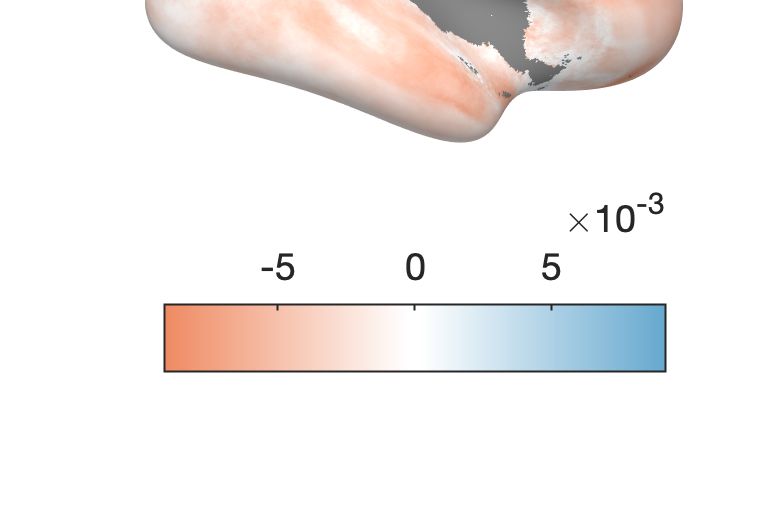
Folding within Small Partitions of the Cortex Follows Universal Scaling Law          7

                                       120
                                                   median = 1.23

                  Number of subjects
                                       80

                                       40

                                        0
                                             1.1   1.15     1.2      1.25   1.3
                                                      Scaling law slope

Fig. 3. Distribution of slopes observed in subjects when fitting a regression through
points across the cortex in the X-Y -plane. The black line marks the median of observed
slopes.

3.3   K, I and S have additional value when observing ageing effects
As we have seen, the folding follows the scaling law even locally, which implies
that K, I, and S are theoretically independent. We convert to these variables to
see if they add insight to the differences in local morphology.
    When we look at the effect of healthy ageing on local morphology, we see a
decrease in the raw variables At , Ae , and T at varying rates in most areas of the
brain (Fig. 4 a-c). A decrease in surface areas can be interpreted as a flattening of
the cortex, since less surface area within a constant radius indicates less folding.
The independent variables show an isometric shrinking of most areas, with an
overall loss of tension (Fig. 4 d-e).
    In the raw variables, we do not see systematic differences in how the areas
around the upper and lower precentral gyrus are affected by atrophy. We do
however see such a difference in the shape term S (Fig. 4f): S decreases in the
upper precentral gyrus with ageing, but the lower part is relatively unaffected.
This is one example of the added value from switching to independent variables;
we gain information otherwise hidden in the covariance of At , Ae , and T .

4     Discussion
On a big data set covering a large age range, we have demonstrated that the local
folding of the brain follows the universal scaling law, meaning the grey matter
thickness, total surface area and exposed surface area in small regions covary
according to the same rule as the whole cortex. This result extends previous
work done in this area, which had shown that morphology in full hemispheres
and lobes adheres to the scaling law, by confirming empirically that the minimum
size of regions for which the folding rule applies has a radius of under 25mm.
    Our method works well for most of the cortex. However, we had to exclude
around 20% of points on the pial surface from our analysis, predominantly lo-
cated on the midline and in the insula. For these points, we founds that the
Gaussian curvature was not an adequate representation of the proportion of
8       K. Leiberg et al.

    a                          b                             c
          Thickness (T)                 Total area (At)             Smooth area (Ae)

            log(mm)/year                 log(mm2)/year                 log(mm2)/year

    d                          e                             f
         Tension term (K)             Isometric term (I)             Shape term (S)

            change/year                  log(mm3)/year                 change/year

Fig. 4. Local effects of healthy ageing in the left and right hemisphere. a-c Raw vari-
ables T , At , and Ae (logged). d-f Independent variables K, I, and S.

the patch. For future iterations of the method, we plan to improve on this. An
alternative way to approximate patch curvature would be to compute the inte-
grated curvature of the patch’s smooth pial surface, rather than its convex hull.
However, this surface may already contain too much local information of folding
for our purpose. Another idea is to inflate the pial surface to a sphere and use
the proportion of surface area or curvature of the patch’s representation on the
sphere for corrections.
    Another improvement of the method could be achieved by making the radius
defining the patch around each point on the pial adaptive depending on the thick-
ness at that point. This flexible way of patch definitions uses the smallest radius
required to find enough exposed surface area at each point, making the morpho-
logical map as close to pointwise as possible. We expect the ideal patch radii
to be around 20-30mm for human brains (spanning at least one sulcus/gyrus),
which is why we chose a value in this range for the fixed-size method.
    The local applicability of the scaling law allows us to use it in terms of
independent components derived from it, to further analyse local morphology.
In our results we have shown local differences in how the cortex is affected by
the process of ageing in the independent variables, which were not clear from the
raw variables alone. Our method could have other practical applications, such
as finding local abnormalities in patient groups compared to a control cohort,
indicating regional effects of dysfunction. It might also be used to detect subject-
specific abnormalities, indicating areas of the brain that fold atypically.

Acknowledgements. KL was supported by the Centre for Doctoral Training
in Cloud Computing for Big Data (EP/L015358/1). We thank the members of
CNNP lab (www.cnnp-lab.com) and Bruno Mota for discussions of the method
and results.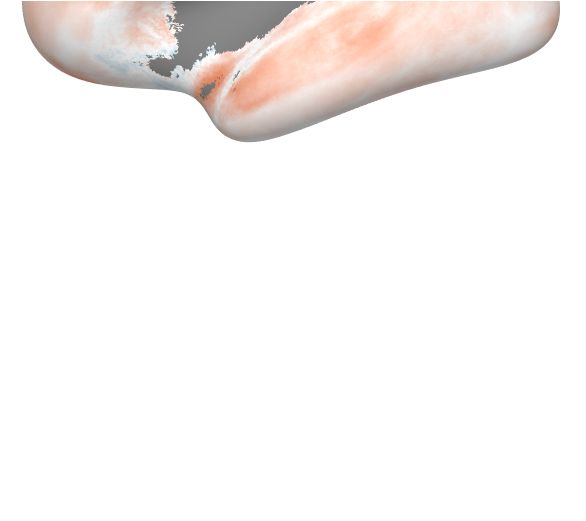
Folding within Small Partitions of the Cortex Follows Universal Scaling Law           9

References
1. Chaudhary, S., Kumaran, S.S., Goyal, V., Kaloiya, G.S., Kalaivani, M., Jagan-
   nathan, N.R., Sagar, R., Mehta, N., Srivastava, A.K.: Cortical thickness and gyri-
   fication index measuring cognition in Parkinson’s disease. International Journal of
   Neuroscience pp. 1–10 (may 2020)
2. Frangou, S., Modabbernia, A., Williams, S.C.R., Fuentes-claramonte, P., Glahn,
   D.C.: Cortical thickness across the lifespan : Data from 17 , 075 healthy individuals
   aged 3 – 90 years. Human Brain Mapping (November 2020), 1–21 (2021)
3. Galovic, M., Van Dooren, V.Q., Postma, T.S., Vos, S.B., Caciagli, L., Borzı̀, G.,
   Cueva Rosillo, J., Vuong, K.A., De Tisi, J., Nachev, P., Duncan, J.S., Koepp, M.J.:
   Progressive Cortical Thinning in Patients with Focal Epilepsy. JAMA Neurology
   76(10), 1230–1239 (oct 2019)
4. Libero, L.E., Schaer, M., Li, D.D., Amaral, D.G., Nordahl, C.W.: A Longitudinal
   Study of Local Gyrification Index in Young Boys With Autism Spectrum Disorder.
   Cerebral Cortex 29(6), 2575–2587 (jun 2019)
5. Mota, B., Herculano-Houzel, S.: Cortical folding scales universally with surface area
   and thickness, not number of neurons. Science 349(6243), 74–77 (jul 2015)
6. Nooner, K.B., Colcombe, S.J., Tobe, R.H., Mennes, M., Benedict, M.M., Moreno,
   A.L., Panek, L.J., Brown, S., Zavitz, S.T., Li, Q., Sikka, S., Gutman, D., Bangaru,
   S., Schlachter, R.T., Kamiel, S.M., Anwar, A.R., Hinz, C.M., Kaplan, M.S., Rachlin,
   A.B., Adelsberg, S., Cheung, B., Khanuja, R., Yan, C., Craddock, C.C., Calhoun,
   V., Courtney, W., King, M., Wood, D., Cox, C.L., Kelly, A.M., Di Martino, A.,
   Petkova, E., Reiss, P.T., Duan, N., Thomsen, D., Biswal, B., Coffey, B., Hoptman,
   M.J., Javitt, D.C., Pomara, N., Sidtis, J.J., Koplewicz, H.S., Castellanos, F.X.,
   Leventhal, B.L., Milham, M.P.: The NKI-Rockland sample: A model for accelerating
   the pace of discovery science in psychiatry. Frontiers in Neuroscience 6(OCT) (2012)
7. Wang, Y., Leiberg, K., Ludwig, T., Little, B., Necus, J.H., Winston, G., Vos, S.B.,
   de Tisi, J., Duncan, J.S., Taylor, P.N., Mota, B.: Independent components of human
   brain morphology. NeuroImage 226, 117546 (feb 2021)
8. Wang, Y., Necus, J., Kaiser, M., Mota, B.: Universality in human cortical folding in
   health and disease. Proceedings of the National Academy of Sciences of the United
   States of America 113(45), 12820–12825 (nov 2016)
9. Wang, Y., Necus, J., Rodriguez, L.P., Taylor, P.N., Mota, B.: Human cortical folding
   across regions within individual brains follows universal scaling law. Communica-
   tions Biology 2(1), 1–8 (dec 2019)
You can also read