Logistics in the Americas - ALACAT Congress 2018
←
→
Page content transcription
If your browser does not render page correctly, please read the page content below

Logistics in the Americas
June, 2018
Introductions
Peter Sozou

                                Partner, M&A Transaction Services
                                Transportation Sector Leader

                                             https://www2.deloitte.com/ca/en/profiles/peter-sozou.html
                                             https://www.linkedin.com/in/peter-sozou-240208/
                                             @peter_sozou

   •   Peter is a Partner within the Deloitte M&A Advisory practice. Peter is focused on serving clients who
       invest in the transportation and logistics sectors and recent and ongoing advisory and transaction
       services engagements include businesses focused on Truckload and Less-than-truckload services,
       specialized trucking services, 3PL, freight forwarding, warehousing and distribution, trade advisory
       services, customs brokerage and route-based waste disposal services.
   •   Peter has also been involved as a core team member, representing marquee Canadian trucking
       participants, of the SG&A Benchmarking Study for the North American Trucking Industry, run by the
       firm’s Global Benchmarking Centre, and has been a key contributor to the firm’s recent editions of the
       Supply Chain Update.
   •   Peter has also had the opportunity to participate in engagements for the firm’s leading transportation
       clients as part of cross-service line teams.

© 2017 Galaz, Yamazaki, Ruiz Urquiza, S.C.                                                                      Comité Directivo FY17   2
An overview of Logistics in the Americas

        1             “Where we are today” - Impacts on Global Trade Flows   04

        2
                      A snapshot of the Global Logistics landscape & key
                      industry drivers                                       09

        3             How technology is disrupting the industry              11

        4             Changing Trade flows in the Americas                   13

        5             Select highlights of the Americas Logistics market     16

        6             Key trends in Freight Forwarding                       22

        7             Global Deal Flow                                       24
© 2018 Deloitte Asesoría Financiera, S.C.                                     3
                                                                              2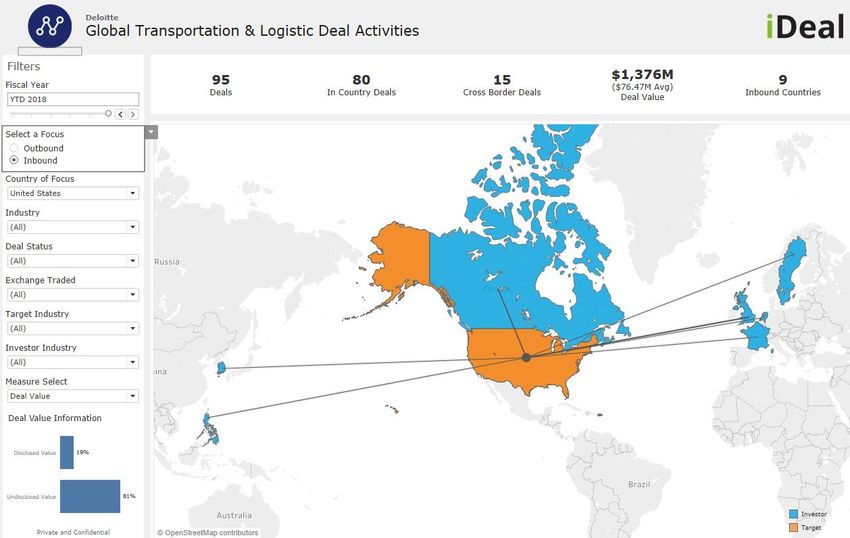
1         “Where we are today” - Impacts on Global Trade Flows

                                                            1.   1. Donald Trump, US
                                                                 president

                                                            2.   John Bolton, US national
                                                                 security adviser

                                                            3.   Kazuyuki Yamazaki,
                                                                 Japanese senior deputy
                                                                 minister for foreign affairs

                                                            4.   Shinzo Abe, Japan's prime
                                                                 minister

                                                            5.   Yasutoshi Nishimura,
                                                                 Japanese deputy chief
                                                                 cabinet secretary

                                                            6.   Yasutoshi Nishimura,
                                                                 Japanese deputy chief
                                                                 cabinet secretary

                                                            7.   7. Emmanuel Macron,
                                                                 French president

                                                            8.   Theresa May, UK prime
                                                                 minister

                                                            9.   Larry Kudlow, director of
                                                                 the US National Economic
                                                                 Council

Source: https://www.bbc.com/news/world-us-canada-44426442
© 2018 Deloitte Asesoría Financiera, S.C.                                                4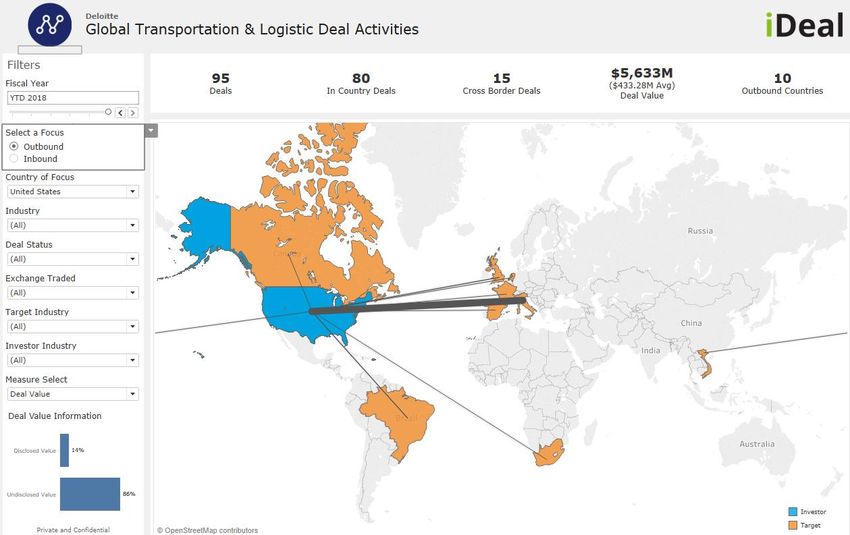
1          “Where we are today” - Impacts on Global Trade Flows

                                              Global goods commerce will
                                              continue to grow in 2018 and
            Expected growth for 2018                      2019                   In June USA imposed tariffs
           in the developing countries:                                            on steel and aluminum to
                 • Exports 5.4%                                                      Mexico, 25% and 10%,
                • Imports 4.8%                                                            respectively

                                                                                              Canadian Prime Minister feels
Global commerce will                                                                           positive about the NAFTA
grow ~4.4% this year                                                                                   trade pact

                                                                                                 Tension started with the
    Main risk to global                                                                          announcing tariffs USA
       economy and                                                                             issued over products from
     commerce is the                                                                             China and the European
      protectionism                                                                                      Union.

                                                                             Threats of USA applying ~$150 billion on
               Exceptions on tariffs were          WTO General Director
                                                                                           tariffs to China
               granted to some countries              advise on the
                                                                              China responded with threats of ~$50
                                                    consequences of a
                                                                                     billion on tariffs to USA
                                                   “commercial war”

  © 2018 Deloitte Asesoría Financiera, S.C.                                                                                   5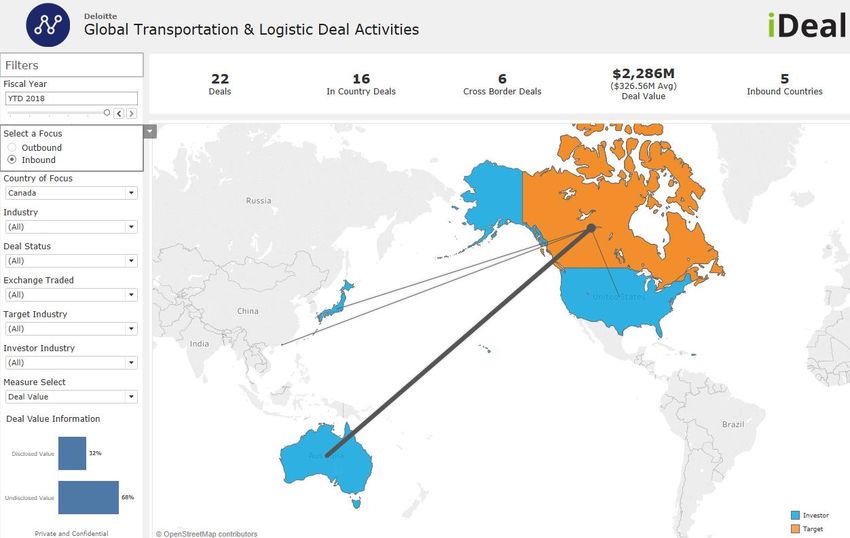
1         “Where we are today” - Impacts on Global Trade Flows
                          Is this what International Trade is starting to feel like?

Source: Toledo PE Supply

© 2018 Deloitte Asesoría Financiera, S.C.                                              6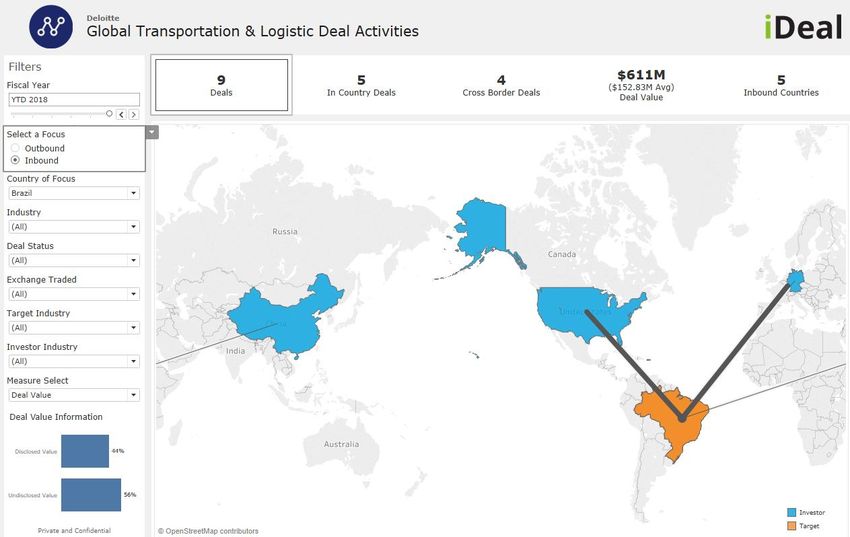
1         “Where we are today” - Impacts on Global Trade Flows
                                A quick recap on developments for Global Tariffs?
 Section 201 Safeguard tariffs (Feb, 2, 2018)
 Tariff Rate Quota against any country importing certain products into the US:
 • Imported Solar Cell/ Modules,
 • Residential washing machines and parts

    Section 232 National security tariffs (Mar 23,2018)
    • The US added 25% tariffs on steel and 10% tariffs on aluminum imports from all nonexempt countries
           • Certain types of companies can file for exclusions by product (separate exclusion by product required) –
               valid for 1 year.
    • Subsequently, China announced effective April 2, 2018 they will apply tariffs to 128 products imported from
        the United States.
           • An additional tariff rate of 15% applies to most commodities, including fruits.
           • A 25% tariff rate will apply to 8 items, including pork.
    • On May 31, the U.S. announced that Canada, Mexico, and the EU will be removed from the exemption list
        effective midnight, June 1.
    • Per CSMS# 18-00372, as of June 1, 2018, all countries will be subject to the 232 tariffs except Argentina,
        Australia, Brazil, and South Korea for steel; for aluminum, all countries will be subject except Argentina and
        Australia.
    • Additionally, absolute quota will be applicable for imports from Argentina, Brazil, and South Korea for steel
        imports; and to Argentina for aluminum imports as of June 1, 2018.

© 2018 Deloitte Asesoría Financiera, S.C.   Source: http://blog.chrobinson.com/global-forwarding/china-tariffs-trade-policy-whats-going/   7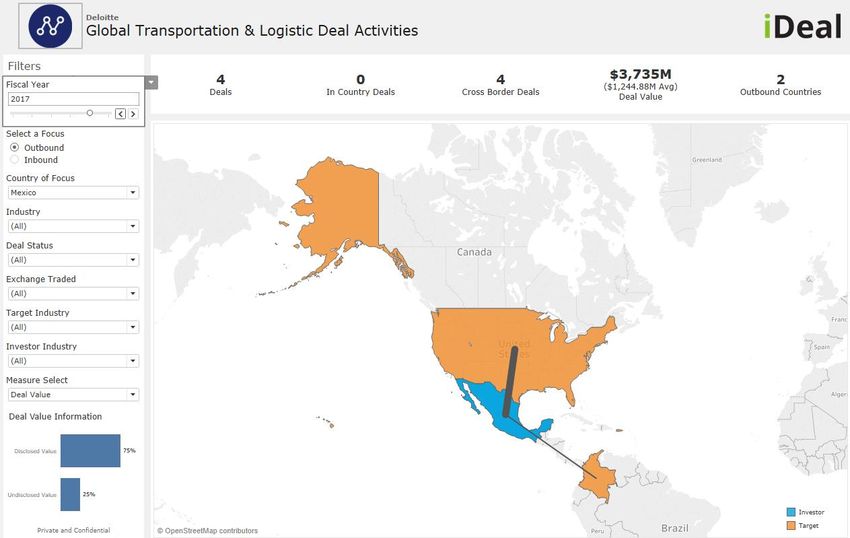
1         “Where we are today” - Impacts on Global Trade Flows
          Source: http://blog.chrobinson.com/global-forwarding/china-tariffs-trade-policy-whats-going/

  Section 301 Unfair trade practice tariffs (Mar 22, 2018)
  • On March 22, 2018, the U.S. announced potential tariffs on 1,300 products of Chinese origin, including:
         Chemicals, Pharmaceutical products, Rubber products
         Metals, including iron and steel
         Nuclear reactors, boilers, machinery, and equipment, Electrical machinery, Rail locomotives, rolling stock,
         and equipment, Automotive and other vehicles, as well as parts
         Aerospace products and parts
         Ships and boats, Other parts and components for automotive, aircraft, and ships
  • In response to the proposed 301 tariffs, China announced that a 25% tariff rate will apply to a list of goods
      in 106 categories, including U.S. soybeans, cars, and planes (to name a few), worth about U.S. $50 billion.
      This would only go into effect if the U.S. implements the 301 tariffs and is subject to change by China
      officials.
  On May 29, the U.S. announced that Section 301 tariffs will now move forward, with a final list of tariffs to be
  made available on June 15; implementation of these tariffs will follow shortly thereafter.
  On June 1, the U.S. imposed tariffs to Mexico, the European Union and Canada on imports of steel and
  aluminum to Mexico, 25% and 10%, respectively

© 2018 Deloitte Asesoría Financiera, S.C.                                                                              8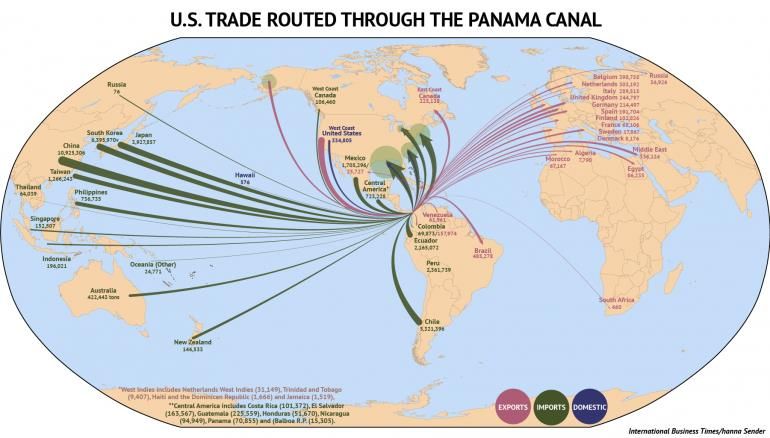
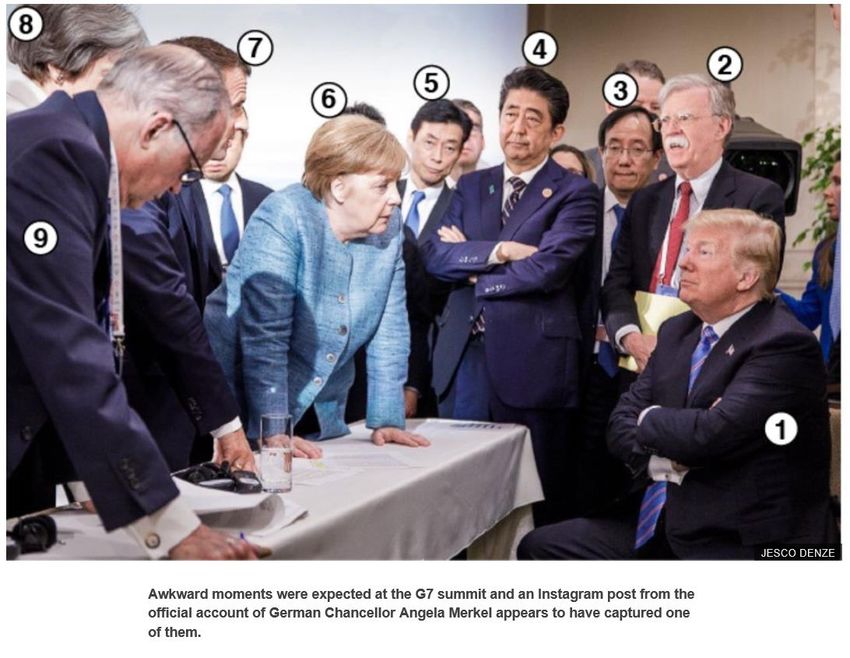
2 A snapshot of the Global Logistics landscape & key industry drivers
 2016 World Statistics (in USD MM)                                                                                         China
 *: Data taken from year 2017                                                                                              Industry: $475,669
                                                                                                                           % GDP: 4.4%
Canada                 1                                                                                                   Exports: $2,060,000
Industry: $63,112.5                                                                                 Europe             2   Imports: $1,320,000
% GDP: 4.5%                                                                                         Industry: $693,476.3
Exports*: $549,795                                                                                  % GDP: 5%
Imports*: $573,501                                                                                  Exports*: $8,426,905
                                                                                                    Imports*: $7,770,600

                                                      Mexico
  USA                                                 Industry: $41,445
  Industry*: $589,000                                 % GDP: 5.9%
  % GDP*: 3.0%                                        Exports*: $409,494
  Exports*: $2,331,599                                Imports*: $420,369                                                           Japan
  Imports*: $2,900,041                                                                                                             Industry*: $223,214.2
                                                                                                                                   % GDP:5%
             Colombia                                                                                                              Exports: $605,000
             Industry: $18,228                                                                                                     Imports: $583,000
             % GDP: 6.4%
             Exports*: $37,766
             Imports*: $43,976                                        Brazil
                                                                      Industry*: 18,665
                                                                      % GDP: 4.2%
                                                                      Exports: 451,000
                             Chile                                    Imports: 344,000
                             Industry*: $14,713                                                    Argentina
                             % GDP*: 5.1%                                                          Industry: $27,841
                             Exports: $59,917                                                      % GDP: 6.4%
                             Imports: $58,825                                                      Exports: $14,138
                                                                                                   Imports: $14,076
 Source: Gobierno de Chile, INEGI, Banco de la República de Colombia, United States Census, OEC, Eurostat, Bloomberg
 1 Transportation and warehousing; 2Transportation and storage
 © 2018 Deloitte Asesoría Financiera, S.C.                                                                                                         9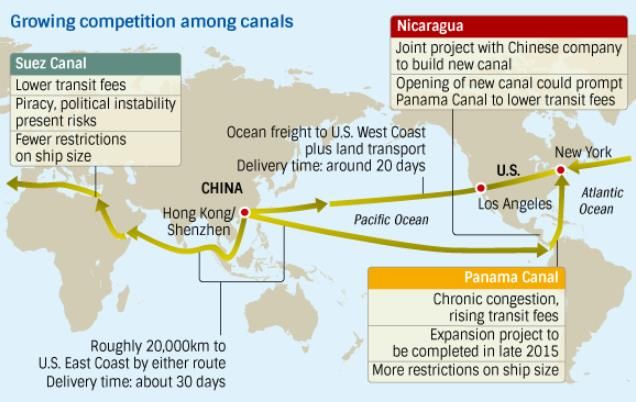
2 A snapshot of the Global Logistics landscape & key industry drivers
  The Trucking and 3PL industry is characterized by continuous execution challenges which
  arise from the key drivers prevalent within the industry

     01                              Fuel
                                     - Volatility of oil prices
                                     - Changes to the fuel
                                       regulatory framework
                                                                             06   Outsourcing trend
                                                                                  - Focus on getting “back to basics”
                                                                                  - Replacing fixed with variable costs

     02                                                                      07
                                     Customer                                     Use of technology
                                                                                  - Evolution of “Big Data” and “Data
                                     concentration                                  Analytics”
                                     - Adverse impact on transaction              - Leveraging technology
                                       multiples

                                                                             08
                                     - Seen as aversion factor

     03
                                                                                  Regulatory impacts
                                     Trucking capacity                            - New regulation on emissions and
                                     “crunch”                                       safety standards
                                                                                  - Changes to driver hours
                                     - Fleet capacity on decline
                                     - Top challenges: capacity and

                                                                             09
                                       technology

     04
                                                                                  RFPs
                                     Driver Shortage                              - Growing use of RFPs to push down
                                     - Lack of supply driven by                     costs
                                       decreasing participation of                - Oversight of other critical success
                                       young people                                 factors

     05
                                     Impact of weather
                                     - Severe weather conditions
                                     - Major events and disruptions to the
                                       supply chain
                                                                             10   NAFTA
                                                                                  - Rise of protectionism
                                                                                  - Current negotiations and agreements
                                                                                    between Mexico, Canada and USA

© 2018 Deloitte Asesoría Financiera, S.C.                                                                                 10
3 How technology is disrupting the industry
Source: www.forbesmiddleeast.com
© 2018 Deloitte Asesoría Financiera, S.C. 113 How technology is disrupting the industry
3D Printing
Simplification of
Internet of complex supply
Things (IoT) chains to a single
Sector is chasing production step
the possibilities chain – On-shoring
of predictive phenomenon
analytics
Enabler
vs.
Value creation
“Amazon-ification”
vs. Automation
• Transaction and
Differentiator
• Changing the payments
market and the processing
supply chain • Single Window
• Drones Initiative
Robotics and AI
• Materials handling and
distribution
Source: Inbound Logistics • Driverless vehicles
© 2018 Deloitte Asesoría Financiera, S.C. 124 Changing Trade flows in the Americas
Before
Source:
© 2018 Deloitte Asesoría Financiera, S.C. 134 Changing Trade flows in the Americas
After
Source: http://panamaadvisoryinternationalgroup.com
© 2018 Deloitte Asesoría Financiera, S.C. 144 Changing Trade flows in the Americas
Panama Canal has been active through the Commercial Supersized
Ships, increasing a 3% CAGR from 2016-2017
Through to September 18, 2018, During 2018, the Panama Canal
Panama Canal authorities expect has being transited by 1,183 Neo-
an increase of $431 m tons, 7% Panamax, which means an
higher than previous period. increase by 39% compared with
last period.
15 MOST TRANSITED COUNTRIES THROUGH PANAMA
TRAFFIC IN PANAMA CANAL
450,000 13,874 14,000 CANAL (IN TERMS OF TONS) IN 2017
400,000 1.7% 1.2% 1.0%
13,800 1.0%
United States
350,000 1.8%
2.7%
13,600 China
300,000 13,548 2.9%
Chile
250,000 13,400
Japan
200,000 4.9%
13,200 Mexico
13,114
150,000
13,000 5.4% 40.9% Colombia
100,000 Perú
12,800 5.9%
50,000 South Korea
340,016 329,445 402,770
0 12,600 Ecuador
2015 2016 2017 6.2%
Canada
Total Superzie Ships Traffic (Net tons) Guatemala
6.7%
Total Superzie Ships Traffic (Number of transits) Panama
6.8% 10.8% Spain
© 2018 Deloitte Asesoría Financiera, S.C. Netherlands 15
Source: https://micanaldepanama.com/5 Select highlights of the Americas Logistics market
NAFTA renegotiation poses the largest uncertainty to the state of the
Mexican logistics market
• The US recently imposed Mexico’s integration into North
duties on steel imports (25%) America’s value chain is complex
and in aluminum (10%). and difficult to disentangle.
• These duties were applicable
for every country except Keys areas of focus for Mexican
LATAM LOGISTICS SECTOR Canada and Mexico. logistics continue to be innovation
• In June USA imposed tariffs on in the supply chain to ensure cost-
USD $B steel and aluminum to Mexico, effectiveness and adaptability
15% and 10%, respectively.
696
671
645
619
593 Potential Changes in NAFTA
567 would affect the logistics
541
sector in terms of: Going through different and
515
489 multiple channels/markets
is still the biggest logistic
Less rail freight in the trend
automotive sector and
more expensive freight due
to tariff barriers
Regarding NAFTA, the supply Despite NAFTA uncertainty,
chain of Mexican companies progress continues to be made
and foreign trade will not for developing infrastructure
suffer major changes, and logistics projects.
although the services could Mexico also continues to
be costlier due to duties pursue opportunities in other
2014 2015 2016 2017 2018 2019 2020 2021 2022
imposed by the United States international markets, such as
Source: Global Logistics Market - Forecast, 2014-2022, Asian countries.
© 2018 Deloitte Asesoría Financiera, S.C. 165 Select highlights of the Americas Logistics market
In 2016, trucking accounted for 49% of the Mexican transportation
market followed by road passenger transportation (32% share)
KEY MARKET SECTORS - 2016 LOGISTICS MARKET BY SECTOR (MXN$ MILLIONS)
1,000,000 $835 $859
$801
900,000 $776
$728 $758
$700
800,000
Air Cargo 2% 4%
2% 700,000
600,000
Rail Road Cargo
9%
500,000
400,000
Sea shipping 1%
1% 300,000
Trucking 200,000
100,000
Road Passengers 0
32%
Transportation 2010 2011 2012 2013 2014 2015 2016
49%
Others related to
Air Cargo Rail Road Cargo
trucking
Sea shipping Trucking Value in MXN MM
Courier Services
Road Passengers Transportation Others related to trucking
Warehousing Courier Services Warehousing
• Since 2010, the logistics sector has had a CAGR of 3.0%. Air, rail and warehousing is expected to grow at a
CAGR of 4.0%, while sea shipping is expected to grow at a CAGR of 3.0%. The exchange rate USD/MXN has
affected the sector in terms of USD
Source: Euromonitor and INEGI
© 2018 Deloitte Asesoría Financiera, S.C. 175 Select highlights of the Americas Logistics market
In 2017, Transportation Foreign Direct Investment represents ~11% of
the total FDI, but it represents ~29% of the Services FDI
Industry overview
FOREIGN DIRECT INVESTMENT IN LOGISTICS (USD$ MILLION) INDUSTRIAL PRODUCTION
Value in MXN Value in USD
900,000 CAGR 65 000
MM MM
Total FDI Logistics FDI
3.5%
$59
1,485 $58
$56 60 000
850,000 $859
$52
$54
$836
55 000
800,000
2,975
$801
1,673 3,213 $48 50 000
1,584 $776
750,000
1,395 48,405 $758 45 000
$41
$728
34,642 700,000
28,538 29,695 $700
CAGR 40 000
26,739
-5%
21,529
650,000
35 000
2012 2013 2014 2015 2016 2017 600,000 30 000
2010 2011 2012 2013 2014 2015 2016
%
6%
5% 3% 3% 6% 9% 6% 11%
FDI
MXN mm USD mm
• Trucking is expected to have a potential increase thanks to the rising online retail sector. The rail freight is the
main growth driver of railroad, thanks to the increasing automotive industry in Mexico.
• Industry production has risen since 2010, although the figures in USD exhibit a radical decrease, due to the
drop in the USD/MXN exchange rate
Source: INEGI
© 2018 Deloitte Asesoría Financiera, S.C. 185 Select highlights of the Americas Logistics market
Mexico net trade within LATAM shows a positive balance with all regions.
On the other hand, net trade with European Union and China reflects a
negative balance.
MEXICO NET TRADE WITH LATAM MEXICO EXPORTS
Value in USD M
5%
12,000 5%
2%
10,000 USA + Canada
8,000 Latam
European Union
6,000
China
4,000
2,000 88%
-
2011 2012 2013 2014 2015 2016
(2,000)
Central America** MERCOSUR*** Andean region*
Source: Instituto Nacional de Estadística y Geogragfía (México)
• Exports are highly concentrated in USA and Canada representing ~88% of its exports. China, Europe and Latam
are potential markets for Mexican products and services.
*Includes: Bolivia, Ecuador, Colombia and Peru. ** Includes: Costa Rica, El Salvador, Guatemala, Honduras, Nicaragua, Belize, and Panama. ***Includes: Argentina, Brazil, Paraguay
and Uruguay
Source: Ministerio de Transporte de Colombia
© 2018 Deloitte Asesoría Financiera, S.C. 195 Select highlights of the Americas Logistics market
Brazil is Mexico’s most significant trading partner in LATAM
Trade Balance
IMPORTS FROM LATAM TO MEXICO FROM 2010-2017 BY EXPORTS FROM MEXICO TO LATAM FROM 2010-2017 BY
COUNTRY SHARE COUNTRY SHARE
100%
100%
90%
90%
80%
80%
70% 70%
60% 60%
50% 50%
40% 40%
30% 30%
20% 20%
10% 10%
0% 0%
2010 2011 2012 2013 2014 2015 2016 2017 1 2 3 4 5 6 7 8
Argentina Bolivia Brazil Colombia Chile Ecuador Argentina Bolivia Brazil Colombia Chile Ecuador
Paraguay Peru Uruguay Venezuela Cuba Paraguay Peru Uruguay Venezuela Cuba
• Brazil represents 51% of the total imports coming from LATAM (MXN $5,440 MM) followed by 16% from
Colombia (MXN $1,674 MM)
• In terms of exports, Brazil has 26% share of the total in LATAM (MXN $3,681 MM) followed by Colombia with a
22% share (MXN $3,164 MM).
Source: SE and Capital IQ
© 2018 Deloitte Asesoría Financiera, S.C. 205 Select highlights of the Americas Logistics market
Trucking accounted for 73% of the transportation market share in
Colombia, followed by air cargo (13%)
Industry overview
KEY MARKET SECTORS - 2016 LOGISTICS MARKET BY (USD$ MILLIONS)
16 Value in USD MM
14 $14
$12 $12
$13
14%
12 $11
$11 $11
Trucking 10
13%
Air Cargo
8
6
Others related to
trucking 4
73%
2
0
2010 2011 2012 2013 2014 2015 2016
Trucking Air Cargo Others related to trucking
• Since 2010, the logistics and transportation sector has had a CAGR of 9.9%. The transportation sector
represents 4.3% of the total Colombian GDP.
Source: Ministerio de Transporte de Colombia
© 2018 Deloitte Asesoría Financiera, S.C. 216 Key trends in Freight Forwarding
Industry tail winds persist, but execution still remains key
success factor Business Challenges
• Solving for “the
Industry Opportunities backhaul”
• Logistics gaps in middle • Increased
income countries competition
• Logistics consulting • Expensive
opportunities information Systems
• Technology has upped the – proliferation of
game with respect to systems
performance monitoring • Perishable and
and pricing fragile goods –
• Despite tailwinds, significant
companies need to be able opportunity
to handle the demand and • Customer and
execute industry
• Technology seen as an concentration
enabler to create capacity • Seasonality
where it no longer exists • Balancing shipping
capacity
Business Trends • NAFTA Trade talks
• Different treaties with
multiple countries other Critical Issues
than North America. • Demand Tied to
• International Trade Economic Cycles
expands • Dependence on
• Security concerns increase Free Trade
costs Agreements
Source: Dun & Bradstreet, Deloitte analysis
© 2018 Deloitte Asesoría Financiera, S.C. 226 Key trends in Freight Forwarding
What Global Executives are saying……
Strong growth for the
4 primary modes of
transport that drive
freight forwarding
(road, rail, air,
water)
“Amazon-ification” =
Technology is It’s about adopting
important…. technology and using
Human capital is it to make services
VERY important much more powerful
and easier to access.
Maintaining complex
partner relationships Profitability driven by
with local operators or efficient operations,
invest in their own extensive relationships
networks in less in shipper/carrier
developed countries networks.
Source: Dunn & Bradstreet, http://www.supplychainbrain.com, Deloitte analysis
© 2018 Deloitte Asesoría Financiera, S.C. 237 Global Deal Flow © 2018 Deloitte Asesoría Financiera, S.C. 24
7             Global Deal Flow

© 2018 Deloitte Asesoría Financiera, S.C.   25
7             Global Deal Flow

© 2018 Deloitte Asesoría Financiera, S.C.   26
7             Global Deal Flow

© 2018 Deloitte Asesoría Financiera, S.C.   27
7             Global Deal Flow

© 2018 Deloitte Asesoría Financiera, S.C.   28
7             Global Deal Flow

© 2018 Deloitte Asesoría Financiera, S.C.   29
7             Global Deal Flow

© 2018 Deloitte Asesoría Financiera, S.C.   30
7             Global Deal Flow

© 2018 Deloitte Asesoría Financiera, S.C.   31
Peter Sozou

                    Gracias                 Partner
                                            https://www2.deloitte.com/ca/
                                            en/profiles/peter-sozou.html

                                            https://www.linkedin.com/in/p
               Obrigado                     eter-sozou-240208/

                                            @peter_sozou

             Thank you                      Juan Laresgoitti
                                            Partner – Financial Advisory Services
                                            Corporate Finance
                                            Office tel: +52 (55) 5080 6988
                                            E-mail: jlaresgoiti@deloittemx.com

                                            Pablo Penichet
                                            Partner
                                            M&A Transaction Services
                                            Direct: +(52) 55 5080-7697
                                            E-mail: ppenichet@deloittemx.com

                                            David Encalada Ajoy
                                            Senior Manager
                                            M&A Transaction Services
                                            Direct: +(52) 55 5080-7336
                                            Cel: 55 413 531 02
                                            E-mail: dencalada@deloittemx.com

© 2018 Deloitte Asesoría Financiera, S.C.                                           32
The data contained in this document all sourced from publicly available sources. The analyses and views in it have been prepared to facilitate internal Deloitte discussions for business development purposes. Accordingly, this document on its own represents an incomplete record of Deloitte’s views and deliberations on the subject. This document is proprietary to Deloitte and its use outside of Deloitte is strictly prohibited without prior consent or appropriate authorization. This document contains general information only and is based on the experiences and research of Deloitte practitioners. Deloitte is not, by means of this publication, rendering accounting, business, financial, investment, legal, tax, or other professional advice or services. This document is not a substitute for such professional advice or services, nor should it be used as a basis for any decision or action that may affect your business. Before making any decision or taking and action that may affect your business, you should consult a qualified professional advisor. Deloitte, its affiliates, and related entities shall not be responsible for any loss sustained by any person who relies on this document. No representations are made by Deloitte as to the accuracy of any estimates or projections included within this document. This document may include sources of information and information that has not been verified by Deloitte. No reliance should be placed on contents of this document, except in the context of facilitating internal Deloitte discussions for business development purposes. This document is confidential and should not be disclosed to third parties. Deloitte refers to one or more of Deloitte Touche Tohmatsu Limited, a UK private company limited by guarantee, and its network of member firms, each of which is a legally separate and independent entity. Please see www.deloitte.com/mx/aboutus for a detailed description of the legal structure of Deloitte Touche Tohmatsu Limited and its member firms. Deloitte provides audit, tax, consulting, and financial advisory services to public and private clients spanning multiple industries. With a globally connected network of member firms in more than 150 countries, Deloitte brings world-class capabilities and high-quality service to clients, delivering the insights they need to address their most complex business challenges. Deloitte has more than 200,000 professionals, all committed to becoming the standard of excellence. As used in this document, "Deloitte" means Galaz, Yamazaki, Ruiz Urquiza, S.C., which has the exclusive legal right to engage in, and limit its business to, providing auditing, tax consultancy, financial advisory, and other professional services in Mexico, under the name "Deloitte". This publication contains general information only, and none of Deloitte Touche Tohmatsu Limited, its member firms, or their related entities (collectively the “Deloitte Network”) is, by means of this publication, rendering professional advice or services. Before making any decision or taking any action that may affect your finances or your business, you should consult a qualified professional adviser. No entity in the Deloitte Network shall be responsible for any loss whatsoever sustained by any person or entity who relies on this publication. © 2018 Deloitte Asesoría Financiera, S.C.
You can also read