LOW-DENSITY LIPOPROTEIN CHOLESTEROL AND DEPRESSION: WHAT IS THE LIMIT?
←
→
Page content transcription
If your browser does not render page correctly, please read the page content below
LOW-DENSITY LIPOPROTEIN CHOLESTEROL
                     AND DEPRESSION:
                    WHAT IS THE LIMIT?

                                       Pharmacotherapy Grand Rounds

                                        Pearl Huyen Huynh, Pharm.D.
                         PGY2 Ambulatory Care/Behavioral Health Pharmacy Resident
                          South Texas Veterans Health Care System, San Antonio, TX
             Division of Pharmacotherapy, The University of Texas at Austin College of Pharmacy
                              Pharmacotherapy Education and Research Center
                         The University of Texas Health Science Center at San Antonio
                                              February 6th, 2015

Learning Objectives

1. Explain the clinical presentations, pathophysiology, and diagnostic criteria for depression
2. Review the physiological roles of lipoproteins
3. Discuss the disorders of lipoproteins including the inherited causes of low-density lipoprotein cholesterol
   (LDL-C)
4. Evaluate current literature to determine the effects and safety of low LDL-C on the risks of depression
Major Depressive Disorder
   I.    Epidemiology
             A. Incidence and prevalence 1,2
                       i. Leading cause of disability in the U.S. for ages 15-44
                      ii. May first appear at any age, but the likelihood of onset increases significantly with
                          puberty
                     iii. Prevalence in the U.S.
                              a. Annual: ~6.7%
                              b. Lifetime: ~16.4%
                     iv. Females experience 1.5-3 fold higher rates than males beginning in early adolescence
             B. Risk factors 1
                       i. Female
                      ii. Native American
                     iii. Middle-aged
                     iv. Widowed, separated, divorced
                      v. Low income
                     vi. Concomitant psychiatric disorder (e.g., substance dependence, panic disorder,
                          generalized anxiety disorder)
                    vii. Personality disorders (e.g., avoidance, dependent, paranoid, schizoid)
                   viii. General medical conditions (e.g., diabetes, stroke, cancer)
                     ix. First-degree relative with depression
                      x. Stressful or traumatic life events
  II.    Diagnosis of MDD 3

Table 1. Diagnostic Criteria Per Diagnostic and Statistical Manual of Mental Disorders, Fifth Edition (DSM-V)
A. Five (or more) of the following symptoms have been present during the same 2-week period and represent a change
    from previous functioning; at least one of the symptoms is either (1) depressed mood or (2) loss of interest or
    pleasure
           1. Depressed mood most of the day, nearly every day
           2. Markedly diminished interest or pleasure in all, or almost all, activities most of the day, nearly every day
           3. Significant weight loss or weight gain
           4. Insomnia or hypersomnia nearly every day
           5. Psychomotor agitation or retardation nearly every day
           6. Fatigue or loss of energy nearly every day
           7. Feelings of worthlessness or excessive or inappropriate guilt
           8. Diminished ability to think or concentrate or indecisiveness nearly every day
           9. Recurrent thoughts of death (not just fear of dying) recurrent suicidal ideation without a specific plan, or a
              suicide attempt or a specific plan for committing suicide
B. The symptoms cause clinically significant distress or impairment in social, occupational, or other important areas of
    functioning
C. The episode is not attributable to the physiological effects of a substance or to another medical condition

                                                                                                               2 | P. Huynh
III. Pharmacotherapy (See Appendix A) 4
IV. Symptoms: “SIGECAPS” mnemonic 5
A. Sleep changes
B. Interest (loss of)
C. Guilt (feelings of worthlessness or guilt)
D. Energy (lack of)
E. Concentration/cognition (reduced and/or difficulties)
F. Appetite (increase or decrease)
G. Psychomotor activity (agitation or retardation)
H. Suicidal thoughts/ideations
V. Etiology and pathogenesis
A. Precise etiology unclear – generally characterized as a complex relationship between genetics
and environment exposures 6
B. Twin and family 7-9
i. Twin studies suggest a heritability of 40-50%
ii. Family studies show a 2-3 fold increase in life time risk among first-degree relatives
C. Genes
i. Susceptibility genes have suggested several regions in the genome
ii. No universal gene for MDD
iii. Several genes have been implicated in MDD 10-14
a. Serotonin transporter gene (5-HTTLPR/SLC6A4)
b. Serotonin receptor 2A (HTR2A)
c. Brain-derived neurotrophic factor (BDNF) gene
d. Tryptophan hydroxylase (TPH2) gene
15
Table 2. Possible Mechanisms of Depression
Theory Implications
Monoamine-deficiency hypothesis Depletion of the neurotransmitters serotonin, norepinephrine, or dopamine
in the central nervous system
Dysfunctions of the hypothalamic- Abnormalities of the HPA and extrahypothalamic corticotropin-releasing
pituitary-adrenal axis (HPA) hormone system
Neurotrophic hypothesis Loss of neurotrophic support
Nerve growth factors are critical in the regulation of neural plasticity,
resilience, and neurogenesis
Altered glutamatergic Decreased GABAergic activity
neurotransmission
Thyroxine abnormalities Decreased levels of transthyretin in the cerebrospinal fluid
Thyroid hormones modulate the serotonergic system in the brain
Deficient neurosteroid Cholesterol levels are low in plasma and the brain during depression
Synthesis
3 | P. Huynh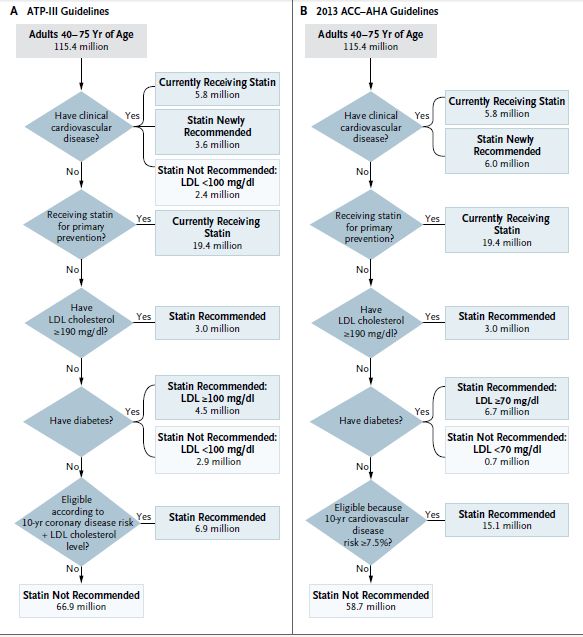
Emergence of a Link Between Low LDL-C and Depression

I.    Initial findings
           A. Relationship between cholesterol and depression first noted in the early 1990s 16
           B. Patients with depression
                      i. Lower total cholesterol
                     ii. Lower LDL-C
                    iii. Total cholesterol improved following antidepressant therapy
II.   Hypotheses of mechanisms
           A. Affected serotonin function 17-20
                      i. Reduction in cholesterol may cause a decrease in serotonergic functioning
                     ii. Cholesterol depletion may impair the function of serotonin receptors and serotonin
                         transporter activities
           B. Genes 21,22
                      i. Association between depression and short allele polymorphism (s/s) for serotonin
                         transporter gene
                     ii. Association between MDD and apolipoprotein E (apoE)

                                               Plasma Lipids

I.    Lipids 23
          A. A class of organic macromolecules
          B. Biologically important lipids
                     i. Triglycerides (TG)
                    ii. Sterols
                   iii. Fatty acids and their derivatives
                   iv. Phospholipids and related compounds
          C. Biological functions of lipids
                     i. Energy storage
                    ii. Structural components of cell membranes
                   iii. Signaling of chemical and biological activities
II.   Lipoproteins (LP) 23
          A. Major lipids that are relatively insoluble in aqueous solutions and do not circulate in the free
                form
          B. Function: facilitate transport of lipids around cells in the extracellular fluids
          C. Components
                     i. LP core
                            a. TG
                            b. Cholesterol esters
                    ii. LP single layer membrane
                            a. Phospholipids
                            b. Apolipoproteins (also known as apoproteins)
                            c. Cholesterol
                                                                                                  4 | P. Huynh
Figure 1. Structure of a Lipoprotein 24
I. Classification of LP 23
A. Five major subtypes
i. Chylomicrons
ii. Very low-density lipoprotein cholesterol (VLDL-C)
iii. Intermediate-density lipoprotein cholesterol (IDL-C)
iv. Low-density lipoprotein cholesterol (LDL-C)
v. High-density lipoprotein cholesterol (HDL-C)
B. Characteristically defined by particle density
i. Protein component increases the relative density of a given particle compared to the
lipid component
ii. Denser lipoprotein have an increased protein:lipid ratio
iii. Highest to lowest density: HDL-C > LDL-C > IDL-C > VLDL-C > chylomicron
Figure 2. Lipoprotein Density 25
5 | P. Huynh23
Table 3. Major Functions of Specific LP
Classification Primary Function
Chylomicrons Transport exogenous TG from the intestine to the liver, skeletal muscle, and adipose tissue
VDL-C Transport endogenous TG from the liver to the skeletal muscles and adipose tissue
IDL-C Transport endogenous cholesterol for conversion to LDL-C or receptor-mediated endocytosis by liver
LDL-C Transport endogenous cholesterol for receptor-mediated endocytosis by the liver or by extrahepatic
tissues
HDL-C Removal of cholesterol from extrahepatic tissues via transfer of cholesterol to IDL-C and LDL-C
II. Apolipoproteins 26
A. Apolipoproteins are polypeptides found in various types of LP
B. Functions of apolipoproteins
i. Provide structural stability to the LP
ii. Function as ligands in LP receptor interactions
iii. Function as cofactors in enzymatic processes that regulate lipoprotein metabolism
iv. Assist in the transport of LP
C. Apolipoproteins are divided into class and sub-class
i. Class: A, B, C, D, E, H
ii. Sub-class: AI, AII, AIV, AV; B48, B100, CI, CII, CIII, CIV
III. Components and measurement of a lipid panel 23
A. Total cholesterol (TC)
B. HDL-C
C. TG
D. LDL-C
i. LDL-C may be measured directly or calculated using Friedewald formula
ii. Friedewald formula: LDL-C = TC – (HDL-C + TG/5)
iii. Calculation not valid if TG > 400 mg/dL
IV. Lipid transport system 27
A. LDL-C is the main carrier of circulating cholesterol
B. LDL-C particles are taken up by LDL-C receptors in the liver
C. Free cholesterol is released and accumulates within the cells as LDL-C is taken up by receptors
Disorders of Lipoproteins
I. Occur as a result of ≥ 1 genetic abnormalities or secondary to underlying diseases
II. Fredrickson, Levy, and Lees first classified hyperlipoproteinemias 28
A. Classification according to the type of LP particle that accumulates in the blood
B. Provides insights into the critical roles of apolipoproteins, enzymes, and receptors in lipid
metabolism
C. Not a diagnostic classification
6 | P. HuynhTable 4. Fredrickson Classification
Phenotype LP Elevated Cholesterol Level TG Level Atherogenicity
I Chylomicrons Normal to mild ↑ Very severely ↑ None
IIa LDL-C Moderately ↑ Normal Severe
IIb LDL-C and VLDL-C Moderately ↑ Moderately ↑ Severe
III IDL-C Moderately ↑ Severely ↑ Severe
IV VLDL-C Normal to mild ↑ Moderately ↑ Mild to Moderate
V VLDL-C and chylomicrons Normal to mild ↑ Very severely ↑ Mild to moderate
A Focus on the 2013 Cholesterol Guidelines
I. Prior classification of LDL-C levels per the National Cholesterol Education Program (NCEP) Third Adult
Treatment Panel (ATP III) 29
A. < 100 mg/dL: optimal
B. 100-129 mg/dL: above optimal
C. 130-159 mg/dL: borderline high
D. 160-189 mg/dL: high
E. ≥ 190 mg/dL: very high
II. Per the 2013 American College of Cardiology/American Heart Association (ACC/AHA) cholesterol
guidelines 30
A. “The Expert Panel was unable to find RCT evidence to support continued use of specific LDL-C
and/or non-HDL-C treatment targets”
B. Therapy no longer modified to target specific LDL-C or non-HDL-C goals
C. Definition of ASCVD
i. Acute coronary syndromes (ACS)
ii. History of myocardial infarction (MI)
iii. Stable or unstable angina
iv. Coronary or other arterial revascularization
v. Stroke
vi. Transient ischemic disease (TIA)
vii. Peripheral arterial disease (PAD) presumed to be of atherosclerotic origin
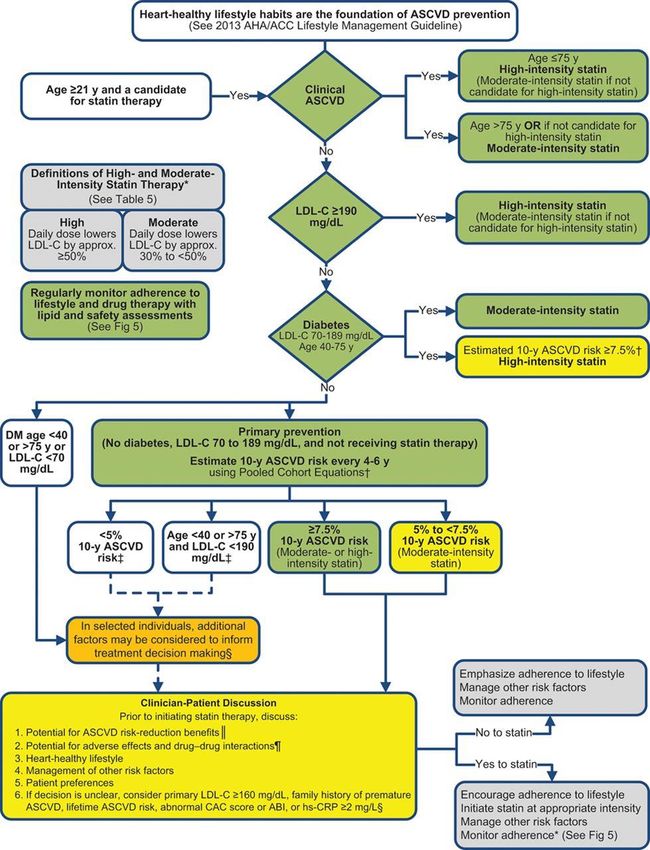
D. New treatment approach
i. Goal: treat the level of ASCVD risk
ii. Patients stratified into 4 statin benefit groups (See Appendices B and C)
a. Clinical ASCVD
b. LDL-C ≥ 190 mg/dL
c. Diabetes mellitus (DM) age 40-75 years with an LDL-C 70-189 mg/dL and
without ASCVD
d. LDL-C 70-189 mg/dL and an estimated 10-year ASCVD risk ≥ 7.5% without DM
or ASCVD
7 | P. HuynhIII. Pharmacological therapy: initiation of statin therapy 23
Table 5. Current Patient Groupings for Primary/Secondary Prevention of ASCVD with Statins
Patient Group Characteristics Target Reduction of LDL-C Recommended Statin Therapy
Clinical ASCVD By ≥ 50% High intensity
LDL-C ≥ 190 mg/dL By ≥ 50% High intensity
DM age 40-75 years with an LDL-C of 70-189 By 30-49% Moderate intensity
mg/dL and without ASCVD
LDL-C of 70-189 mg/dL and an estimated 10- By 30-49% Moderate to high intensity
year ASCVD risk ≥ 7.5% without DM or ASCVD
IV. Other approaches to treatment of blood cholesterol have been advocated 30
A. Treat to target
i. No understanding on magnitude of additional ASCVD risk reduction between one
target LDL-C to another
ii. No data on potential adverse drug events from multidrug therapy that may be needed
to achieve LDL-C goal
B. Lowest is best: no consideration of potential adverse effects of multidrug therapy with
unknown magnitude of ASCVD event reduction
V. Impact of new cholesterol guidelines in statin use (See Appendix D) 31
A. Statin use increase
i. From 43.2 million to 56.0 million U.S. adults
ii. Adults without cardiovascular disease and with lower LDL-C
iii. Adults with DM increase from 4.5 million to 6.7 million
iv. Largest increase in adults with an indication for primary prevention and ASCVD ≥ 7.5%
(15.1 million versus 6.9 million adults)
B. LDL-C < 100 mg/dL not eligible according to ATP III would be eligible per 2013 guidelines: 2.4
million adults
Insights from Populations with Inherited Causes of Low LDL-C
I. TC and LDL-C change as humans age 32
II. TC and LDL-C levels reach approximately 55 and 30 mg/dL during late gestation in utero
III. Abetalipoproteinemia (ABL) 28
A. Etiology and pathogenesis
i. Rare autosomal recessive disorder
ii. Mutations in the processing of apoB or secretion of apoB-containing LP
a. Heterozygous for mutation: no abnormalities of LP or clinical signs
b. Homozygous for mutation: all forms of apoB are absent
iii. LP abnormalities
a. LDL-C: undetectable
b. TG: < 10-20 mg/dL and fail to rise after a fat load
c. TC : < 90 mg/dL
8 | P. HuynhB. Clinical features
i. Paucity of adipose tissue
ii. Retinal degeneration
iii. Fat soluble vitamin deficiencies
iv. Steatorrhea
v. Impaired growth in infancy
vi. Acanthocytosis
vii. Ataxia
viii. Sensory neuropathy
ix. Cardiomyopathy with arrhythmia has been reported
IV. Familial hypobetalipoproteinemia (FHBL) 28
A. Autosomal dominant disorder
B. Defects at the apoB locus
C. Heterozygous for mutation
i. No clinical features
ii. TC: < 120 mg/dL
iii. LDL-C: < 80 mg/dL
iv. TG: normal
D. Homozygous for mutation
i. TC: < 80 mg/dL
ii. LDL-C levels: < 20 mg/dL
iii. Clinical and biochemical features may be indistinguishable from ABL
E. Clinical features
i. Intestinal fat malabsorption
ii. Hepatic steatosis
iii. Fat soluble vitamin deficiencies
Effects of Low LDL-C
I. Hypolipidemia is defined as a TC < 120 mg/dL or LDL-Cholesterol < 50 mg/dL 33
II. Scant data are available on the safety of “very low” LDL-C levels despite expanded indications for high-
intensity statin
III. What do we know?
A. LDL-C is the major carrier of cholesterol
B. Strategies aimed at lowering LDL-C remain a primary approach to reduce cardiovascular risk
C. Patients with ABL and FHBL exhibit negative clinical features
D. 12.8 million more adults are on statin therapy
IV. Per ACC/AHA cholesterol guidelines: “Decreasing the statin dose may be considered when 2
consecutive values of LDL-C are < 40 mg/dL”
V. Current evidence on very-low LDL-C
A. Increase risk of cancer (See Appendix E) 34-37
B. Increase risk of intracranial hemorrhage (See Appendix F) 38-41
C. Increase risk of depression 42-44
9 | P. HuynhLiterature Review
Table 6. Aijanseppa S, Kivinen P, Helkala EL, et al. Serum cholesterol and depressive symptoms in elderly Finnish men.
42
Int J Geriatr Psychiatry. 2002;17:629–634.
Objective Investigate the association between serum lipids and depressive symptoms in a population of elderly
men
Design Retrospective chart review
Population Finnish cohort (NTotal=421) of men ages 70-89 years born between 1900 and 1919
Outcomes Prevalence of depression
Methods 30 year follow-up from 1989
Scales Assessments
o Zung Self-Rating Depression Scale (ZSDS): used to assess depressive symptoms
Scoring ≥ 48/80 was defined as depressed
o Mini-Mental State Examination (MMSE): used to assess cognitive status
o Activities of Daily Living (ADL)
o Presence of concomitant chronic conditions (e.g., heart disease, cerebrovascular disease,
lung disease, heart disease, arthritis, ulcer, cancer, disease of the gall bladder, diabetes)
o Lipid panel from 1984 and 1989
Statistics Mantel-Haenszel test used to assess relationship between categorical depression and cholesterol
quartiles
Results Prevalence of depression
o Depressed: 15.2% (n=64)
Psychotropic medication use (5 of which were antidepressants)
o Depressed: 35.9%
o Not depressed: 14.8%
None were on lipid-lowering medications
Table 6-1.Characteristics of the Study Population by Depressive Status
Variable Not depressed Depressed p-value
ZSDS < 48 (n=357) ZSDS > 48 (n=64)
Mean SD Mean SD
TC in 1989 (mg/dL) 224.28 42.5 204.9 38.7 0.001
TC in 1984 (mg/dL) 243.6 46.4 224.3 42.5 0.002
Cholesterol Change -20.1 34.8 -20.1 30.9 0.986
1984-1989 (mg/dL)
HDL-C (mg/dL) 46.4 11.6 38.7 11.6 0.004
LDL-C (mg/dL) 150.8 38.7 135.34 34.8 0.005
TG (mg/dL) 58 27.07 58 27.07 0.686
Table 6-2. Determinants of Depression
Variable OR 95% CI p-value
TC 0.67 0.48-0.94 0.022
LDL-C 0.67 0.46-0.98 0.041
HDL-C 0.45 0.11-1.76 0.249
Authors’ Low TC and LDL-C are associated with heightened depressive symptomatology in elderly men
conclusions This association is independent of the effect of chronic disease, change in weight and other health
related factors
10 | P. HuynhCritique Strengths Limitations
Long follow-up time Limited external validity
High response rate Retrospective study
Potentially ↓ participation by depressed
participants
Higher ZSDS score cut-off has been
recommended
Table 7. Ancelin ML, Carrire I, Boulenger JP, et al. Gender and genotype modulation of the association between lipid levels
43
and depressive symptomatology in community-dwelling elderly (The ESPRIT Study). Biol Psychiatry. 2010;68:125–132.
Objective Determine the association between lipid levels and depressive symptoms, in coordination with gender
Design Prospective, cross-sectional analysis
Population Participants drawn at random from the Montepellier district between March 1999 and February 2001
≥ 65 years of age and non-institutionalized (NTotal=1792)
Outcomes Prevalence of depression
Methods o Scales, assessments, and exams
o Mini-International Neuropsychiatric Interview (MINI) and DSM-IV
Diagnose lifetime depression or anxiety disorders
o Center for Epidemiologic Studies-Depression Scale (CES-D)
Assess levels of depressive symptomatology
o Mini Mental State Examination (MMSE)
Assess cognitive function
o Standardized interview
Included questions about socio-demographic characteristics, height, weight, mobility,
recent loss of appetite, smoking, alcohol consumption
o Detailed medical questionnaires
Included information on history of vascular disease, drugs used during the preceding
month
o Genotyping of ApoE and 5-HTTLPR
o Classification of depression
o Clinical level of depression (DEP) defined as MINI diagnosis of MDD or CES-D ≥ 16
o MINI diagnosis showing absent of MDD or CES-D ≤ 15: referred to as low symptom group
o Three models for analysis
o Model 0: Adjusted for age and education level
o Model 1: Model 0 adjusted for marital status, body mass index, mobility, cognitive
impairment, ischemic pathologies, hypertension, diabetes, tobacco and alcohol
intake, loss of appetite, and apolipoprotein E
o Model 2: Model 1 adjusted for antidepressant and anxiolytic use, lifetime anxiety
disorder, and past major depression
Statistics Unadjusted analyses were carried out using chi-square tests or analysis of variance for qualitative and
quantitative data
Associations between lipid classes and DEP were assessed using logistic regression models
Results Baseline characteristics
o 29.9% had DEP
o Women had increased levels of depression, TC, HDL-C, LDL-C, but decreased TG
o Males and females found to be different on all levels except for age, use of lipid agent use,
and genotype 5-HTTLPR
11 | P. HuynhTable 7-1.Adjusted Models for Associations Between LDL-C and Depression
Model 0 Model 1 Model 2
OR 95% p OR 95% p OR 95% p
Men
HDL-C
< 21.4 1.28 0.84-1.97 0.25 1.06 0.67-1.67 0.82 1.11 0.68-1.82 0.67
≥ 29.2 1.12 0.73-1.34 0.61 1.13 0.71-1.79 0.61 1.24 0.77-2.01 0.38
LDL-C
< 117.9 1.90 1.25-2.89 0.003 1.75 1.11-2.74 0.2 1.94 1.21-3.13 0.006
≥ 158.9 0.97 0.61-1.54 0.91 1.10 0.68-1.78 0.70 1.09 0.66-1.82 0.73
Women
HDL-C
< 26.1 1.42 1.04-1.94 0.03 1.37 0.98-1.91 0.06 1.49 1.06-2.10 0.02
≥ 36.0 1.09 0.79-1.49 0.61 1.04 0.75-1.44 0.83 1.08 0.77-1.52 0.66
LDL-C
< 120.3 1.17 0.85-1.59 0.34 1.14 0.82-1.57 0.44 1.20 0.86-1.67 0.28
≥ 165.5 0.88 0.64-1.22 0.45 0.87 0.6-1.22 0.42 0.85 0.60-1.20 0.35
LDL-C
o Men: < 117.9 mg/dL statistically significantly associated with depression
o Women: not statistically significant with depression
HDL-C
o Men: not statistically significantly associated with depression
o Women: < 26.1 mg/dL statistically significantly associated with depression
Lipid-lowering agent use and DEP
o Men (OR 0.90, 95% CI 0.60-1.36, p=0.63)
o Women (OR 1.18, 95% CI 0.89-1.58, p=0.26)
LDL-C and DEP by 5-HTTLPR polymorphism
o Men
LDL-C < 117.9 mg/dL with s/s alleles were at high risk (OR 6.00, 95% CI 1.40-25.63,
p=0.02) compared with middle-quartiles LDL-C
LDL-C < 117.9 mg/dL with s/l alleles were at high risk (OR 2.69, 95% CI 1.15–6.29,
p=0.02) compared with middle-quartiles LDL-C
No significant interactions between LDL-C levels and l/l genotype (OR 0.71, 95% CI
0.20–2.56, p=0.60)
o Women
No significant interaction between low HDL-C levels and other covariates including
5-HTTLPR
Authors’ There is an increased prevalence of DEP among men with a low LDL-C level and in women with low
conclusions HDL-C levels
Lower 5-HTTLPR activity may ↑ depression in men
Low HDL-C were associated with an ↑ risk in women
Critique Strengths Limitations
MDD measured by various scales, including Covariates were self-reported
diagnostic interviews
Controlled for a large number of covariates
12 | P. HuynhTable 8. Hsia J, MacFadyen JG, Monyak J, Risker PM. Cardiovascular event reduction and adverse events among subjects
attaining low-density lipoprotein cholesterol 2.0 mg/L events
TG < 500 mg/dL Active liver disease
DM
Uncontrolled hypertension or hypothyroidism
History of certain malignancies
Chronic inflammatory conditions
History of alcohol or drug abuse
Outcomes Primary
A composite of myocardial infarction (MI), stroke, arterial revascularization, unstable angina, or
confirmed death from cardiovascular causes
Safety
Any adverse event, musculoskeletal/connective tissue disorders, gastrointestinal disorders,
respiratory, thoracic, mediastinal disorders, nervous system disorders, nervous system
disorders, renal and urinary disorders, eye disorders, cancer, psychiatric disorders, DM,
hepatobiliary disorders
Methods
LDL-C <
50 mg/dL
Placebo
LDL-C ≥
50 mg/dL
Randomization
LDL-C < 50
mg/dL
Rosuvastatin
50 mg daily LDL-C ≥
50 mg/dL
Figure 8-1. Stratification of Patients
Follow-up
o Median follow-up was 2 years
o Lipid profiles at baseline, annually thereafter, and at the final visit
Statistics Post-hoc analysis which includes all randomized JUPITER participants with at least 1 post-
randomization lipid profile
Multivariable logistic regression used to identify predictors of attaining LDL-C < 50 mg/dL
Cox proportional hazard model used to calculate hazard ratio and 95% confidence interval
Results Baseline and 1-year LDL-C
o Placebo: 109 and 110 mg/dL
o Rosuvastatin, LDL-C ≥ 50 mg/dL: 113 and 70 mg/dL
o Rosuvastatin, LDL-C < 50 mg/dL: 103 and 44 mg/dL
13 | P. HuynhTable 8-1. Independent Predictors of Attaining LDL-C < 50 mg/dL Among Rosuvastatin Arm
Variable Odds Ratio 95% CI p-value
Age 1.023 1.017-1.030 < 0.0001
Men 1.190 10.69-1.324 0.002
Impaired fasting 1.251 1.129-1.385 < 0.0001
glucose
Adherence to study 1.025 1.022-1.029 < 0.0001
medication
Body mass index 1.027 1.018-1.036 < 0.0001
Baseline LDL-C 0.968 0.965-0.971 < 0.0001
Baseline HDL-C 0.996 0.993-1.000 0.023
Baseline CRP 0.990 0.985-0.996 0.001
Primary end point
o Placebo vs. rosuvastatin, no LDL-C < 50 mg/dL compared to placebo vs. LDL-C < 50 mg/dL
NO LDL-C < 50 mg/dL (HR 0.76 vs. placebo, 95% CI 0.57-1.00) compared with LDL-C
< 50 mg/dL (HR 0.35, 95% CI 0.25-0.49, p < 0.0001)
o LDL-C < 50 mg/dL vs. NO LDL-C < 50 mg/dL patients: HR 0.39, 95% CI 0.26-0.59, p = 0.0001)
All-cause mortality
o HR 1.15, 95% CI 0.83-1.58 vs. HR 0.54, 95% CI 0.37-0.78 for patients without and with LDL-C
50 mg/dL, respectively; p < 0.004
Adverse events (focus on Psychiatric Disorders)
Table 8-2. Numbers and Rates (Per 100 Person-Years) of Treatment Emergent Adverse Events
Placebo LDL-C ≥ 50 mg/dL LDL-C < 50 mg/dL
(n=8,150) (n=4,000) (n=4,154)
N N p-value vs. N p-value vs. p-value
placebo placebo vs. LDL-C
≥ 50
mg/dL
Psychiatric 619 307 0.67 296 0.15 0.23
disorders
Insomnia 205 104 0.79 118 0.40 0.52
Depression 217 103 0.83 83 0.005 0.01
Anxiety 158 66 0.29 64 0.09 0.54
Anger 4 0 - 1 - -
Authors’ Psychiatric disorders among the arms did not differ; however rate of depression was statistically
conclusions significant when comparing rosuvastatin, LDL-C < 50 mg/dL vs. placebo
Critique Strengths Limitations
Randomized, placebo control trial Shortened follow-up time of 2 years
Large sample size
Systematic adverse event
ascertainment
14 | P. HuynhAdditional Considerations
45,46
Table 9. Evidence Table with Studies that Failed to Find an Association Between LDL-C and Depression
Study Study Design Population Results
Ergun UG, et Prospective, cross- N=189 females and males Depressed: N=42 (22%)
al. sectional study Inclusion No relationship between
o ≥ 65 years old TC, TG, HDL-C, LDL-C levels
Exclusion and depression ( p > 0.05)
o Stroke, brain hemorrhage,
cancer, broken hip,
depression due to general
medical conditions or
medications, current
treatment with lipid
lowering or antidepressant
medications
Deisenhammer Retrospective chart N=92 females and males Drop out
EA, et al. review admitted into the Department o Week 1: N=86
Treatment: inpatient of Psychiatry Innsbruck o Week 4: N=50
antidepressants University Hospital inpatient No significant changes for
o Tricyclics (14%), SSRIs ward LDL-C and TG between
(46%), other Inclusion weeks 1 and 4
antidepressants o MDD per DSM-IV, 19-65 Serum cholesterol levels did
(46%), mood years old not change significantly
stabilizers (14%) Exclusion during antidepressant
antipsychotics (58%), o Not suffering from somatic treatment
BZD (74%) disease, Axis 1 diagnosis
Follow-up: 4 weeks other than mood disorders,
borderline personality
disorders, current
treatment with lipid
lowering medications
SSRI: selective serotonin reuptake inhibitor; BZD: benzodiazepine
Conclusions and Recommendations
I. Depression is a complex and multifactorial trait with important genetic and nongenetic contributory
factors
II. Monitoring of LDL-C in patients with depression
A. The evidence is weak to suggest there is a correlation between LDL-C and depression
B. There is a lack of evidence to recommend the consideration of establishing threshold for LDL-C
to minimize the risk of depression
C. Causality between depression and low LDL-C remains unclear
III. In accordance with FDA specialists’ opinion, level of risk for death from coronary heart disease should
be the most important factor and that prescribers should not be discouraged from prescribing
cholesterol lowering drugs in cases in which they are indicated
15 | P. HuynhReferences
1. Kessler RC, Chiu WT, Demler O, Merikangas KR, Walters EE. Prevalence, severity, and comorbidity of 12-month
DSM-IV disorders in the National Comorbidity Survey Replication. Arch Gen Psychiatry. 2005;62:617–627.
2. Kessler RC, Berglund P, Demler O, Jin R, Walters EE. Lifetime prevalence and age-of-onset distribution of DSM-IV
disorders in the national comorbidity survey replication. Archives of General Psychiatry. 2005;62(6):593–602.
3. American Psychiatric Association. Diagnostic and Statistical Manual of Mental Disorders. 5th. Arlington, VA, USA:
American Psychiatric Publishing; 2013.
4. O'Donnell JM, Shelton RC. Chapter 15. Drug Therapy of Depression and Anxiety Disorders. In: Brunton LL,
Chabner BA, Knollmann BC, ed. Goodman & Gilman's the Pharmacological Basis of Therapeutics, 12e. New York,
NY: McGraw-Hill; 2011. http://accessmedicine.mhmedical.com/content.aspx?bookid=374&Sectionid=41266221.
Accessed November 20, 2014.
5. Carlat DJ. The Psychiatric Review of Symptoms: A Screening Tool for Family Physicians. American Family
Physician. 1998;58(7):1617–1624.
6. Lohoff FW. Overview of the genetics of major depressive disorder. Curr Psychiatry Rep. 2010;12(6):539–546.
7. Lohoff FW, Berrettini WH. Genetics of mood disorders. In: Charney DS, ed. Neurobiology of Mental Illness. New
York, NY: Oxford University Press; 2008;1504.
8. Sullivan PF, Neale MC, Kendler KS. Genetic epidemiology of major depression: review and meta-analysis. Am J
Psychiatry. 2000;157:1552–1562.
9. Weissman MM, Wickramaratne P, Adams PB, et al. The relationship between panic disorder and major
depression. A new family study. Arch Gen Psychiatry. 1993;50:767–780.
10. Caspi A, Hariri AR, Holmes A, et al. Genetic sensitivity to the environment: the case of the serotonin transporter
gene and its implications for studying complex diseases and traits. Am J Psychiatry. 2010;167:509–527.
11. Goldman N, Glei DA, Lin YH, et al. The serotonin transporter polymorphism (5-HTTLPR): allelic variation and links
with depressive symptoms. Depress Anxiety. 2010;27:260–269.
12. Anguelova M, Benkelfat C, Turecki G. A systematic review of association studies investigating genes coding for
serotonin receptors and the serotonin transporter: affective disorders. Mol Psychiatry. 2003;8:574–591.
13. Castren E, Rantamaki T. The role of BDNF and its receptors in depression and antidepressant drug action:
reactivation of developmental plasticity. Dev Neurobiol. 2010;70:289–297.
14. Walther DJ, Bader M. A unique central tryptophan hydroxylase isoform. Biochem Pharmacol. 2003;66:1673–
1680.
15. Belmaker RH, Agam G. Major depressive disorder. N Engl J Med. 2008;358:55–68.
16. Olusi SO, Fido AA. Serum lipid concentrations in patients with major depressive disorder. Biol Psychiatry.
1996;40:1128–1131.
17. Engelberg H. Low Serum cholesterol and suicide. Lancet. 1992;339:727–729
18. Dursun SM, Reveley MA. Low Serum cholesterol and serotonin receptor subtypes Brit. J. Psychiatry.
1996;12(169):682–6.
19. Modai I, Valewski A, Kikinzon L, et al. Lack of association between cholesterol blood levels and platelet serotonin
uptake. Eur Psychiatry. 1995;10:352–354.
20. Scanlon SM, Williams DC, Schloss P. Membrane cholesterol modulates serotonin transporter activity.
Biochemistry. 2001;40(35):10507–10513.
21. Fischer P, Gruenblatt E, Pieschmann P, Tragl KH. Serotonin transporter polymorphism and LDL-cholesterol. Mol
Psychiatry. 2006;11:707–9.
22. Lopez-Leon S, Janssens AC, Gonzalez-Zuloeta Ladd AM, et al. Meta-analyses of genetic studies on major
depressive disorder. Mol Psychiatry. 2008;13:772–785.
23. Talbert RL. Hyperlipidemia. In: DiPiro JT, Talbert RL, Yee GC, ed. Pharmacotherapy: A Pathophysiologic Approach.
7th ed. New York, NY: McGraw-Hill; 2008;391-407.
24. Metabolism Lecture Web site. http://metabolism.page.tl/Lipid-Metabolism.htm. Accessed January 8, 2015.
25. Alkhouli M, Jarrett H, Sirna S. Chapter 1. Lipid Disorders. In: Crawford MH, ed. Current Diagnosis & Treatment:
th
Cardiology. 4 ed. New York, NY: McGraw-Hill; 2014.
http://accessmedicine.mhmedical.com/content.aspx?bookid=715&Sectionid=48214531.
26. Bersot TP. Chapter 31. Drug Therapy for Hypercholesterolemia and Dyslipidemia. In: Brunton LL, Chabner BA,
Knollmann BC, eds. Goodman & Gillmans’s The Pharmacological Basis of Therapeutics. 12 ed. New York, NY:
16 | P. HuynhMcGraw-Hill; 2011. http://accessmedicine.mhmedical.com/context.aspx?bookid=374§ionid=41266238.
Accessed December 6, 2014.
27. Shohet RV. Chapter 16. The Cardiovascular System. In: Janson LW, Tischler ME, ed. The Big Picture: Medical
Biochemistry. New York, NY: McGraw-Hill; 2012.
http://accessmedicine.mhmedical.com/content.aspx?bookid=397&Sectionid=39898623. Accessed December 27,
2014.
28. Rader DJ, Hobbs HH. Chapter 356. Disorders of Lipoprotein Metabolism. In: Longo DL, Fauci AS, Kasper DL,
th
Hauser SL, Jameson J, Loscalzo J, ed. Harrison's Principles of Internal Medicine. 18 ed. New York, NY: McGraw-
Hill; 2012. http://accessmedicine.mhmedical.com/content.aspx?bookid=331&Sectionid=40727163. Accessed
October 23, 2014.
29. National Cholesterol Education Program (NCEP) Expert Panel on Detection, Evaluation, and Treatment of High
Blood Cholesterol in Adults (Adult Treatment Panel III). Third Report of the National Cholesterol Education
Program (NCEP) Expert Panel on Detection, Evaluation, and Treatment of High Blood Cholesterol in Adults (Adult
Treatment Panel III) final report. Circulation. 2002;17;106(25):3143–421.
30. Stone NJ, Robinson J, Lichtenstein AH, et al. 2013 ACC/AHA guideline on the treatment of blood cholesterol to
reduce atherosclerotic cardiovascular risk in adults. J Am Coll Cardiol. 2013;63(25,Pt. B):2889–2934.
31. Pencina MJ, Navar-Boggan AM, D'Agostino RB Sr, et al. Application of new cholesterol guidelines to a population-
based sample. N Engl J Med. 2014;370:1422–1431.
32. LaRosa JC, Grundy SM, Waters DD, et al. Intensive lipid lowering with atorvastatin in patients with stable
coronary disease. N Engl J Med. 2005;352:1425–35.
33. The Merk Manual Professional Edition Web Site.
http://www.merckmanuals.com/professional/endocrine_and_metabolic_disorders/lipid_disorders/hypolipidemi
th
a.html. Updated September 2013. Assessed January 8 , 2015.
34. Sattar N, Preiss D, Murray HM, et al. Statins and risk of incident diabetes: a collaborative meta-analysis of
randomised statin trials. Lancet Elsevier. 2010;375:735–42.
35. Shepherd J, Blauw GJ, Murphy MB, et al. Pravastatin in elderly individuals at risk of vascular disease (PROSPER): a
randomized controlled trial. Lancet. 2002;360:1623–30.
36. ALLHAT Officers and Coordinators for the ALLHAT Collaborative Research Group. Major outcomes in moderately
hypercholesterolemic, hypertensive patients randomized to pravastatin vs usual care: the Antihypertensive and
Lipid-Lowering Treatment to Prevent Heart Attack Trial (ALLHAT-LLT). JAMA 2002;288:2998–3007.
37. Alsheikh-Ali AA, Maddukuri PV, Han H, Karas RH. Effect of the magnitude of lipid lowering on risk of elevated liver
enzymes, rhabdomyolysis, and cancer: insights from large randomized statin trials. J Am Coll Cardiol.
2005;50:409–418.
38. Noda H, Iso H, Irie F, et al. Low-density lipoprotein cholesterol concentrations and death due to
intraparenchymal hemorrhage: the Ibaraki prefectural health study. Circulation. 2009;119:2136–2145.
39. Bang OY, Saver JL, Liebeskind DS, et al. Cholesterol level and symptomatic hemorrhagic transformation after
ischemic stroke thrombolysis. Neurology. 2007;68:737–42.
40. Karam JG, Loney-Hutchinson L, McFarlane SI. High-dose atorvastatin after stroke or transient ischemic attack: the
Stroke Prevention by Aggressive Reduction in Cholesterol Levels (SPARCL) Investigators. Journal of the
Cardiometabolic Syndrome. 2008;3(1):68–69.
41. Ramírez-Moreno JM, Casado-Naranjo I, Portilla JC, et al. Serum cholesterol LDL and 90-day mortality in patients
with intracerebral hemorrhage. Stroke. 2009;40:1917–1920.
42. Aijanseppa S, Kivinen P, Helkala EL, et al. Serum cholesterol and depressive symptoms in elderly Finnish men. Int
J Geriatr Psychiatry. 2002;17:629–634.
43. Ancelin ML, Carrire I, Boulenger JP,et al. Gender and genotype modulation of the association between lipid levels
and depressive symptomatology in community-dwelling elderly (The ESPRIT Study). Biol Psychiatry. 2010;68:125–
132.
44. Hsia J, MacFadyen JG, Monyak J, Risker PM. Cardiovascular event reduction and adverse events among subjects
attaining low-density lipoprotein cholesterolAppendices
Appendix A. Pharmacotherapy for MDD 4
Agent Starting Dose Standard Dose Target Receptors Effects
Selective Serotonin Reuptake Inhibitors (SSRI)
Fluoxetine 20 mg daily 20-40 mg daily NE and DA Activating effect
Paroxetine 20 mg daily 20-40 mg daily Anticholinergic (M1), Sedating; anticholinergic
weak NE
Sertraline 50 mg daily 50-150 mg daily Weak DA Sedating; antihistamine
Citalopram 20 mg daily 20-40 mg daily Antihistamine Slightly sedating; QT prolongation
potential associated with > 40 mg
daily*
Escitalopram 10 mg daily 10-20 mg daily -- May be twice as potent as
citalopram
Fluvoxamine 50 mg daily 100-250 mg daily Weak NE Activating effect
Serotonin and Norepinephrine Reuptake Inhibitors (SNRI)
Venlafaxine 37.5 mg daily (IR) 150-375 mg daily Higher doses: adds NRI --
75 mg daily (ER) 150-225 mg daily (~225 mg)
Slight inhibition of DA
reuptake (high
dosages)
Duloxetine 30 mg daily 30-90 mg daily 5-HT and DA (equally) --
Dopamine and Norepinephrine Reuptake Inhibitors (DNRI)
Bupropion 150 mg daily 150-300 mg daily -- Low incidence of
sexual ADR; seizures at high doses
(> 450 mg daily or > 150 mg/dose)
Other
Mirtazapine 30 mg daily 30-60 mg daily Antihistamine, alpha 1- Weight gain; antihistamine
adrenergic
antagonist
*Citalopram maximum of 20 mg daily recommended for patients with: hepatic failure, age > 60 years old, CYP 2C19 poor
metabolizers; ADR: adverse drug reactions; DA: dopamine; NE: norepinephrine; 5-HT: serotonin
18 | P. HuynhAppendix B. Summary of Statin Initiation Recommendations for the Treatment of Blood Cholesterol to
Reduce ASCVD Risk in Adults per 2013 AHA/ACC Guidelines 30
Appendix C. High-, Moderate-, and Low-Intensity Statin Therapy 30
High-Intensity Moderate-Intensity Lower-Intensity
When taken daily, will lower LDL-C When taken daily, will lower LDL-C When taken daily, will lower LDL-C
an average of ≥ 50% an average of 30% to < 50% an average of < 30%
Atorvastatin 40–80 mg Atorvastatin 10–20 mg Simvastatin 10 mg
Rosuvastatin 20–40 mg Rosuvastatin 5–10 mg Pravastatin 10–20 mg
Simvastatin 20–40 mg Lovastatin 20 mg
Pravastatin 40–80 mg Fluvastatin 20–40 mg
Lovastatin 40 mg Pitavastatin 1 mg
Fluvastatin XL 80 mg
Fluvastatin 40 mg
Pitavastatin 2–4 mg
19 | P. HuynhAppendix D. Changes in Statin Use and Statin Recommendations 31
20 | P. HuynhAppendix E. Evidence Table for Low LDL-C and Cancer 34-37
Clinical Trial Intervention Absolute Achieved Results
LDL-C LDL-C
reduction (mg/dL)
PROSPER Pravastatin 40 50 97 Pravastatin vs placebo: HR 1.25, 95% CI 1.04-1.51,
mg vs placebo p=0.020
(NTotal=5,804) Type of cancer: gastrointestinal (N=65),
genitourinary (N=58), respiratory (N=46), breast
(N=18), other(N= 58)
Alsheikh-Ali Meta-analysis of -- 62-142 Significant inverse association between cancer
2
AA, et al. 15 statin incidence and achieved LDL-C levels (R =0.43,
treatment arms p=0.009)
(NTotal=75,317) Results do not indicate causality
ALLHAT-LLT Pravastatin 40 25 104 6-year incident cancer rates were similar in the two
mg vs usual care groups (378 vs. 369, RR 1.03, 95% CI 0.89-1.19,
(NTotal=10,355) p=0.66)
Cholesterol Meta-analysis of -- -- Reducing LDL-C with a statin for ~ 5 years had no
Treatment 27 clinical trials effect on newly diagnosed cancer or on death from
Trialists' (CTT) (NTotal=175,000) cancers
Collaboration No indication was found that a ↓ of LDL-C in
patients with a lower baseline LDL-C level ↑ their
cancer risk
HR=hazard ratio; CI=confidence interval
21 | P. HuynhAppendix F. Evidence Table for Low LDL-C and Intracerebral Hemorrhage (ICH) 38-41
Clinical Trial Population Results
Noda H, et al. NTotal = 30,802 men and Death due to intraparenchymal hemorrhage
60,417 women compared to LDL-C < 80 mg/dL
o LDL-C 80-99 (HR 0.65, 95% CI 0.44-0.96)
40 to 79 years of age with no o LDL-C 100-119 (HR 0.48, 95% CI 0.32-0.71)
history of stroke or o LDL-C 120-139 (HR 0.50, 95% CI 0.33-0.75)
CHD o LDL-C > 140 (HR 0.45, 95% CI 0.30-0.69)
Bang OY, et al. NTotal= 104 patients LDL-C with or without statin treatment were
independently related to a ↑ risk of
Mean age=70 years symptomatic hemorrhagic transformation after
recanalization therapy
Low LDL-C (OR 0.968, 95% CI, 0.941-0.995,
p=0.020)
SPARCL NTotal = 4,731 in patients with Mean LDL-C achieved
recent cerebrovascular o Atorvastatin: 73 mg/dL
accident or TIA and no known o Placebo: 123 mg/dL
CHD, TIA or stroke 1 to 6 16% ↓ in fatal and nonfatal stroke
months before Post hoc analysis
randomization, with a Rankin o 22% ↓in ischemic stroke
score ≤ 3 and a LDL-C level of o 45% ↓ in unclassified stroke
100-190 mg/dL o 66% ↑ in hemorrhagic stroke
Ramírez-Moreno JM, et al. NTotal= 88 presenting with ICH Low LDL-C levels were independently
associated with death after intracranial
hemorrhage (HR=3.07, 95% CI:1.04-9.02,
p=0.042)
HR: hazard ratio; CI: confidence interval; TI: transient ischemic attack; CHD: coronary heart disease
22 | P. HuynhYou can also read