Applying Simulation to Advance Resilience of Historic Areas to Climate Change and Natural Hazards - CEA
←
→
Page content transcription
If your browser does not render page correctly, please read the page content below
Applying Simulation to Advance Resilience of
 Historic Areas to Climate Change and Natural
 Hazards

 Katharina Milde1*, Sonia Giovinazzi 2, Daniel Lückerath1, Oliver Ullrich1, Maurizio Pollino2,
 Erich Rome1, Vittorio Rosato2
1
 Fraunhofer Institute for Intelligent Analysis and Information Systems IAIS, Schloss Birlinghoven, Sankt Augustin,
 Germany; *katharina.milde@iais.fraunhofer.de
2
 Italian National Agency for New Technologies, Energy and Sustainable Economic Development (ENEA), Lungotevere
 Thaon di Revel, 76, 00196 Rome, Italy

Abstract. The EU-H2020 project ARCH aims to develop other natural hazards on historic areas have not been
and adapt tools and methods for assessing and improving studied extensively enough [7], and disaster risk reduc-
the resilience of historic areas to climate-related and other
 tion seldomly registers as a priority area for management
natural hazards [1]. One of these tools is CIPCast, a scenario
simulation and decision support system for the analysis and of World Heritage property [8].
forecast of risks and vulnerabilities of critical infrastructure Therefore, there is a need for specific methods and
components and their interdependencies. In this paper, we tools for climate change adaptation and disaster risk re-
describe the basic functionalities of CIPCast, as far as the duction that take the unique physical, environmental,
application to seismic risk assessment is concerned and we
 economic, social, cultural, and governance aspects of his-
provide an overview of the models behind it. Furthermore, a
brief discussion on how we plan to extend CIPCast to model
 toric areas, as well as the enabling conditions they pro-
and simulate potential risks and impacts induced by climate vide for taking action into account.
change to historic areas, and how this is intended to support The EU Horizon 2020 research project ARCH (Ad-
resilience assessment strategies, is provided in the conclu- vancing resilience of historic areas against climate-re-
sions. lated and other hazards) [1] aims to take a step in this
 direction by providing a suite of tools for assessing and
Introduction improving the resilience of historic areas, combined
 within a unified disaster risk management framework.
Historic towns, old urban quarters, villages and hamlets,
 One of the tools developed within the project is an
as well as historic landscapes make up a significant part
 extension of the scenario simulation and decision support
of Europe: Natural heritage sites cover roughly 18% of
 system CIPCast [9] in order to enable the assessment of
the European land territory [2] and on average 22% of the
 impacts and risks to historic areas induced by climate
European housing stock was constructed before 1946 [3].
 change and natural hazards. This is an essential input for
These historic areas are deeply embedded in larger urban
 assessing the resilience of historic areas and identifying
and rural environments (in which 72% of the European
 suitable resilience building strategies.
population live [4]), serving a role in preserving local
 This paper gives an overview on how CIPCast func-
identity and personality as well as local knowledge, while
 tions and describes the extensions necessary to maximize
relying on interdependent infrastructure services to keep
 its utility in the project context. The first section (sec. 1)
functioning. Historic areas are a major component of
 gives a brief introduction to the ARCH project, followed
quality of life and play an important role in society and
 by a general overview of the basic functionalities of CIP-
community well-being [5], as well as providing im-
 Cast (sec. 2) and how these can already be employed to
portant environmental and economic functions.
 assess damage and impacts induced by seismic hazards
 Although climate change has become one of the most
 (sec. 3). Following these explanations, the planned exten-
significant and fastest growing threats to people and their
 sions of CIPCast (sec. 4), and how its results supports re-
cultural heritage [6] the impacts of climate-related and

ARGESIM Report 59 (ISBN 978-3-901608-93-3), p 453-460, DOI: 10.11128/arep.59.a59063

 453
silience assessments (sec. 5) are described, before the pa- developed as part of the EU-funded FP7 project CIPRNet per closes with conclusions and an outlook (sec. 6). (Critical Infrastructures Preparedness and Resilience ResearchNetwork) [10]. CIPCast provides a database, an interoperable platform and a user-friendly WebGIS inter- 1 The ARCH project face. These are conceived as a combination of free/open Advancing resilience of historic areas against climate- source software environments, for the real-time and op- related and other hazards (ARCH) is an EU Horizon erational (24/7) monitoring and risk analysis of built and 2020 research project that aims to better protect historic natural environments, with special focus on interdepend- areas from climate-related and other natural hazards in- ent critical infrastructures (such as electric power, water, duced risks. The project started in June 2019 and will run telecommunication and road networks) and buildings until May 2022. [9][11][23]. Within a co-creation process, the project team of CIPCast is based on a four-layer architecture: eleven research partners and the cities of Bratislava, Within the data preparation layer basic data is Camerino, Hamburg, and València will create tools and collected, harmonized and organised for the fol- methods to provide cities with better information and de- lowing processing step. cision support for improving the resilience of historic ar- In the data repository layer, data and metadata eas. The results will be applied in pilot sites within the are stored in a geospatial database implemented cities covering a diverse spectrum of historic areas: the in PostgreSQL/PostGIS. historic old towns of Bratislava and Camerino, the Devin Within the analysis and elaboration layer Castle ruin in Bratislava, the Speicherstadt and Kon- stored data and metadata are managed and pub- torhaus World Heritage sites in Hamburg, as well as the lished online to enable geo-processing and risk La Huerta peri-urban farmland and Albufera national analysis. park in València. These areas are affected by a multitude Within the front-end layer, data and functions of different hazards, amongst them earthquakes, heat- from the previous layers are exposed to end-users waves, fluvial and pluvial flooding, storm surges, ero- via a WebGIS application. sion, and landslides. Within this architecture, CIPCast provides five dis- The technical work in ARCH includes the preparation tinct functional blocks that feed each other: of a hazard object information management system that B1 – Monitoring of Natural Phenomena ac- captures data on hazards and object conditions using quires data from different data sources. newly deployed sensors and readily available open data B2 – Prediction of Natural Events houses dif- platforms; an impact risk assessment framework that pro- ferent hazard models to estimate the expected in- vides methods and tools for risk and impact assessment, tensities for predictable events. including hazard models and scenario simulation for B3 – Prediction of Damage Scenarios corre- what-if analyses; the design of implementation pathways lates the (estimated) hazard intensity with the that identify potential resilience measures enriched with vulnerability of elements located in an affected effectiveness scores, supported via a tool for graphical area to estimate potential direct damages (e.g. implementation planning; and a multi-stakeholder resili- breakage of a transformer in an electric substa- ence assessment framework integrating the methods and tion). tools as well as a platform for collaboration and sharing. B4 – Prediction of Impacts and Consequences The remainder of this paper focuses on describing the correlates the potential direct damages to ex- simulation and decision support system adapted within posed elements with their (inter-)dependencies the project and how this will be employed for the resili- with other elements and the general system char- ence assessment. acteristics to estimate larger consequences (e.g. loss of service in an electrical network). B5 – Support of efficient strategies enables 2 CIPCast Simulation and what-if analysis of different strategies to counter Decision Support System the effects of examined hazards. CIPCast is a GIS-based Decision Support System (DSS) The CIPCast GeoDatabase stores data related to ex- 454
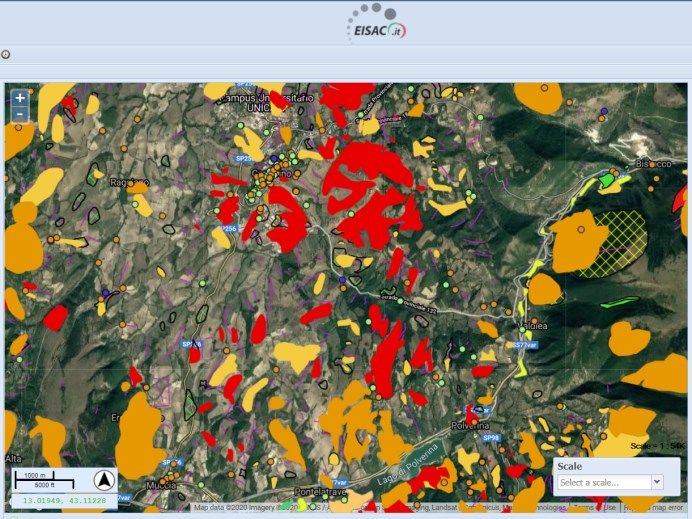
posed elements and hazards. For seismic hazards the da- For assessing earthquake-induced geotechnical haz- tabase includes information on epicenter location, hypo- ards CIPCast-ES includes the following data: surface center depth and magnitude; for exposed elements it in- faulting; seismic-induced landslide potential (see Figure cludes both static data, like structural characteristics of 1); seismic-induced rock-fall potential; liquefaction po- buildings, and dynamic data, like population dynamics. tential; and potential for permanent soil deformation. The data model used in the GeoDatabase differentiates Based on this data a seismic hazard simulation allows between different classes of exposed elements, e.g. net- to model and represent the location, extension and inten- works, like telecommunication, electricity, transport net- sity of expected ground shaking generated by real or works, and groups of buildings. Detailed information for user-defined (artificial) events. exposed elements is stored to estimate vulnerabilities, The simulation of real events is undertaken to support e.g. build material, construction age, and number of in- emergency management. In this case, a quasi-real time habitants. estimation of the extent and severity of the seismic Currently, CIPCast includes hazard data collected ground shaking after an earthquake event is fundamental from seismic sensors, weather stations (for precipitation, to provide a rapid, efficient and effective response. The temperature, humidity, wind, etc.), and hydrometers (for simulation of end-user defined events is instrumental to inundation levels of river basins). support risk mitigation planning as explained in Section 3.3. 3 CIPCast-ES for Seismic Risk Assessment in Italy CIPCast-ES is an extension of CIPCast specifically aimed at simulation of seismic hazards and at the assess- ment of related physical damage and impact scenarios [17]. This section provides an overview of the models embedded within CIPCast-ES that enable these functions and some explanatory case studies. 3.1 CIPCast-ES Seismic Hazard assessment To allow the assessment and representation of ground motion and earthquake-induced geotechnical hazards, available data, layers and information were collated in Figure 1: CIPCast-ES screenshot showing: seismic probabil- the GeoDatabase. istic hazard map and known-fault location maps This data was sourced from previous studies as well from INGV, overlaid with cultural heritage assets (point locations). as from external web services. They include services pro- vided by the Italian National Earthquake Center In both cases the required inputs are: (http://cnt.rm.ingv.it/en) managed by the Italian national the location of the epicentre, i.e. latitude and Institute of Geophysics and Volcanology INGV; hydro- longitude, XE, YE; geological risk maps provided by “Idrogeo” (https://idro- the depth of the hypocentre in kilometre DH geo.isprambiente.it/), and a web platform on landslide [km]; and and flood risk provided by the Italian Institute for Envi- the magnitude, M, expressed according to the ronmental Protection and Research ISPRA. Richter scale. For assessing ground motion hazards CIPCast-ES in- cludes the following data: known faults locations (see Figure 1); catalogues of historical earthquakes; and seis- mic microzonation maps. The latter provide, at the local scale, spatial information about the effect of the local ge- ological conditions on ground-shaking. 455
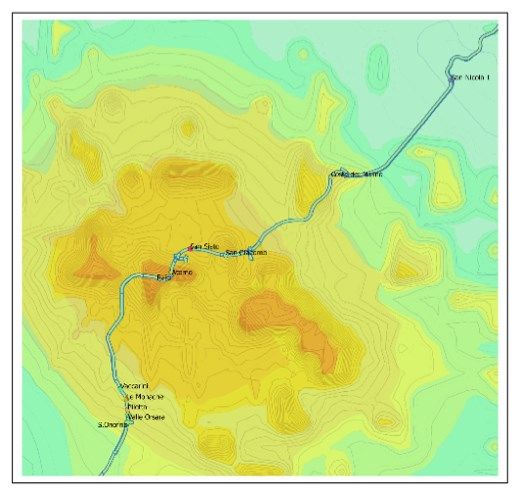
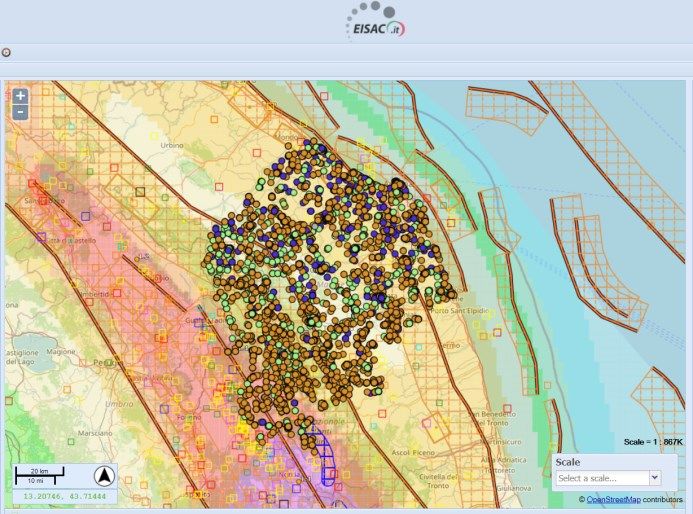
The selection of the most appropriate metric to repre- sent the seismic hazard depends on the focus of the anal- ysis; for example, PGA and Sa (T) have been observed to be more appropriate when the focus of the analysis is the structural performance of above-ground structures such as buildings while PGV and Sd (T) are suitable when the focus is on buried infrastructures. Macroseismic intensity on the other hand, is a qualitative descriptor of the effects of an earthquake at a particular location, as evidenced by observed damage on the natural and built environment and by the human and animal reactions at that location. Although a qualitatively metric, it is still used when adopting empirical-based models for assessing seismic Figure 2: CIPCast-ES screenshot showing: Landslide risk vulnerability, such as the one described in section 3.2 for maps from Italian P.A.I. “Piano Assetto Idrogeolog- residential and monumental buildings. ico” overlaid with cultural heritage assets (area lo- Figure 3 provides an example of the official ground cations). motion map after the L’Aquila earthquake on April 6, For real events, location and magnitude of any seis- 2009 at 03:32 CEST, represented in PGA [%g]. mic event with a magnitude larger than M=3 are acquired While official ground shaking maps are released by automatically and represented in real time within CIP- INGV around 45 minutes after an earthquake event oc- Cast-ES. curs, the basic parameters necessary for simulation are For end-user defined events, the user provides the rel- usually published only a few minutes after an event. This evant parameters, usually based on a catalogue of historic allows to easily check and validate simulation results events and known fault locations (Figure 4), both acces- with actual event data. sible in CIPCast-ES. Once the parameters are defined CIPCast-ES calcu- lates where, to what extent and with which intensity ground shaking will propagate using Ground Motion Prediction Equations (GMPEs), or “attenuation” rela- tionships. GMPEs provide a means of predicting the level of ground shaking and its associated uncertainty at any given site or location, based on magnitude, source-to-site distance (i.e. distance between the epicentre and the lo- cation of an exposed element), local soil conditions, ty- pology of the fault mechanism, etc. GMPEs are empiri- cal-based equations derived after post-processing of rec- orded accelerations or observed damages generated by historical earthquake events1. In CIPCast-ES different GMPEs can be selected by the end-users allowing for the calculation and represen- Figure 3: Official INGV ground motion map after April 6, 2009 tation of seismic hazard maps with different metrics, i.e.: L’Aquila earthquake overlaid with A24 Highway Macroseismic Intensity, I, [24]; route. Peak Ground Acceleration PGA and Spectral For example, to simulate a ground-shaking map for Acceleration, Sa (T), [25]; the L’Aquila earthquake a user would choose the follow- Peak Ground Velocity, PGV, [27] ing parameters: Spectral Displacements Sd (T), [27]. 1 An exhaustive compilation of GMPEs defined in the period range 1964-2019 can be found here: http://www.gmpe.org.uk. 456
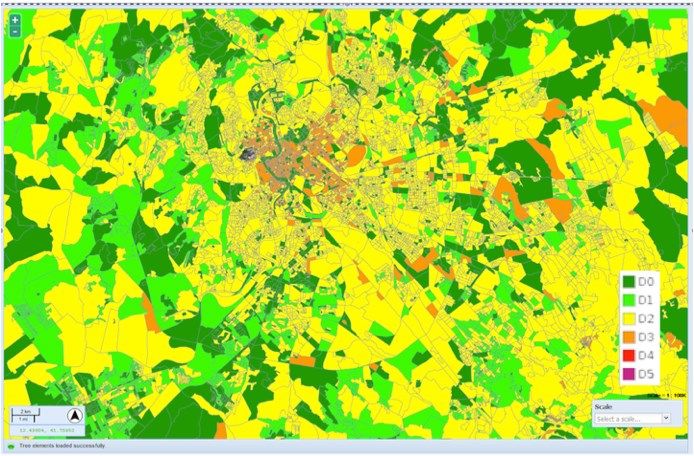
epicentre location 42.3476° N, 13.3800 °E, ity index modifierV, where V* reflects the building ty- magnitude M = 6.3, pology and V the sum of influencing features: hypocentre DH [km] = 9.46 km. = ∗ + ΣΔ (1) Because CIPCast-ES allows to calculate ground shak- ing maps in quasi real time it is able to support emergency Table 1 lists basic vulnerability indexes for different management operations with first estimates of the loca- building categories (I to VII), construction materials (ma- tion, extent and level of ground shaking in the affected sonry or reinforced concrete) and construction periods. territories. Simulated maps are substituted in CIPCast-ES Figure 3 shows an example visualisation of vulnerability with official maps, as soon as they become available. indexes on census tract level. 3.2 CIPCast-ES Vulnerability and Physical Masonry V* RC V* Damage assessment for buildings I < 1919 0.79 To allow the assessment and representation of built-envi- II 1919 1945 0.73 ronment elements and of potentially exposed population III 19451971 0.69 V < 1971 0.59 the GeoDatabase includes: Administrative boarders (re- gions, municipalities and census tracks) and associated IV > 1971 0.65 VI 19711981 0.55 data on population (including gender, age, occupation, VII > 1981 0.42 etc.) sourced from the Italian National Institute of Statis- Table 1: Basic vulnerability indexes V* for different building categories, construction periods and construction tics; location and basic information on critical infrastruc- material. RC: Reinforced Concrete tures like electrical transmission systems, gas transmis- sion systems, main sources of electricity production, Once the seismic vulnerability is assessed, the ex- transport systems (road network, railways, airports), as pected damage can be estimated as follows: well as the locations of strategic buildings like hospitals, + 6.25 − 13.1 (2) barracks and schools. = 2.5 [1 + ℎ ( )] Data about residential buildings is stored at single building level, when possible, or as aggregated data where: linked to geographical units otherwise. This includes data - D is the average expected damage for a group of on construction age, construction material (masonry, re- buildings or an individual building; inforced concrete, timber, prefabricated,), type of struc- - V is the value of the vulnerability index; tural system (e.g. frame versus shear walls for reinforces - Q is the ductility index assumed to be 2.3 for ordi- concrete buildings, bricks versus stones for masonry nary building categories like the ones from Table 1; buildings), and adoption of seismic codes for design or - I is the Macroseismic Intensity as described in the retrofitting. previous section. For the Prediction of Damage Scenarios (i.e. B3 D0 = D < 0.5; D3 = 2 ≤ D < 3; Module) for buildings, the Macroseismic-Mechanical cross-calibrated Method [28][29] is implemented. This D1 = 0.5 ≤ D < 1; D4 = 3 ≤ D < 4; method allows to assess the seismic vulnerability of D2 = 1 ≤ D < 2; D5 = 4 ≤ D ≤ 5. building groups, statistically aggregated in a geograph- Table 2: Categorization of expected damages based on [30] ical unit, and of single buildings as a function of their seismic vulnerability and of the ground-motion at their In order to categorize the expected damage D the location (see Section 3.1). EMS-98 damage grade scale [30] is applied. This scale The seismic vulnerability of buildings is measured by differentiates between six different levels Dk: D0 no dam- the vulnerability index V and the ductility index Q, calcu- age, D1 slight, D2 moderate, D3 heavy, D4 very heavy, D5 lated based on building typology and constructive, geo- collapse/destruction. Table 2 lists how expected damages metrical or additional features able to affect and modify are categorized and Figure 4 shows an example visuali- building behaviour when subjected to earthquake shak- zation on census tracks level. ing. One way to calculate the vulnerability index V is to combine a basic vulnerability index V* and a vulnerabil- 457
or decrease their vulnerability, e.g. via a survey that col- lects relevant parameters like maintenance conditions, quality of materials, structural regularity (in plan and in elevation), size and slenderness of relevant structural el- ements, possible interaction with adjacent structures, presence of retrofitting interventions, etc. 4.2 CIPCast extensions for assessing climate change induced scenarios To allow for the simulation of damage and impact scenarios induced by climate-related hazards CIPCast Figure 4: Example of the earthquake-induced damage as- needs to be extended with the capability to manage addi- sessment at census track levels [29] tional input data and additional simulation modules. The basic framework for CIPCast-CC (CIPCast Climate Change module, also referred to as ARCH DSS), will be 4 CIPCast Extensions for ARCH similar to CIPCast-ES, i.e. physical damage induced by In order to employ CIPCast in ARCH, the GeoData- climate change on the built environment in historic areas base will be extended to include maps and data represent- will be assessed as a function of hazard, exposure and ing historic areas and heritage buildings, classified into vulnerability. Specifically, ARCH DSS will include moveable heritage, archaeological resources, buildings models for index-based vulnerability assessment at and structures, cultural landscapes, associated and tradi- area and single building level (e.g. compare to tional communities and intangible heritage as described [32][33]); in [31]. models for physical damage assessment that com- To allow the assessment of climate change induced bine a) hazards parameters; b) position and typology scenarios the GeoDatabase will need to be extended to of heritage; and c) heritage vulnerability; and include related hazard maps (e.g. for floods or extreme models for the estimation of functional, economic temperatures) under different climate scenarios. These and societal impacts. maps will be derived from numerical simulations, climate For the latter, cause-effect models are necessary, which hazard indicators, optical/thermal earth observation can for example be derived by developing impact chains maps, high-resolution aerial and satellite maps, and from in multi-stakeholder workshops [34]. existing data services, e.g. Copernicus Climate Change Service [21]. 5 Integration of CIPCast in the 4.1 CIPCast extensions for assessing damage ARCH resilience assessment to historic buildings The ARCH project adapts the Urban Adaptation Cycle In order to estimate seismic damages to historical [35] to describe the resilience management process of buildings the same function as for residential building historic areas. One step in this process is the assessment (see equation 2) will be employed, using adapted V and of hazards, vulnerabilities, risks, and resilience. The re- Q index values. These values will be calibrated using silience assessment is based on the UNDRR Disaster Re- earthquake-induced damage sustained by cultural herit- silience Scorecards for cities [22] and buildings [35]. As age areas and buildings during the last twenty years. part of the resilience assessment, users need to identify It is important to note that a vulnerability index as- the most relevant hazard and risk scenarios for the his- signed to a monument simply by a typological classifica- toric area that is being assessed and should formulate re- tion represents an average value that does not account for silience enhancing measures to eliminate resilience weak the distinctiveness of the single building and does not al- spots. Here, CIPCast will be employed to enable users to low singling out the most vulnerable structures among identify and simulate hazard scenarios, assess potential buildings of the same type. Therefore, the vulnerability impacts and identify the most suitable measures to raise assessment will be refined to reflect peculiar characteris- the resilience. tics and features of historic buildings that might increase 458
The resilience assessment will be implemented as a References
web-based, semi-quantitative, multi-stakeholder self-as- [1] ARCH Advancing Resilience of Historic Areas Against
sessment questionnaire that covers topics like govern- Climate-related and Other Hazards, https://savingcultur-
ance processes to increase resilience, financing resili- alheritage.eu/, accessed on Sep. 15, 2020.
ence, restoration and recovery for resilience, social jus- [2] European Commission, Europe's Cultural and natural
 Heritage in Natura 2000. Publications Office of the Eu-
tice in resilience management, and environmental issues
 ropean Union, Luxembourg, 2018 .
in resilience. The resilience assessment is intended to
 [3] Nicol S., Roys M., Ormandy D., Ezratty V. The cost of
guide users through this process, link to relevant tools at poor housing in the European Union. University of War-
appropriate steps and support better coordination among wick, 2016.
relevant actors. The result of the resilience assessment [4] Nabielek K., Hamers D., Evers D. Cities in Europe –
will be given as a weighted resilience score for the his- Facts and Figures on cities and urban areas, PBL Pub-
toric area with linked resilience enhancing measures and lishers, The Hague, 2016.
additional information for decision-makers. [5] Tweed C., Sutherland M. Built cultural heritage and sus-
 tainable urban development. Landscape and urban plan-
 ning, 2007, 83(1): 62-69.
6 Conclusion [6] ICOMOS, 19GA 2017/30, Resolutions of the 19th Gen-
 eral Assembly, 11.-15.12.2017, New Delhi, India.
We described the planned use of modelling and simula-
 [7] Bigio A. G., Ochoa M. C., Amirtahmasebi R. Climate-
tion for assessing the resilience of historic areas against
 resilient, Climatefriendly World Heritage Cities. Urban
the impact of climate change and other extreme events. Development Series Knowledge Papers, Bd. 19, World
Aims and scope of the ARCH project were introduced, Bank, Washington, DC, 2014.
the CIPCast Simulation and Decision Support System, its [8] Global Platform for Disaster Risk Reduction, Heritage
planned extensions, as well as a brief application exam- and Resilience. Issues and Opportunities for reducing
ple were described. disaster risks, Global Platform for Disaster Risk Reduc-
 As next research steps, CIPCast will be extended as tion, Geneva, Switzerland, 2013.
described in section 4. The hazard models and simulation [9] Di Pietro, A., Lavalle, L., La Porta, L., Pollino, M., To-
approaches will be integrated with a database of resili- fani, A., Rosato, V.: Design of DSS for Supporting Pre-
 paredness to and Management of Anomalous Situations
ence building measures to support formulation and com-
 in Complex Scenarios. in: Setola R., Rosato V., Kyriaki-
parison of resilience building strategies. These function- des E., Rome E. (Eds.): Managing the Complexity of
alities will be integrated in a resilience assessment frame- Critical Infrastructures, A Modelling and Simulation Ap-
work based on the UNDRR Disaster Resilience Score- proach, Springer, 2016, pp 195-232.
cards for cities and buildings that include further – non- [10] Rome E., Doll T., Rilling S., Sojeva B., Voÿ N., Xie J.:
physical – resilience aspects (e.g. community resilience) The Use of What-If Analysis to Improve the Management
to support the formulation of comprehensive resilience of Crisis Situations Chapter 10, in: Setola R., Rosato V.,
 Kyriakides E., Rome E. (Eds.): Managing the Complex-
actions plans for historic areas.
 ity of Critical Infrastructures, A Modelling and Simula-
 tion Approach, Springer, 2016.
Acknowledgements
 [11] Giovinazzi, S., Pollino, M., Ciarallo, F., Rosato, V.,
This paper has been prepared in the framework of the Eu- Luigi La Porta, L., Di Pietro., A., Clemente, P., Buffa-
ropean project ARCH – Advancing Resilience of historic rini, G., (2019). A Decision Support System for the
areas against Climate-related and other Hazards. This Emergency Management of Highways in the Event of
project has received funding from the European Union’s Earthquakes. ANIDIS XVIII, Ascoli Piceno, Settembre
 2019.
Horizon 2020 research and innovation programme under
 [12] INSPIRE Knowledge Base, https://inspire.ec.europa.eu/,
grant agreement no. 820999. The sole responsibility for
 accessed on March 4, 2020.
the content of this publication lies with the authors. It
 [13] D'Alessandro, A., Costanzo, A., Ladina, C., Buongiorno,
does not necessarily represent the opinion of the Euro- F., Cattaneo, M., Falcone, S., La Piana, C., Marzorati, S.,
pean Union. Neither the EASME nor the European Com- Scudero, S., Vitale, G., Stramondo S., and Doglioni C..
mission are responsible for any use that may be made of Urban Seismic Networks, Structural Health and Cultural
the information contained therein. Heritage Monitoring: The National Earthquakes Obser-
 vatory (INGV, Italy) Experience. Front. Built Environ.,
 05 November 2019.

 459
https://doi.org/10.3389/fbuil.2019.00127 [25] Ambraseys, N.N., Simpson, K.A. And Bommer, J.J..
[14] RAMSES Science for cities in transition, https://ramses- Prediction of horizontal response spectra in Europe.
 cities.eu/home/, accessed on March 4, 2020. Earthquake Eng. Struct. Dyn., 25: 371-400, 1996.
[15] Giovinazzi, S., Pollino, M., Kongar, I., Rossetto, T., [26] Sabetta, F., Pugliese, A.. Estimation of Response Spectra
 Caiaffa, E., Di Pietro, A., La Porta, L., Rosato, V., To- and Simulation of Nonstationary Earthquake Ground
 fani, A., Towards a Decision Support Tool for Assessing, Motions. Bull. Seismol. Soc. Am. 86, 337–352, 1996.
 Managing and Mitigating Seismic Risk of Electric Power [27] Cauzzi, C., Faccioli, E.. Broadband (0.05 to 20 s) pre-
 Networks. Computational Science and Its Applications - diction of displacement response spectra based on
 ICCSA 2017. In: Lecture Notes in Computer Science, worldwide digital records. J Seismol 12, 453, 2008.
 Part III, LNCS 10406, pp. 399-414. Springer Interna- [28] Giovinazzi S., The vulnerability assessment and the
 tional Publishing, 2017a. damage scenario in seismic risk analysis, Ph.D The-sis
[16] Lagomarsino, S., Giovinazzi, S., Macroseismic and me- of the doctoral course “Risk Management on the built
 chanical models for the vulnerability and damage as- environment” jointly organized by University of Flor-
 sessment of current buildings. Bull. Earthq. Eng. 4, 415- ence (I) and TU-Braunschweig (D), 2005.
 443, 2016. [29] Lagomarsino, S., Giovinazzi, S. Macroseismic and me-
[17] Matassoni, L., Fiaschi, A., Giovinazzi, S., Pollino, M., chanical models for the vulnerability and damage as-
 La Porta, L., Rosato, V., A geospatial decision support sessment of current buildings. Bull Earthquake Eng 4,
 tool for seismic risk management: Florence (Italy) case 415–443 (2006). https://doi.org/10.1007/s10518-006-
 study. Computational Science and Its Applications - IC- 9024-z
 CSA 2017. In: Lecture Notes in Computer Science. Part [30] Grünthal G (ed) European Macroseismic Scale 1998
 II, LNCS 10405, pp. 278-293, Springer International (EMS-98). Cahiers du Centre Européen de Géody-na-
 Publishing, 2017. mique et de Séismologie 15, Centre Européen de Géody-
[18] D'Agostino, G., Di Pietro, A., Giovinazzi, S., La Porta, namique et de Séismologie, Luxembourg, 99 p, 1998.
 L., Pollino, M., Rosato, V., Tofani, A.. Earthquake Sim- [31] V. Rebollo, V. Latinos, I. Balenciaga, R. Roca. ARCH
 ulation on Urban Areas: Improving Contingency Plans D7.2 Mapping and characterisation of good practices in
 by Damage Assessment. In: Luiijf E., ZÃåutautaiteÃá I., cultural heritage resilience. ARCH H2020 Project GA
 HaÃàmmerli B. (eds) Critical Information Infrastruc- No. 820999, https://savingculturalheritage.eu/re-
 tures Security. CRITIS 2018. Lecture Notes in Computer sources/deliverables (accessed on September 15, 2020),
 Science, vol 11260, 72-83. Springer, Cham, 2019. 2020.
[19] Dolce, M., Nicoletti, M., De Sortis, A., Marchesini, S., [32] RESIL, KP, NCRS, ENG, INOV, TROIA, BU, UWA,
 Spina, D., and Talanas, F. Osservatorio sismico delle D6.6: STORM Damage Assessment and Decision Sup-
 strutture: the Italian structural seismic monitoring net- port Services, STORM H2020 Project Grant Agreement
 work. Bull. Earthq. Eng. 15, 621-641. doi: No.: 700191, 2016.
 10.1007/s10518-015-9738-x, 2017. [33] A Chiabrando, F., Colucci, E. & Lingua, A., Matrone, F.,
[20] Giovinazzi, S., Di Pietro, A., Mei, M., Pollino, M., Noardo, F., Spano, A., A European Interoperable Data-
 Rosato, V.: Protection of Critical Infrastructure in the bade (EID) to increase resilience of cultural heritage.
 Event of Earthquakes: CIPCast-ES. Proc. XVII ANIDIS ISPRS Journal of Photogrammetry and Remote Sensing.
 Conference, Pistoia, Italy, 2017, pp. 62-70. XLII. 151-158. 10.5194/isprs-archives-XLII-3-W4-151-
[21] Copernicus Climate Change Service, https://climate.co- 2018, 2019.
 pernicus.eu/, accessed March 4, 2020. [34] Lückerath, D., Streberova, E., Bogen, M., Rome, E.,
[22] United Nations office for Disaster Risk Reduction: Dis- Ullrich, O., Pauditsova, E.: Climate Change Impact and
 aster Resilience Scorecard for Cities, Vulnerability Analysis in the City of Bratislava: Applica-
 https://www.undrr.org/publication/disaster-resilience- tion and Lessons Learned. In: Nadjm-Tehrani S. (ed)
 scorecard-cities, 2017. Critical Information Infrastructures Security. CRITIS
[23] Taraglio, S., Chiesa S., La Porta, L., Pollino, M., Ver- 2019. Lecture Notes in Computer Science, Vol. 11,777.
 decchia, M., Tomassetti, B., Colaiuda, V., Lombardi, A.. Springer, 2019, pp. 83-94
 Decision Support System for smart urban management: [35] European Climate Adaptation Platform Climate-ADAPT
 resilience against natural phenomena and aerial envi- https://climate-adapt.eea.europa.eu/knowledge/tools/ur-
 ronmental assessment. International Journal of Sustaina- ban-ast, (accessed Sep 15, 2020), partnership between
 ble Energy Planning and Management, Vol. 24, 2019. the European Commission and European Environment
[24] Faccioli, E., Cauzzi, C.. Macroseismic intensities for Agency.
 seismic scenarios estimated from instrumentally based [36] UNDRR ARISE, Disaster resilience scorecard for in-
 correlations. In: Proc. of the First European Conference dustrial and commercial buildings. For use by building
 on Earthquake Engineering and Seismology - Geneva, owners, operators and managers, https://www.preven-
 Switzerland, 3-8 September 2006 . ECEES, 2006. tionweb.net/publications/view/69845 (acc. Sep 14, 2020)

 460
You can also read