Mapping liveability in the Indigo Shire - recommendations for improving walkability and connections with nature for older residents Report No. 154 ...
←
→
Page content transcription
If your browser does not render page correctly, please read the page content below
Mapping liveability in the Indigo Shire –
recommendations for improving walkability and
    connections with nature for older residents
                                 Report No. 154

                                     Ana Horta
                                 Rachel Whitsed

                              ISBN 978-1-86-467403-3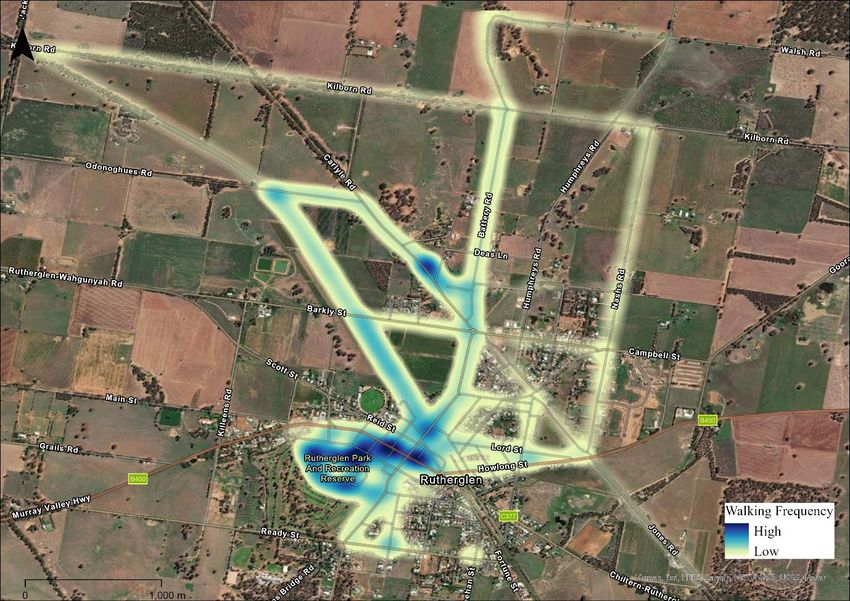
Mapping liveability in the Indigo Shire

Mapping liveability in the Indigo Shire – recommendations for improving walkability and
connections with nature for older residents

Ana Horta and Rachel Whitsed

Cataloguing in publication provided by the Institute for Land, Water and Society (ILWS), Charles Sturt
University, Albury NSW 2640

To be cited as:

Horta, A. & Whitsed, R. (2021). Mapping liveability in the Indigo Shire – recommendations for
improving walkability and connections with nature for older residents. Report No. 154. Charles Sturt
University, 38p. Accessed from https://www.csu.edu.au/research/ilws/publications/ilws-
reports/2021-reports/Horta-Indigo-Shire-Liveability.pdf

This report combines the reports for two Charles Sturt research projects:

    •   RM102845 Indigo Shire Liveability Atlas Pilot Project: Social Dimensions (20/6/2019-
        30/8/2021)
    •   RM102868 Indigo Shire Liveability Atlas Pilot Project: Walkability (21/6/2019-31/8/2021)

For further information contact:

Dr Ana Horta
Charles Sturt University
Institute for Land, Water and Society
ahorta@csu.edu.au

Disclaimer: Information contained in this report has been formulated with all due care, Charles Sturt
University does not warrant or represent that the report is free from errors or omission, or that it is
exhaustive. Charles Sturt disclaims, to the extent permitted by law, all warranties, representations or
endorsements, express or implied, with regard to the report including but not limited to, all implied
warranties of merchantability, fitness for a particular purpose, or non-infringement. Charles Sturt
further does not warrant or accept any liability in relation to the quality, operability or accuracy of
the report. The report is made available on the understanding that Charles Sturt and its employees
and agents shall have no liability (including but not limited to liability by reason of negligence) to the
users of the report for any loss, damage, cost or expense whether direct, indirect, consequential or
special, incurred by, or arising by reason of, any person using or relying on the report and whether
caused by reason of any error, omission or misrepresentation in the report or otherwise. Users of
the report will be responsible for making their own assessment of the information contained within
and should verify all relevant representations, statements and information. Furthermore, whilst the
report is considered to be true and correct at the date of publication, changes in circumstances after
the time of publication may impact upon the accuracy of the presented information.

Some of the data used in this publication is sourced from the Census of Population and Housing,
2016, Australian Bureau of Statistics. Copyright Commonwealth of Australia, 2018, see
abs.gov.au/copyright. ABS data licensed under Creative Commons, see abs.gov.au/ccby.

Charles Sturt University
                                                    i
Mapping liveability in the Indigo Shire

Table of Contents
1.     Introduction .................................................................................................................................... 1
     1.1.      Liveability ................................................................................................................................ 2
     1.2.      Walkability .............................................................................................................................. 2
     1.3.      Attitudes towards nature ........................................................................................................ 3
     1.4.      How we collected and analysed our data ............................................................................... 3
2.     Chiltern and Rutherglen demographics and characteristics ........................................................... 7
     2.1.      Chiltern .................................................................................................................................... 7
     2.2.      Rutherglen............................................................................................................................... 8
3.     Who participated? .......................................................................................................................... 9
4.     Walking patterns and health......................................................................................................... 11
     4.1.      How walkable is Chiltern? ..................................................................................................... 11
     4.2.      How walkable is Rutherglen? ................................................................................................ 12
     4.3.      Individual demographics and health status .......................................................................... 19
5.     Engaging with nature and open space .......................................................................................... 23
6.     Summary of findings ..................................................................................................................... 24
7.     Recommendations ........................................................................................................................ 25
Acknowledgements............................................................................................................................... 27
References ............................................................................................................................................ 28
Appendix A – GPS participant survey responses .................................................................................. 30
Appendix B – General survey responses ............................................................................................... 34

Charles Sturt University
                                                                              ii
Mapping liveability in the Indigo Shire

1. Introduction
Population ageing is one of the most important social and policy               % population aged over 65
issues we are facing today. In Australia, the population has been         30          Metro
on an ageing trajectory for over the past century. The number                         Regional
                                                                          25
of people aged over 65 is projected to nearly double from 3.8
                                                                      %   20
million in 2017 to over 6.4 million in 2042, with those aged over
                                                                          15
85 more than doubling to over 1 million (ABS 2018). This
increase is projected to be greater in regional areas compared            10

                                                                               2017
                                                                               2021
                                                                               2025
                                                                               2029
                                                                               2033
                                                                               2037
                                                                               2041
                                                                               2045
                                                                               2049
                                                                               2053
                                                                               2057
                                                                               2061
                                                                               2065
to metropolitan areas.
                                                                                              Year
In northeast Victoria, the number of older people will double in
the next decade. More than one in four people will be over 65
years of age and half of these people will live outside the urban centres of Wangaratta, Benalla, and
Wodonga. Adapting now to population ageing is crucial for rural communities to remain thriving
places for individuals and families to live, learn, work and play.

This report focuses on aspects of walkability and connections with nature for older residents in the
Indigo Shire in northeast Victoria, with case studies using the towns of Chiltern and Rutherglen.

The increase in the numbers of older people presents a significant policy and planning issue for the
provision of health, aged care, housing and infrastructure and social and recreational services. This is
a challenge for many stakeholders at all levels of government, including local government.

The World Health Organisations’ Checklist of Essential Features of Age-Friendly Cities (2007) includes
clean and pleasant public areas; sufficient, well-maintained and safe green spaces and outdoor
seating; well-maintained pavements [footpaths]; sufficient and safe pedestrian crossings; and

Charles Sturt University
                                                   1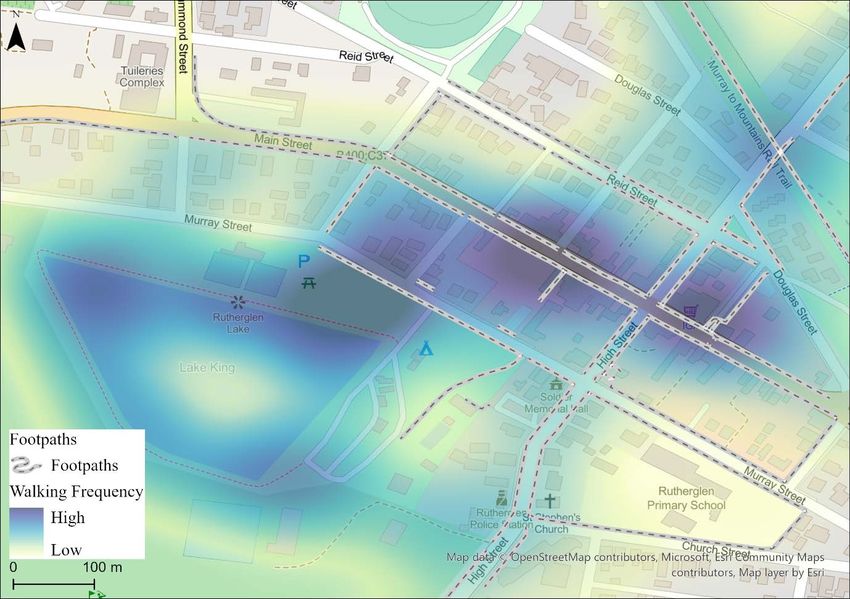
Mapping liveability in the Indigo Shire

accessible and well-connected public transport. These are some of the factors that make a city more
liveable for older people.

1.1.    Liveability
                                               Liveability refers to safe, socially cohesive, inclusive and
                                                environmentally sustainable communities, including
                                                such attributes as affordable housing, adequate public
                                                transport, walking infrastructure and sufficient and
                                                appropriate public open spaces (Australian Urban
                                                Observatory 2020). There is a research gap to be
                                                addressed however in how we quantify ‘liveability’ in
                                                regional cities and areas, since most of the current
                                                indicators are suited for urban/metropolitan areas. For
                                                example, population density and area of public open
                                                space per population can have very different meanings
                                                in regional towns compared to large metropolitan
                                                centres.

                                                    Liveability includes such attributes as affordable
                                                    housing, adequate public transport, walking
                                                    infrastructure and sufficient and appropriate public
                                                    open spaces

In the context of this report, we examine
liveability through the lens of walkability, use of public open space and attitudes towards nature,
focussing on the experiences of older people in regional towns. A particular emphasis is placed on
walkability, and this is described in further detail in the following section.

1.2.    Walkability
Research shows that walking is an important component of active health ageing (McPhee et al.
2016), providing physical and mental health benefits, independence, and social connections.
‘Walkability’ is a measure of how the built and natural environment encourages or impedes physical
activity and active transport (walking and cycling for transport) (Leslie et al. 2007; Owen et al. 2007).

The importance of understanding walking behaviour has been recognised in public health planning,
reinforcing the need for a multidisciplinary approach to urban planning policies (Leslie et al. 2007;
Frank et al. 2010; Mayne et al. 2017). This shift in thinking needs to be supported by methodologies
that help quantify where and how people walk. Walking activity can be captured in various ways,
such as journals, but the use of GPS technology in walkability research is increasing rapidly and is
                                                           considered the ‘best practical standard’ in
                                                           walkability studies (Scully et al. 2017), due to
  Walkability is a measure of how the built and            its ability to accurately measure where
  natural environment encourages or impedes                walking occurs, for how long and how often,
                                                           and hence provide novel insights on how
  physical activity and active transport
                                                           individuals interact with their environment.

Charles Sturt University
                                                     2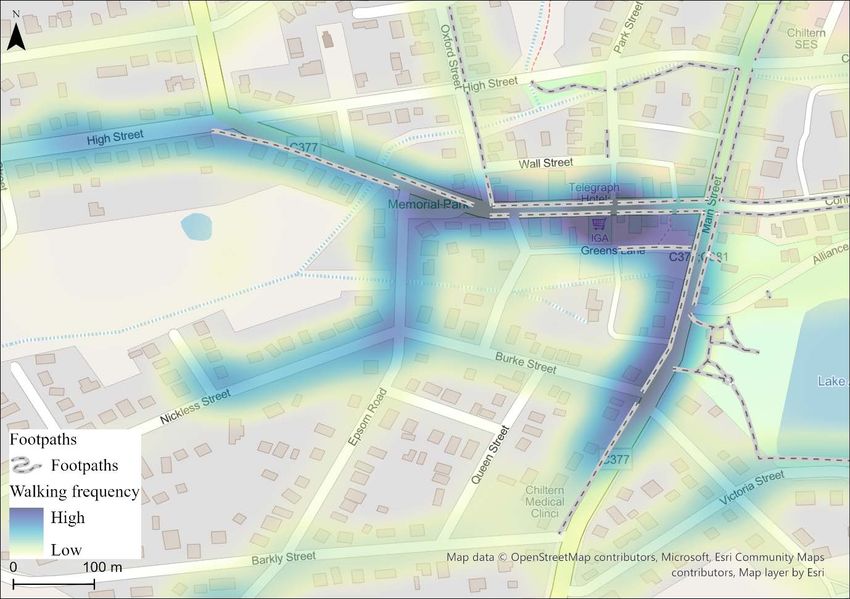
Mapping liveability in the Indigo Shire

Walking behaviours can be linked to
general indicators of health by creating        Use of GPS technology in walkability research is
an opportunity for regular physical             considered the best practical standard
activity and has been credited with
reducing the risks of chronic diseases,
obesity, and cancer, as well as improving general physical and mental wellbeing. Walking is
particularly beneficial for older adults as it has been shown to increase longevity, prevent diseases,
help with falls prevention, and improve mental health (Weiss et al. 2010, Towne et al. 2016).

1.3.    Attitudes towards nature
                                                 How people interact with their environment, and in
                                                 particular the natural environment, is also a
  Access to nature was ranked fourth by
                                                 significant component of liveability. Having access
  Australians as a liveability attribute         to public open space is important but these spaces
                                                 also need to meet the needs of the community. In
                                                 the Life in Australia survey, access to natural
environment was ranked 4th by Australians as a liveability attribute after feeling safe, affordable
decent housing and high-quality health services (IPSOS, 2020). In the same report, Australians in
regional areas also placed more importance on access to the natural environment (61%) compared
to their metropolitan
counterparts (39%). Another
study (White et al. 2019) found
that the amount of time people
spent outside in nature was
positively related to health and
well-being, and that two hours a
week is sufficient to reap health
benefits.

We therefore also interrogated
people’s attitudes towards nature
– what is their relationship with
nature, does it influence their
core values, and who do they
think is responsible for looking
                                      Natural area near Chiltern. Source: W Davison
after the natural environment?

1.4.    How we collected and analysed our data
This project aimed to measure and map walkability for older people in regional Australia, using the
regional Victorian towns Chiltern and Rutherglen as case studies. In addition, the project aimed to
evaluate the participation of older people in recreation and active transport in these communities
and examine the attitudes, barriers and opportunities linked to how people value nature and
interact with it. To achieve these aims a number of data collection methods were used.

Surveys
A general survey on walkability in Indigo Shire was hosted on the Indigo Shire council website, with
questions on perceptions of neighbourhood walkability. In addition, an expanded survey (‘GPS
participant survey’) was completed by participants in the GPS-tracker group (see below), with
additional demographic questions and self-reported health and activity questions. The survey format

Charles Sturt University
                                                     3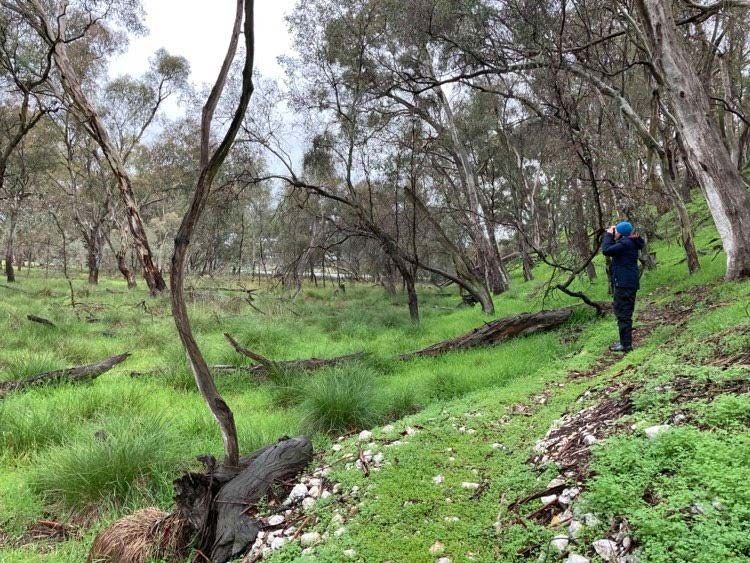
Mapping liveability in the Indigo Shire

and type of questions were based on the WHO Global Physical Activity Questionnaire (GPAQ)
Analysis Guide (WHO, 2018), the University of Cambridge EPIC-Norfolk Study Physical Activity
Questionnaire (National Cancer Institute, 2018) and a sitting time study by Katzmarzyk et al. (2009).

GPS data
Participants (target group people aged over 65) were recruited in Chiltern and Rutherglen to wear
GPS activity devices for one week in two different seasons, January-March 2020, and April-May
2021, to directly observe where and when participants walked. The GPS device used is a lightweight
(22g) QStarz BT-Q1300ST sports recorder with point
locations collected at regular 5-second intervals.
Participants were asked to turn the device on when
leaving the house with the purpose of walking
(either as a means of transport, for exercise or for
recreation) and turn it off when returning home.
Point GPS data was downloaded from each device,
processed and aggregated to generate continuous
lines representing walking patterns.                    GPS tracker

Interviews and focus groups
One-on-one interviews were conducted in early 2020 via zoom, recorded and transcribed. Two focus
groups were conducted in May 2021, one in Rutherglen, and one online for Chiltern participants.
Questions for discussion focused on the range of features that might make it more or less likely that
participants do or would use public open space and national parks in the area, and attitudes towards
nature. Interviews and focus group discussions were thematically analysed to uncover common
themes.

Observations
We collected basic demographic and activity data of people present in our target natural spaces at
specific point in times. These momentary scans of natural space activity contribute to building an
overall picture of how people use natural space in the Indigo Shire. We selected 13 locations (six in
Chiltern and seven in Rutherglen), including one location in each town centre as a control site.

The locations chosen for observation in Chiltern were Barkers Rd (entrance to Mt Pilot-Chiltern
National Park), Bushland Reserve on Conness St, Chiltern Oval, the far side of Lake Anderson, the
area near the playground by the lake, and Chiltern town centre (corner Conness and Park Streets).

Charles Sturt University
                                                   4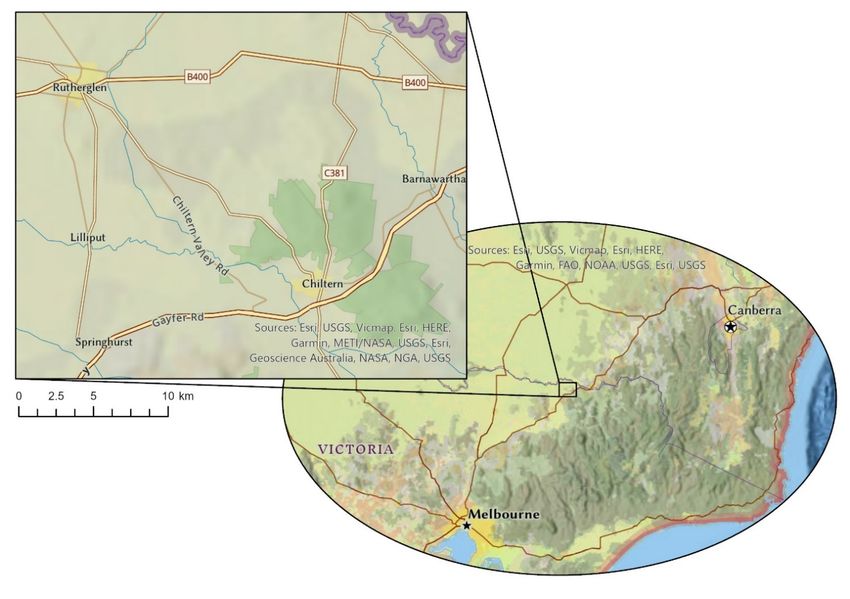
Mapping liveability in the Indigo Shire

The locations chosen for observation in Rutherglen were Lions Park, Figtree Park, Barkly Park (oval),
the area near the playground at the lake, the far side of King Lake, the Wine Bottle and Rutherglen
town centre (Main St).

We observed each location 12 times across both weekdays and weekends, and across different time
periods (morning, noon, afternoon, and evening), following the SOPARC methodology (McKenzie et
al. 2006; Evenson et al. 2016) for observing activity in public open spaces. Gender was recorded as

Charles Sturt University
                                                  5
Mapping liveability in the Indigo Shire

well as approximate age (infant 0-1/preschool 2-4/primary aged 5-12/teenager 13-17/adult 18-
64/older adult 65-84/elderly over 85) but these were aggregated into three groups (child 0-17/adult
18-64/older adult over 65) for analysis. Activity level was recorded as sedentary (lying down, sitting,
or standing still), using a wheelchair (aggregated with sedentary for analysis), walking, or vigorous
activity. Groupings were assessed as alone or with others. Descriptive statistics were used to analyse
the demographics and activities of people observed visiting these locations.

Considerations related to COVID-19
The COVID-19 pandemic and related restrictions impacted on data collection activities and timelines,
and it should be recognised that if this research had been carried out in a different year, results may
have differed. Recruitment of participants for the GPS activity tracking, surveys, focus groups and
interviews was hampered by restrictions, with some activities moving online (interviews, one focus
group) and others having fewer participants than expected. In addition, activities including focus
groups, and the second season of GPS activity tracking were delayed significantly. Finally, the
observations were carried out in winter during a lull in restrictions and are therefore unlikely to
represent the full range of use of public open space. This research should be seen as a snapshot in
time and could in fact form a useful baseline of activity during the pandemic.

Chiltern town centre (source: Indigo Shire)

Charles Sturt University
                                                   6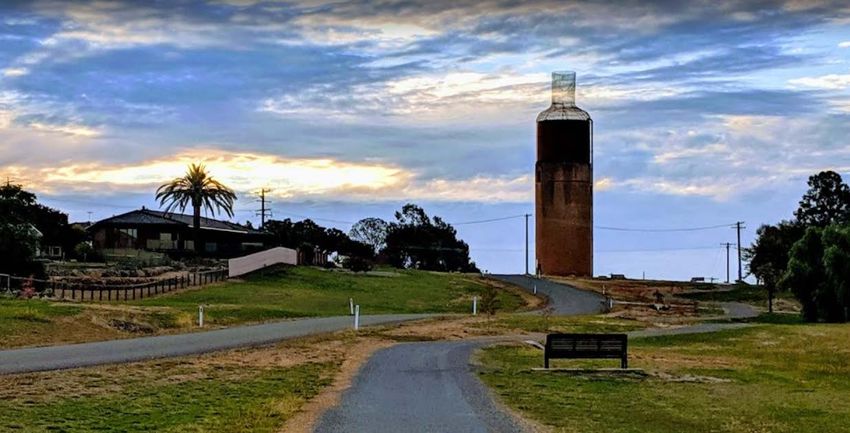
Mapping liveability in the Indigo Shire

2. Chiltern and Rutherglen demographics and characteristics
Rutherglen and Chiltern are towns in Indigo Shire, each with a significant over-65 population. The
demographics reported below are from the 2016 census (ABS 2016).

The Indigo Shire is in the Hume region in northeast Victoria, covering 2,040km2 and with a
population of 15,952 in 2016. Across the shire 20.6% of the population are aged over 65, with a
median age of 46. For comparison, the state of Victoria has 15.6% of the population aged over 65
and a median age of 37. The largest towns in Indigo Shire are Beechworth, Rutherglen,
Yackandandah, Chiltern, and Wahgunyah.

           Location†                    Total         Percent        Percent       Median   Percent aged
                                   population           male          female          age        over 65
           Indigo Shire LGA           15,952           49.3%           50.7%           46         20.6%
           Beechworth                  3,859           49.7%           50.3%           49         24.2%
           Rutherglen                  2,378           48.2%           51.8%           47         23.3%
           Yackandandah                1,811           47.5%           52.5%           48         22.6%
           Chiltern                    1,605           49.1%           50.9%           47         19.5%
           Wahgunyah                   1,098           49.8%           50.2%           44         22.9%
†
    State suburb (gazetted locality), except for Indigo Shire LGA

According to the Indigo Shire Municipal Public Health and Wellbeing Plan (2018-2021), Indigo Shire
rates higher than Victoria averages for health conditions (obesity, cancer, cardiovascular and
respiratory diseases, dementia) and unintentional injuries.

2.1.       Chiltern
Chiltern is located 20km southeast of Rutherglen, 40km northeast of Wangaratta and 30km west of
Wodonga. In 2016, the population in Chiltern was 1,605, with 784 males and 813 females and a
median age of 47. There were 312 people aged over 65 (19.5%).

Chiltern is a historic town built in
the late 1850s during the gold
mining period. It boasts an iconic
main street with well-preserved
historic buildings (including the
post office, the masonic hall, and
the former courthouse). The town
is surrounded by Chiltern-Mt Pilot
National Park, an area that spans
over 21,560 ha, initially created to
protect Box–Ironbark forest. It is
an area popular for cycling with
trails in and about the national
park.

                                                 Lake in Chiltern (source L Smallbone)

Charles Sturt University
                                                           7
Mapping liveability in the Indigo Shire
2.2. Rutherglen
Rutherglen is located on the border between Victoria and New South Wales, 40km north of
Wangaratta and 40km west of Wodonga. In 2016, the population in Rutherglen was 2,378, with
1,147 males and 1,231 females and a median age of 47. There were 554 people aged over 65
(23.3%).
The town of Rutherglen was established
during the gold-rush but continued to
grow afterwards as an agricultural town,
surrounded by large grazing areas. Now,
it is one of the Victoria’s most important
wine production regions. The wineries
and other local producers and shops
attract tourists all year around.
Lake King, Rutherglen (source R Whitsed)
Rutherglen Wine Bottle (source Google Street View)
Charles Sturt University
8Mapping liveability in the Indigo Shire
3. Who participated?
GPS data and GPS participant survey
Overall, 32 participants carried a GPS activity device and completed the GPS participant survey. All
17 participants in Chiltern were aged over 65, while in Rutherglen nine of the 13 participants were
aged over 65, with four in the 50-64 age bracket. Because of the difficulties in recruiting participants
due to COVID-19, these participants were included even though they are outside of the target age
group. Overall, 80% of participants were female (76% in Chiltern and 85% in Rutherglen). The
majority of participants were recruited in the first season between January and March 2020 (24
participants, 16 from Chiltern and eight from Rutherglen), with eight participants in the second
season between April and May 2021 (one from Chiltern and seven from Rutherglen). The
participants were geographically spread in terms of their home location, providing a good spatial
coverage. On average, our participants carried the GPS activity device for 3.3 days in Chiltern and 3.6
days in Rutherglen, suggesting a walking frequency of 3-4 times a week (although it is possible that
walking activity was carried out but not recorded). Data for the two seasons were aggregated for
each town.
General survey
The target population for the general survey were older people living in the Indigo Shire, but the
survey was open to all residents. There were 23 responses to the general survey (87% female), with
five participants each from the larger Indigo Shire towns of Beechworth, Chiltern, and Rutherglen,
two from Yackandandah, and five from other localities in Indigo Shire. Most respondents in the
general survey were aged over 65 (61%) (Appendix B).
Interviews and focus groups
Three stakeholders participated in the interviews, the Ageing Well Officer for Indigo Shire Council, a
retired teacher in Chiltern who’s been involved in aged care, and the principal strategic advisor for
the Age-Friendly Northeast Victoria Alliance. The Chiltern focus group had two participants (one
male and one female) and the Rutherglen focus group had five participants (all female). Both the
interviews and the focus groups were hampered by Covid-19 restrictions, with difficulties both in
recruiting participants and in meeting face-to-face. Hence the number of participants is lower than
anticipated, but still sufficient to provide valuable insights.
Observations
We observed a total of 551 people over 12 observation periods (scans) at each site, 126 people in
Chiltern and 425 in Rutherglen. Of these, 208 (37 in Chiltern and 171 in Rutherglen) were engaged in
organised sport at Chiltern Oval and Barkly Park in Rutherglen and were excluded from further
analysis. The observation analysis therefore includes 343 people, 89 in Chiltern (56% male and 44%
female) and 254 in Rutherglen (50% male and 50% female). No people were observed in any of the
scans at Barkers Road (entrance to Chiltern-Mt Pilot National Park).
It should be noted that the GPS participants were not active in the same time periods as the
observations, and as the observations were carried out in winter around COVID-19 restrictions, they
do not necessarily show the pattern that would have been observed at the times the GPS
participants were walking.
Charles Sturt University
9Mapping liveability in the Indigo Shire
See maps on page 5 for locations of observation sites.
Track in Chiltern Mt Pilot National Park (source L Smallbone)
Charles Sturt University
10Mapping liveability in the Indigo Shire
4. Walking patterns and health
Both Chiltern and Rutherglen have a large lake (Lake Anderson in Chiltern and Lake King in
Rutherglen) surrounded by paths (both paved and unpaved), and a number of smaller public open
spaces. In both towns, only a small number of roads have footpaths.
Walking patterns are determined by two overarching factors – the environment, and the people
doing the walking. The environment includes the natural and built environment, and we explore
walkability for both towns and the environmental features that promote or hinder walkability in the
following three sections. The other overarching factor is the attributes of the people, where the
three main factors determining walking patterns for individuals are age, gender and health status.
We therefore in the later sections focus on these demographic attributes and specifically health
related to walking.
4.1. How walkable is Chiltern?
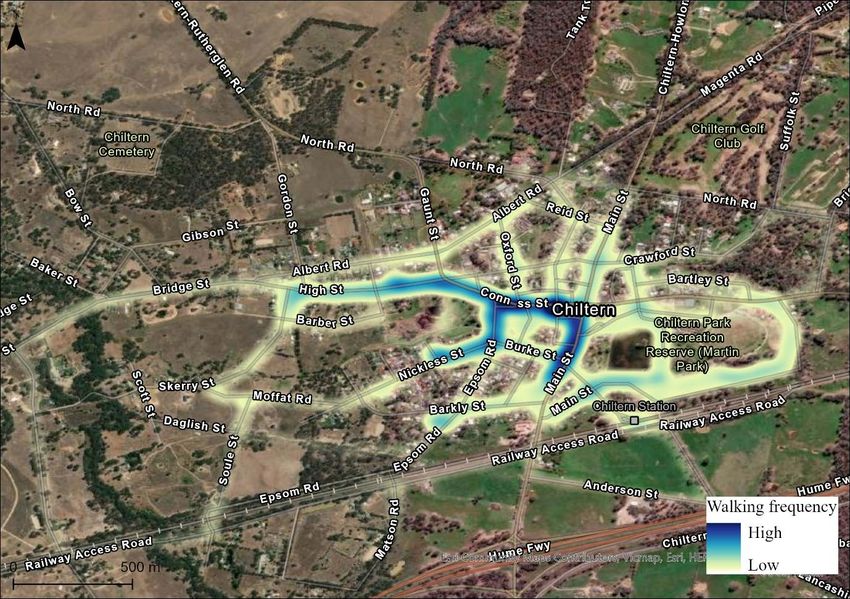
In Chiltern, the places most frequently used for walking were the town centre, both for our GPS
participants and the observations. In particular, GPS participants often visited the section of Main
Street between the Chiltern Medical Clinic and the Memorial Park, where most of the shops are
located.
Chiltern Walkability Map (source: GPS participants)
Other locations where both our GPS participants and the general public were observed walking
include the paths around Lake Anderson (in particular near the playground), the Senior Citizen’s hall
north of the lake on Conness Street and streets that have footpaths, leading to the town centre.
Charles Sturt University
11Mapping liveability in the Indigo Shire
Older people were not observed in any of the scans
outside of the Chiltern town centre, and in fact,
outside of the town centre, the area around the
playground by Lake Anderson was the only location
with any people present on at least half of the scans
(6 out of 12). Only seven older people (estimated
aged over 65) (7.9% of observations) were observed
in Chiltern. This is a lower proportion than
expected, given 19.5% of Chiltern’s population is
aged over 65, suggesting older residents in Chiltern
do not spend as much time in public open spaces as
their younger counterparts. Of the seven older
people observed in the town centre, four were
sitting and three were walking.
The reasons that people walk are varied, including
People observed at Chiltern scan sites (source: for active transport (for example, walking to the
observations)
shops), for exercise or for social reasons. As most of
the walking activity for older people in Chiltern
appears to be near the shops, it is likely that most walking for this age group is carried out as active
transport. In the Chiltern GPS participant survey, 69% of respondents walked at least 2-3 times for
transport in the last month, but only 19% walked
for transport at least 4 times a week (see chart in
Appendix A). One of the interviewees “It’s a boring thing, but I [walk] down to
corroborated this, observing that fewer older the supermarket to get the newspaper
people use green spaces in Chiltern for walking, every day” [Chiltern Focus Group]
and they tend to walk more for active transport
(shopping).
When walking for pleasure or exercise most Chiltern participants (59%) reported walking 4 times a
week or more, taking between 20 and 40 minutes (65%) most commonly in the morning (71%)
(Appendix A).
4.2. How walkable is Rutherglen?
The Rutherglen walkability map shows a similar pattern to Chiltern, with walking frequency higher in
the town centre where shops and services are located, as well as on the paths around Lake King and
the Recreation Reserve. Other notable walking areas include a section of the Murray to Mountains
Rail Trail, forming an approximately 4km loop track with Odonoghues Road, Carlyle Road, Hopetoun
Road and High Street.
Charles Sturt University
12Mapping liveability in the Indigo Shire
Rutherglen Walkability Map (source: GPS participants)
Barkly Park was observed to be used on most
days (10 out of 12) by people walking or
exercising, and the playground side of the lake
also had people present at most scans (9/12)
playing or walking, but few of these people
were aged over 65. In Rutherglen, only 19 older
people (7.5% of observations) were observed
across all locations. As with Chiltern, this is a
lower proportion than expected, given 23.2% of
Rutherglen’s population is aged over 65,
suggesting that in Rutherglen older people do
also not spend as much time in public open
spaces. In Rutherglen, of the 19 older people
observed, 11 were in the town centre, with a
small number observed at the lake (both on the
playground side and the far side), at Figtree
park and at Lions Park. People observed at Rutherglen scan sites (source:
observations)
Of the 11 older people observed in the town centre,
one was sitting and ten were walking. Of the remaining eight older people observed in public open
spaces, three were sitting, four were walking and one was using a mobility scooter.
Charles Sturt University
13Mapping liveability in the Indigo Shire
In Rutherglen, the walkability map suggests that walking is undertaken by older people both for
active transport (around the shops) and for leisure (around the lake and along the rail trail).
Rutherglen participants were more likely to report walking more frequently as a means of transport
compared to Chiltern particpants, with 75% walking at least 2-3 times in the last month for
transport, and 50% walking for transport at least 4 times a week (see chart in Appendix A). As with
Chiltern, the majority of these trips (58%) took less than 20 minutes.
When walking for pleasure, Rutherglen participants displayed the same behaviours as Chiltern
participants, walking 4 times a week or more (67%), taking between 20 and 40 minutes (67%) and
most commonly in the morning (67%). One of the interviewees suggested that Rutherglen’s working
class background (“It’s a hardworking town”) could mean that walking for exercise is not really a
priority there.
Self-reported walkability
Most participants from Chiltern (65%) and Rutherglen (75%) consider their town walkable (about
average, above average or very walkable). However, this means that 28% overall consider their town
to be below average or not walkable. In the general survey (Appendix B), over a third of respondents
said their town or neighbourhood was below average or not walkable.
Features that promote or inhibit walking
We asked our survey participants to identify the features that contribute to their neighbourhood or
town being walkable. Most participants rated footpaths as being the most important factor. Other
important features identified were presence of shade, pleasant scenery, places to stop and sit, and
availability of toilets.
Features promoting walkability
Town Most important Second most important Third most important
Chiltern Good footpath condition Lots of shade Lots of places to stop and sit
Rutherglen Good footpath condition Pleasant scenery Toilets available close by
The features that contribute most to lack of walkability were lack of footpaths, poorly maintained
footpaths, lack of shade and lack of places to stop and sit.
Charles Sturt University
14Mapping liveability in the Indigo Shire
Features inhibiting walkability
Town Most important Second most important Third most important
Chiltern Footpaths lacking, uneven Little to no shade Unpleasant surrounding
and/or in poor condition
Rutherglen Footpaths lacking, uneven Not many places to stop Little to no shade
and/or in poor condition and sit
Footpaths
Footpaths – both their existence and their
condition – were cited as the most important “Even just a block out of the shopping
factor for walkability in both surveys for both
centre becomes a sort of gravel goat
towns, and were mentioned at least 30 times in
track. And not a footpath” [Chiltern
interviews, focus groups and survey comments. In
particular, there was a strong consensus that
Focus Group]
Chiltern has insufficient footpaths.
Lack of footpaths also causes people to drive more than they would otherwise. It was also noted by
one of the interviewees that because Chiltern and Rutherglen are both old towns, they have big
culverts and unsteady footpaths. Likewise, many focus group participants mentioned having to walk
on the edge or even the middle of the road because of the high road camber and deep gutters.
In both towns, a considerable overlap is
visible on the walkability maps between
“I drive to meet a few friends and walk on an even places were people and walk and the
surface around Lake King. Walking around my existence of footpaths (see next page).
block is too uneven and too much traffic. No
Connections to Lake Anderson for
footpaths in my area of town” [Rutherglen GPS example could be improved, with no
participant survey] footpaths along Alliance Street (below
left) and Conness Street (below right)
leading to the lake.
Source: Google Street View
In Rutherglen, the footpath does not extend along Murray Street (below left) past the lake, and
sections of High Street (below right) do not have footpaths, providing limited connectivity to the
town centre.
Charles Sturt University
15Mapping liveability in the Indigo Shire
Source: Google Street View
Overlay of walkability and footpaths in Chiltern (Source: GPS participants)
Charles Sturt University
16Mapping liveability in the Indigo Shire
Overlay of walkability and footpaths in Rutherglen (Source: GPS participants)
Pedestrian crossings and traffic
Pedestrian crossings were not a “You see mobility scooters actually on the road mixing
strong theme in the data collected, with the traffic” [Chiltern Focus Group]
although the difficulties were
mentioned of crossing Main Street in
Rutherglen due to the volume of trucks. The lack of footpaths also meant that traffic was seen as an
issue where people had no choice but to walk on the road, and there was particular concern about
mobility scooters being on the road with traffic.
Shade and seating
While we have not specifically mapped shade or seating in Chiltern and Rutherglen, these were
mentioned in the surveys both as factors that promote (lots of shade, lots of places to stop and sit)
and impede (little to no shade, not many places to stop and sit) walkability. Shade was not explicitly
mentioned as an issue in focus groups
and survey comments, but it was noted
by participants that there is no shade
“Another thing Indigo Shire could do is seating. I’ve
on the Rail Trail in Rutherglen, making
noticed when I’ve been unable to walk very far, I’ve
it unpleasant for walking, and not much
paced myself by going from seat to seat. But there shade around Lake King.
are very few of those and there needs to be more
seating for mature people because they do need to Seating was mentioned more often. It
sit down” [Chiltern Focus Group] was recognised that in some places the
seating is appropriate, such as the seats
at the Wine Bottle in Rutherglen where
Charles Sturt University
17Mapping liveability in the Indigo Shire
people could admire the view. However, there were multiple comments about insufficient seating,
but also seating that is not age-friendly – for example, higher seats and higher armrests are needed.
Perceptions of safety
Aside from traffic safety, there was some mention of other safety concerns, including off-leash dogs
and perceptions of crime. However, by far the largest safety concerns were around traffic, and being
forced to walk closer to traffic because of inadequate footpaths.
Points of interest
Another emerging theme is that of points
of interest making a place more walkable.
This is partly captured in ‘pleasant
“There is something about telling the story of a
scenery’ being an important feature that
place within those landscapes that matters and
promotes walkability, but also includes
more than just natural scenery. Examples helps bring people into them, and the
cited included statues, artworks, signs, and intergenerational nature of that telling. Because if
interactive installations. The Rutherglen you’ve got things that encourage storytelling, it
Focus Group participants had suggestions gives the chance for connection with people. So,
such as installing an information sign having some of those cultural symbols embedded
about the Great Dividing Range and its in the park would be useful.” [Interviewee]
peaks at the Wine Bottle in Rutherglen,
and adding information about the old
winery that backs onto the Rail Trail.
In both Chiltern and Rutherglen the lakes (Lake
“We walk around [Lake King] every day. Anderson and Lake King) were clearly a focal point,
Some of us walk through the park to get although from both the walkability maps and the
to the lake.” [Rutherglen Focus Group] social data collected it is clear that Lake Anderson
in Chiltern is not used for walking to the same
extent as Lake King in Rutherglen. It was noted that
Lake Anderson has potential to be used much more, but that the track around it was not well
maintained, making it difficult to navigate for people with limited mobility. Although Lake King was
frequently used for walking, as evidenced both in the walkability map and the focus group
discussions, it was still noted that there are issues with the paths around the lake. In particular, the
far side of the lake is not as accessible to people with limited mobility and was perceived to have
many obstacles.
Outdoor exercise equipment was also mentioned and could provide a destination for a walk as well
as providing more opportunities for exercise.
Charles Sturt University
18Mapping liveability in the Indigo Shire
Specific locations mentioned by participants
A number of locations in Chiltern and Rutherglen were specifically mentioned by participants, and
these are highlighted here.
Town Location Comments
Chiltern Lake Anderson Lack of formal footpath structure
Main Street Rough footpaths
Bridge near war memorial Quite dangerous – narrow and disintegrating
Rutherglen Fig tree Really bad footpath around the fig tree
High Street Footpaths in poor condition
Driveway towards Too steep, gravelly, loose, horrible to walk on
Henderson Pavilion
Rail Trail Boring, hardly any trees, only one seat
Tower Place near James Really well maintained
Court
Main Street Dangerous crossing
Wine Bottle A lot of planting, Crepe Myrtles all the way down,
pathway well maintained
Reedy Street School buses, no footpaths, no curbing or guttering
Murray Street People in their mobility scooters in the middle of
the road
Lake King Unfriendly seating
4.3. Individual demographics and health status
Age and gender
Because of the bias towards females participating, and the fact that older people were the target
group, the demographics of the GPS participants do not directly inform us how gender and age
relate to walking habits. Research shows that women are more likely than men to participate in
walking groups or walk regularly with friends, and in particular older women (Ball et al. 2017). As
mentioned previously, 80% of the GPS participants were female with the majority aged over 65.
Overall, 180 people were observed walking (45 in Chiltern and 135 in Rutherglen), evenly split
between males and females across all age groups. We observed 29 people engaging in vigorous
activity (cycling, running, playing – excluding players of organised sport). Eleven of these were in
Chiltern and 18 in Rutherglen, mostly children and teenagers in playgrounds. No older adults were
observed to be engaging in vigorous activity. There were no statistical differences observed in
proportions of people who were sedentary (including sitting or standing still) and walking between
the general population and the older population, with a slightly higher proportion of older people
sedentary in Chiltern, and a higher proportion of older people walking in Rutherglen.
Charles Sturt University
19Mapping liveability in the Indigo Shire
Walking alone or with others
Whether people have somebody to walk with can also influence their walking habits. In both
Chiltern and Rutherglen, older people were more likely to be observed on their own than with
others compared to the general population, although it should be noted that the general population
includes children who are less likely to be on their own.
Most of the GPS survey participants from Chiltern said they tend to walk alone. None of the Chiltern
participants belonged to a walking group. For Rutherglen participants, the social pattern of walking
was evenly distributed between walking alone or in a group (with partner or family, with friends or
in a walking group). These results are consistent with the observations reported above.
Self-perceived physical activity
Self-perceived physical activity level is an important indicator that can be used to interpret
walkability patterns. Adults over 65 are recommended at least 30 minutes of exercise at least five
Charles Sturt University
20Mapping liveability in the Indigo Shire
days a week (ABS, 2019). In Victoria, only 22.3% of people aged over 65 meet these guidelines, but
48.5% engage in at least 150 minutes of exercise a week with 41.5% exercising at least 5 days a week
(ABS, 2019).
From the participant survey, 82% of Chiltern participants and 75% of Rutherglen participants
thought they were about the same or more active compared to other people their age. However, in
Rutherglen only 42% though they were more active than their counterparts while in Chiltern 59%
reported being more physically active than other people their age.
In the general survey (Appendix B), 67% of respondents reported being about the same or more
active than others their age with 57% reporting being more active. However, in the general survey,
24% reported being a lot less active, compared to only 8% in the Rutherglen participant survey and
0% in Chiltern participant survey. This is not surprising, as the participant survey consisted entirely of
people who do walk (as they had agreed to walk with the GPS devices), but the general survey
included inactive people.
The majority of GPS participants met the activity guidelines for people aged over 65, with
approximately two thirds walking at least 4 times a week for at least 20 minutes. However, this does
not mean that the population of Chiltern and Rutherglen aged over 65 meet these guidelines, and
the fact that very few older people were observed walking implies they probably do not.
Self-reported health status
The majority of GPS participants reported good health metrics, consistent with the general
population in this age group. This group cannot be assumed to be representative of the older
population in Chiltern and Rutherglen, as people who agreed to walk with GPS activity devices are
likely to more active than the general population. We asked our participants about their alcohol
consumption, fruit and vegetable consumption and weight and height.
Older people are more likely to drink daily, and the recommendations are no more than ten
standards drink a week and no more than two per day (NHMRC, 2021). In Victoria, 13.1% of people
over 65 exceed these guidelines (ABS, 2019). More than half of our participants consumed three
alcoholic drinks or less a week and only one (4%) exceeded guidelines (Appendix A).
The recommendations for daily fruit and vegetable consumption for older Australians are two
servings of fruit and 4.5 to 5.5 servings of vegetables, but only 60.2% (for fruit) and 10.1% (for
Charles Sturt University
21Mapping liveability in the Indigo Shire
vegetables) of Victorians aged over 65 meet recommendations, although these proportions are
higher than younger cohorts (ABS, 2019). Only 14% of our participants consumed at least the
recommended 7 servings of fruit and vegetables daily, but 62% consumed at least four portions a
day (Appendix A).
Over three quarters of Victorians aged over 65 are overweight or obese, with 39.5% overweight but
not obese (BMI 25-30) and a further 36.6% obese (BMI over 30) (ABS, 2019). Of our participants who
provided height and weight data, 36% were overweight but not obese and a further 36% obese,
consistent with state data.
Almost half (47%) of all Australians have one or more chronic health conditions, and the prevalence
of chronic conditions increases with age. In Victoria, 17.3% of people over 65 have diabetes mellitus
(Type II diabetes), 21.1% have cardiovascular disease and 40.3% have hypertension (ABS, 2019). In
addition, ABS report some chronic health conditions at a more granular level, and Chiltern and
Rutherglen appear to be healthier in this respect than wider Victoria. Chiltern recorded 10.7% (over
60s) to 13.5% (over 70s) with Type II diabetes and 16.0% (over 60s) to 21.9% (over 70s) with
cardiovascular disease. Rutherglen recorded 10.9% (over 60s) to 13.2% (over 70s) with Type II
diabetes and 15.0% (over 60s) to 19.8% (over 70s) with cardiovascular disease. Our GPS participants
had slightly higher rates of Type II diabetes (22%), higher rates of cardiovascular disease (31%) and
similar rates of hypertension (40%) compared to the town and state baselines. However, it is difficult
to say whether these health conditions influence walking behaviour – it is possible that health
conditions make walking more difficult, but it is also possible that having a chronic health condition
increases awareness of the importance of regular walking.
Participants in the focus groups and surveys
recognised that poor health in the older cohort “The walking thing started when we had
can limit walking, with limited mobility because some turmoil in our life. And so I found
of chronic asthma, surgery or other ailments.
that [walking] was a really good way of
However, the benefits of walking on health were
grounding myself” [Chiltern Focus Group]
also mentioned, and recognised as being
grounding and really good for both mind and
body.
Regent Honeyeaters Sculpture
in Chiltern (Source: W Davison)
Charles Sturt University
22Mapping liveability in the Indigo Shire
5. Engaging with nature and open space
Connection with nature and attitudes towards nature are also an important aspect of liveability. In
our focus groups and interviews we asked participants about their connections with nature, and who
they thought was responsible for looking after the natural environment.
Connection to nature
There was a strong sense of connection to nature
amongst the focus group participants in both Chiltern
“To have somewhere that draws and Rutherglen. In Chiltern the proximity of the
you in and lets you take advantage National Park was seen as very important, both
of [the natural environment], and ecologically and for human wellbeing. Appreciating the
give you exercise, and gets you natural environment was a common theme, from
outside and connects you, would be watching the ducks in Lake King in Rutherglen and
fantastic” [Interviewee] getting excited when the swans come back to enjoying
the wildflowers, birds and the way things change in
Chiltern National Park.
Looking after the environment
All participants thought it important that their
environments are looked after. Most thought “Our environments are really important
that individuals have some level of responsibility, for wellbeing and the survival of human
including recycling, participating in community beings as well. [It’s] very, very
garden schemes, picking up rubbish and lobbying
important to take care of it. And live in
council. There was awareness of groups such as
harmony with it” [Chiltern Focus Group]
Landcare and Friends of Chiltern Mt Pilot
National Park, and an appreciation of what they
do for the environment, but most participants
were not members of these groups.
Overall, most participants thought it
“There are some planter pots in the Main Street of was the Shire’s responsibility to look
Chiltern, and they look a bit neglected. Well, I asked after the environment, including
who looks after them, and [my neighbour] said ‘Oh planting more trees, installing more
rubbish bins and seats and improving
well, no one really does. We sometimes take out
walking paths. There was a
cigarette butts and cans and things like that’. But
recognition that these things are
there’s no specific group that looks after them.”
costly, and that not all of the natural
[Chiltern Focus Group] areas (such as the far side of Lake
King) are the Shire’s responsibility.
Sense of community
Some participants felt there was a
lack of sense of community,
particularly in Chiltern. This could be “I think Chiltern is one of those places where there
connected to the fact that while isn’t a culture of community involvement as much as
participants were aware of there is in, say, places like Yackandandah… Here
community groups, including there seems to be a sort of quite limited interest in
environmental groups, they had not community involvement” [Chiltern Focus Group]
taken steps to join.
Charles Sturt University
23Mapping liveability in the Indigo Shire
6. Summary of findings
Chiltern and Rutherglen are small towns with few walking opportunities for older residents. A
significant number of respondents said their town or neighbourhood was not walkable or below
average, and this was borne out in our GPS participants’ walking patterns and the observations.
Most of our participants consider themselves active and engage with walking both as a means of
transport and for pleasure and exercise. Most older people walk for active transport in the town
centre where shops and services are located. In Rutherglen the reserve around Lake King was also
used for leisure walking, often in groups. In Chiltern, in contrast, most older people walked alone
and the area around Lake Anderson was not often visited. Generally there are insufficient places in
both towns that are attractive for walking for exercise and leisure.
It was more difficult to ascertain why people weren’t walking in certain areas, but inaccessibility is a
major factor, often due to lack of footpaths. Some places that are pleasant to walk, such as Chiltern
Mt Pilot National Park, are too far to access on foot and are therefore not regularly visited by older
residents. People with mobility issues were not observed during our scans (bar one person in a
mobility scooter), and many focus group participants reported that both Chiltern and Rutherglen are
largely unsuitable for mobility scooters and wheelchairs, due to road and footpath configurations.
Only a small number of older people in both towns appear to be walking regularly, although we
cannot say this with any level of certainty. It does seem likely that the majority of older residents are
not meeting physical activity guidelines.
There are a number of changes that could improve the walkability of Chiltern and Rutherglen for
people over 65. Improving footpaths or adding footpaths on key roads would increase walkability
significantly. Walking on grass or dirt verges, or on the road itself, creates challenges to older people,
increasing the risk of accidents and reducing the ability to walk longer distances. Adding age-friendly
seats at strategic intervals would make longer walks more feasible for many older people. Other
features mentioned by participants that would improve their environment were outdoor exercise
equipment, interpretive signs and interactive installations.
Most participants had a strong sense of connection with the environment and appreciated living in
towns surrounded by nature. While people recognised that it is everybody’s responsibility to look
after the environment, there also seemed to be some hesitancy to actually join the groups that do so
in an organised way. This could be related to the view that there is a lack of sense of community,
particularly in Chiltern.
Charles Sturt University
24Mapping liveability in the Indigo Shire
7. Recommendations
1. Improve existing footpaths and identify locations for new footpaths that improve connectivity
Walkability will be significantly improved simply by making it possible for people to walk further on
safe footpaths. A small loop that connects the town centre, the lake, and existing footpaths with
new paths to create a safe and pleasant loop walk would encourage people to combine their active
transport with walking for leisure, increasing the likelihood that they walk most days. This would not
need to be a large-scale project – for example, adding a footpath along Burke Street in Chiltern to
connect to the lake would provide an alternative to the main street and create a loop. In Rutherglen
the existing Rail Trail could form a portion of a loop connecting to the town centre and the lake.
A connected network would create different options for daily walks by providing access to different
parts of towns without repeating the same route. Further consultation should be carried out with
the community, including older residents, to determine the best locations for these connections and
loops.
This recommendation aligns with the following items from the Checklist of Essential Features of Age-
Friendly Cities:
• Pavements are well-maintained, free of obstructions and reserved for pedestrians
• Pavements are non-slip, are wide enough for wheelchairs and have dropped curbs to road
level
2. Improve seating specifically designed for older people
Improving seating and ensuring seats are present at suitable intervals on key walking routes would
encourage people with limited mobility to walk further. Seating should be age-friendly with high
seats and arm rests.
This recommendation aligns with the following item from the Checklist of Essential Features of Age-
Friendly Cities:
• Green spaces and outdoor seating are sufficient in number, well-maintained and safe
3. Create locations of interest
Locations of interest make a walk more interesting and make it more likely for people to engage in
their surroundings. These could include art works, interpretative signs, interactive installations, and
exercise equipment. Noticeboards or digital interactive panels could communicate local initiatives,
provide specific information about built or natural features, or propose a challenge (for example,
photographing birds for International Biodiversity Day).
This recommendation aligns with the following item from the Checklist of Essential Features of Age-
Friendly Cities:
• Community-wide settings, activities and events attract all generations by accommodating
age-specific needs and preferences
4. Create opportunities for community connection
Opportunities should be explored to engage the community, in particular older residents, in
activities related to the environment. There is a potentially large cohort of older people who do not
identify as senior citizens, are still fit and active, and want to contribute to their town. This would
likely require some central coordination from the Shire.
Charles Sturt University
25Mapping liveability in the Indigo Shire
This recommendation partially aligns with the following items from the Checklist of Essential
Features of Age-Friendly Cities:
• Activities and events can be attended alone or with a companion
• A wide variety of activities is offered to appeal to a diverse population of older people
• There is consistent outreach to include people at risk of social isolation
How does our project fit in with current and future Indigo Shire strategies and policies for healthy
ageing?
Healthy ageing and getting people physically active are already acknowledged as a priority for Indigo
Shire in the Municipal Public Health and Wellbeing Plan (2017-2021), the Ageing Well Strategy
(2019-2023), and the Indigo Shire Council Plan (2021-2025). The Shire is committed to put in practice
the World Health Organization recommendations for Age Friendly Cities and Communities, and a
range of strategies and recommendations to improve the walking infrastructure and increase older
people participation in walking are addressed in specific council plans such as the Council’s Pathway
Asset Management Plan and the Indigo Shire Footpath Upgrade.
Recently, the Ride It, Walk It project (2021) proposed 12 key strategies to “guide Council’s
investment in paths, tracks, trails and associated infrastructure, programming and marketing”. From
those strategies, the proposed “Fill in the gaps in the existing network”, “Activate paths, tracks and
trails”, “Develop priority routes to key destinations”, “Develop new paths, tracks and trails” and
“Measure and evaluate” are aligned with our study. Our recommendations complement these
specific strategies by adding and reinforcing the needs and views of older people which were not
necessarily considered. For example, older people will benefit from the provision of connected paths
and tracks but might not be able to access natural/green areas outside town centre. The Ride It,
Walk It report highlighted the issue of “gaps in the network where riders or walkers are forced onto
roads or onto nature strips … act as a major deterrent to the use of a particular route”, and
identified High Street in Chiltern and Barkly Street in Rutherglen as candidates for footpaths. Our
walkability maps show that other streets could benefit as well from an integrated footpath strategy
to ensure walking connectivity with the town centre and close-by natural/green areas, but also to
create different alternatives for daily walking routes. The use of signage to encourage physical
activity was also noted in the report. We proposed this signage to take different formats (from static
billboards to interactive digital panels) to create a “discovery” factor when going for a daily walk.
In the strategic actions planned, the Indigo Shire Footpath Upgrade plan and the associated
Footpath Priority Listing tool play an important role to evaluate future works to rehabilitate existing
footpaths and creating new ones to consider “accessibility and ageing needs”, “improve the amenity
of parks and facilities to accommodate seniors” and “consider activation initiatives within these
open spaces”. The idea of improving accessibility and connecting “towns and natural resources” with
walking tracks is also part of the strategy. The Shire recognizes connectivity as an “ongoing
challenge”, but this connectivity refers to connections between towns only. Our project suggests
that this should include local connectivity to foster engagement with place and nature. Also, it
should acknowledge walking as means of transport.
Any plans for the expansion and improvement of footpaths should consider the need for connected
walking loops in the urban areas around town centre, connecting commercial/social areas with
natural/open spaces. These should be designed at the local level, using geospatial data analysis, and
integrating wider participation of the community (particularly older people). Our project provides a
baseline for a larger study and aligns with the recommendations being made in terms of monitoring
Charles Sturt University
26You can also read


