MARCH 2021 NEW MEXICO APARTMENT SURVEY - JULY 2021 Prepared for the New Mexico Mortgage Finance Authority
←
→
Page content transcription
If your browser does not render page correctly, please read the page content below
MARCH 2021 NEW MEXICO
   APARTMENT SURVEY
Prepared for the New Mexico Mortgage Finance Authority

          Suzan Reagan, Senior Program Manager
                    UNM Data Bank

                      JULY 2021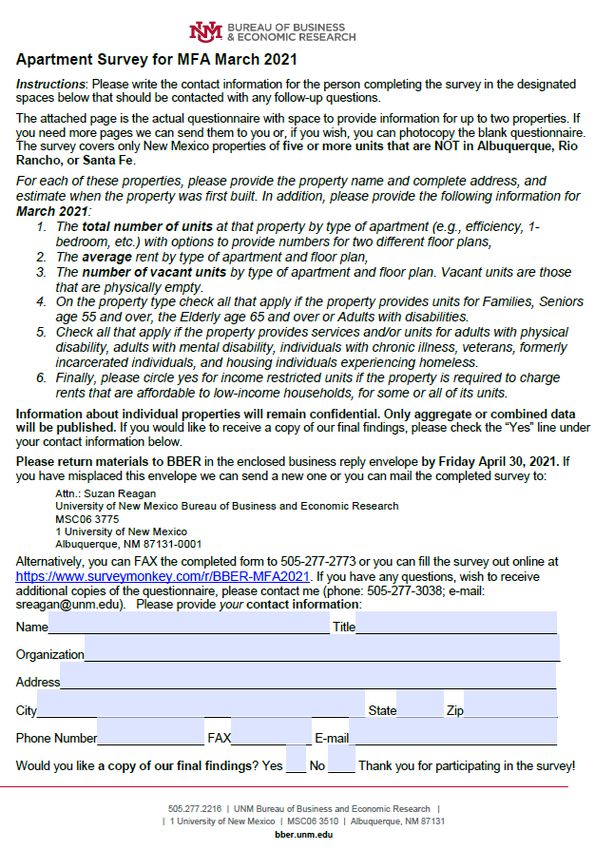
MARCH 2021 NEW MEXICO
                                                                               APARTMENT SURVEY | 2

Acknowledgements
This report could not have been completed without the cooperation of the property managers and
owners who participated in our survey. Their time and attention is especially appreciated during this
year’s continued disruptions from COVID-19. As a group, we find that apartment property owners and
managers are very engaged in their local community, which is vital to the continued growth of New
Mexico. We hope that this report provides quantitative insight to their community and businesses.

We would like to express our appreciation to the New Mexico Mortgage Finance Authority (MFA) for
providing the financial support and direction necessary to complete the surveying effort. Additionally,
MFA staff provided data from properties that they, themselves, oversee. Special thanks to Rebecca
Velarde, Sonja Unrau, and Amanda Mottershead-Aragon at MFA for all their guidance and support
throughout this endeavor. Thank you to the MFA team who compiled the data!

At UNM BBER, Suzan Reagan was the project manager on this report and was assisted by Viktoria
Gonsior, Sofia Ximenez-Byrne, and RaeAnn McKernan. BBER’s Acting Director, Michael O’Donnell,
provided oversight and support.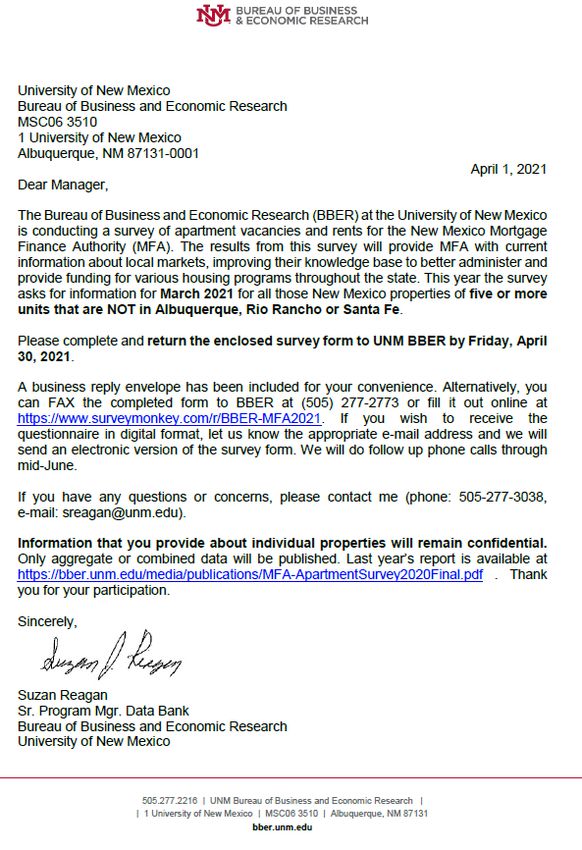
MARCH 2021 NEW MEXICO
                                                                                            APARTMENT SURVEY | 3

TABLE OF CONTENTS

Acknowledgements                                                                                             2

Introduction                                                                                                 5

Summary                                                                                                      5

Findings                                                                                                     6

 Properties and Units                                                                                        6

 Vacancies                                                                                                   7

 Rent                                                                                                       10

 Apartment Types and Services                                                                               14

 Comparison of Affordable to Market-Only                                                                    15

 Comparisons with Prior Surveys                                                                             16

 Vacancies Trends                                                                                           16

 Rent Trends                                                                                                17

Methodology                                                                                                18

 Design                                                                                                     18

 Response                                                                                                   20

Tables                                                                                                     22

 Table 1. Counts of Apartment Properties, Year Property Built and Count of Units by Type                   T-1

 Table 2. Counts of Apartment Properties, Units, Vacant Units, and Average Vacancy Rates by Type           T-2

 Table 3. Counts of Apartment Properties, Year Built, Units by Type, and Weighted Average Rents by Type    T-3

 Table 4. Affordable Compared to Market Only Properties                                                    T-4

Appendix                                                                                                   27

 Postcard: Pre-Survey Notice                                                                               A-1

 Survey Letter                                                                                             A-2

 Survey Instructions                                                                                       A-3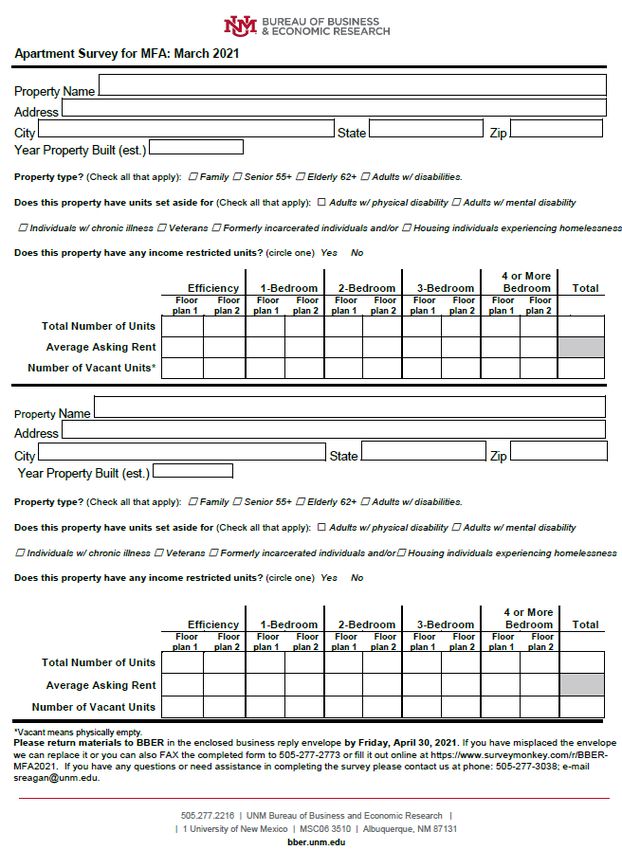
MARCH 2021 NEW MEXICO
                                                                         APARTMENT SURVEY | 4

  Survey                                                                                A-4

  Postcard: Post-Survey Notice                                                          A-5

  Survey Monkey Tool                                                                    A-6

  Preliminary Apartment Vacancy Rate By County: March 2021                             A-11

  Revised Apartment Vacancy Rates By County: March 2021                                A-12

  Communities with Respondents                                                           13

LIST OF FIGURES
Figure 1. Count of Properties* by Size of Property                                              6

Figure 2. Total Units* by Type of Apartment                                                     7

Figure 3. No. of Properties* by Overall Weighted Average Vacancy Rate                           8

Figure 4. Weighted Average Vacancy Rate By Type                                                 9

Figure 5. Overall1 Weighted Average Vacancy Rates*                                            10

Figure 6. Count of Properties* by Overall1 Weighted Average Rent                              11

Figure 7. Weighted Average Monthly Rents* by Type of Apartment                                12

Figure 8. Overall1 Weighted Average Monthly Rents*                                            13

Figure 9. Apartment Property Types                                                            14

Figure 10. Services Provided                                                                  15

Figure 11. Apartment Survey Trends                                                            18
MARCH 2021 NEW MEXICO
APARTMENT SURVEY | 5
Introduction
The New Mexico Mortgage Finance Authority (MFA) worked with The University of New Mexico’s
Bureau of Business and Economic Research (UNM BBER) to conduct a survey of apartment properties
in communities across the state, excluding Santa Fe and Albuquerque areas. The survey was
undertaken at the end of March 2021 with non-response follow-up extending into June. The survey
was mailed on March 30 with a delivery date of April 1. Survey responses were back to normal this year
as COVID-19 protocols were still the norm but vaccinations were being distributed. In total, 302 usable
surveys were collected in 2021—up from the 258 in 2020. Despite multiple attempts to reach
properties in Catron, De Baca, Harding, and Mora counties, UNM BBER was unable to secure any
survey responses from those geographies.
Apartment complexes with five or more units were requested to provide information on unit count,
vacancy and rent data for March 2021, the year the structure was built, and the availability of special
needs services. For the last four years, MFA has collected data from administrative records for
properties they oversee while UNM BBER surveyed all other properties. The goal is to provide MFA
with current market information on apartments to increase the organization’s understanding of local
conditions. These data are referred to when researching topics related to affordable housing. This
analysis is part of a continuing effort with the first survey being conducted in 2009.
Summary
COVID-19 put a high demand on housing units in general and specifically increased demand on
apartments. The demand resulted in an overall low vacancy rate (3.2%), the lowest recorded since the
survey has been conducted. The cost of rent 1 also reached a record-high average of $648.00.
• Total responses covered 302 properties scattered across 27 New Mexico counties 2,
representing 65 communities, and accounting for 14,695 units.
• Survey respondents reported a total of 466 vacant units, resulting in an overall vacancy rate
of 3.2 percent.
• One hundred eighty-seven (187) properties (62% of the total) reported overall vacancy
rates that were equal to or less than the study-area average of 3.2 percent. One hundred
twenty-five properties, or 41.4 percent of the total, reported “no vacancies”.
• The weighted average monthly rent for 2021, regardless of apartment type, was $648 for
the study area. This was a $19 increase from 2020’s amount of $629.
1
Weighted for this report.
2
For a list of communities, see Appendix A-13.MARCH 2021 NEW MEXICO
APARTMENT SURVEY | 6
• Seventy-three (73) percent of the properties responding (220 out of 302) had between 20
and 99 units, covering a total of 10,728 units.
• The most common apartment type is a two-bedroom unit with 41 percent or 6,070 units of
the total 14,695 units accounted for in this survey.
• One hundred twenty-six (126) properties identified that they provide services for adults
with physical disabilities.
Findings
Properties and Units
Survey responses were received from 302 properties in 27 New Mexico counties 3, representing 65
communities and accounting for a total of 14,695 units. Only 19.5 percent of properties (59 out of 302)
had between 5 and 19 units, accounting for a total of 596 units. Seventy-three (73) percent of the
properties (220 out of 302) had between 20 and 99 units, covering a total of 10,728. Roughly one-third
of that group (114 properties) had 20 to 49 units, for a total unit count of 3,784. Thirty-five (35) percent
of all properties (106 out of 302) housed between 50 and 99 units. Twenty-three properties (7.6% of
the total) had 100 or more units, for a total unit count of 3,371. See Figure 1 below.
FIGURE 1. COUNT OF PROPERTIES* BY SIZE OF PROPERTY
100 or More Units, 23
Properties, 8%
5-19 Units, 59 Properties,
19%
50-99 Units, 106
Properties, 35%
20-49 Units,
114Properties, 38%
* Based on 302 Properties
3
For a list of communities, see Appendix A-13.MARCH 2021 NEW MEXICO
APARTMENT SURVEY | 7
The most common apartment type was a two-bedroom unit, with about 41 percent or 6,070 units.
One-bedroom apartments were the second most reported, at about 32 percent. Remaining units were
distributed among three-bedroom (22.0%), four-or-more bedroom (1.6%), and efficiency (2.8%)
apartments. See figure 2 below.
FIGURE 2. TOTAL UNITS* BY TYPE OF APARTMENT
Efficiency, 409 Units,
4+BR, 235 Units, 2%
3%
3-BR, 3,232 Units, 22%
1-BR, 4,749 Units, 32%
2-BR, 6,070 Units, 41%
* Based on 302 Properties
The survey allowed respondents to differentiate by apartment units between floor plan 1 and floor
plan 2. Twenty-five properties (2,172 units) provided that information. In general, the second floor
plan showed a price difference from $40 to $366. All tabulations, unless otherwise noted, are
completed without regard to differences in floor plans.
Vacancies
Respondents to the survey reported a total of 466 vacant units, resulting in an overall vacancy rate of
3.2 percent. Vacancy rates are weighted and are shown by geographic area and type of apartment in
Table 2 on page T-2. Rate calculations are determined by dividing the total number of vacant units in
an area and for an apartment category by the total number of units for that area and category.
One hundred eighty-seven properties (62% of the total) reported overall vacancy rates that were
equal to or less than the study-area average of 3.2 percent. One hundred twenty-five properties, or
41.4 percent of the total, reported no vacancies. An additional 94 properties reported vacancy rates
between 0.1 to 5.0 percent. Fifty-six properties (18.5% of the total) reported vacancy rates in the rangeMARCH 2021 NEW MEXICO
APARTMENT SURVEY | 8
of five to 10 percent. Twenty-seven properties (8.9% of the total) reported rates above 10 percent (see
figure 3 below). In this survey 73 percent of properties were below five percent vacant.
FIGURE 3. NO. OF PROPERTIES* BY OVERALL WEIGHTED AVERAGE VACANCY RATE
15.0% or More , 10
10.1% to 15.0%, 17 properties, 3%
properties, 6%
5.1% to 10.0%, 56
properties, 19%
0.0% vacancy, 125
properties, 41%
0.1 % to 5 %, 94
properties, 31% *Based on 302 Properties
Figure 4 No of properties by Overall Weighted Average Vacancy Rate
Vacancy rates were highest for efficiencies, at 4.6 percent. Two-bedroom and four-bedroom units
followed at 3.6 and 3.0 percent, respectively. One-bedroom and three-bedroom units were least likely
to be vacant, with rates of 2.9 and 2.6 percent, respectively. Figure 4 (at the top of page 9) details the
distribution of vacancy rates by type of apartment. Table 2 (see page T-2) further demonstrates the
distribution of vacant units and weighted average vacancy rates by type of apartment and geographic
area.MARCH 2021 NEW MEXICO
APARTMENT SURVEY | 9
FIGURE 4. WEIGHTED AVERAGE VACANCY RATES* BY TYPE OF APARTMENT
5.0%
4.6%
4.5%
4.0%
3.6%
3.5% 3.2%
2.9% 3.0%
Vacancy Rate
3.0%
2.6%
2.5%
2.0%
1.5%
1.0%
0.5%
0.0%
Effic. 1-BR 2-BR 3-BR 4+BR Overall
Apartment Type
* Based on 302 Properties
Among the 23 individual counties, overall weighted average vacancy rates were below the study-area
rate (3.2) in 11 counties: San Juan (3.0), Lincoln (2.9), Roosevelt (2.8), Guadalupe (2.6), Los Alamos
(2.6), Sandoval (2.1), Chaves (2.1), Taos (2.0), Valencia (1.8), Otero (1.6) and Dona Ana (1.5). The
remaining 12 counties and the combined counties of Colfax, Hidalgo, Torrance, and Union were above
the study-area rate. See figure 5 at the top of the next page.
Each county has specific economic conditions that impact apartment properties. Quay and Curry are
impacted by Cannon Air Force Base employment. Eddy and Lea County are continuing to experience
employment changes in the mining and extraction industry. Los Alamos trends are closely related to
employment trends at the area’s largest employer, Los Alamos National Laboratory. Both Doña Ana
and Socorro are very much impacted by university activity. Doña Ana has seen a slow down due to
worldwide economic conditions limiting border-related manufacturing, warehousing and trade
opportunities during the pandemic. Yet relaxed trade restrictions should provide opportunities for
upcoming growth. Valencia County is seeing strong economic growth with the expansion of Facebook
and other employers. Finally, very rural counties have been experiencing population decline and little
economic growth which is evident with higher vacancy rates (see Table 2 on page T-2 and Figure 5 at
the top of page 10).MARCH 2021 NEW MEXICO
APARTMENT SURVEY | 10
FIGURE 5. OVERALL1 WEIGHTED AVERAGE VACANCY RATES*
1 All types of apartments combined.
2 Combined Counties Colfax, Hidalgo, Torrance and Union
3 Sandoval does not include Rio Rancho
Quay 6.8
Curry 6.3
Eddy 5.4
Luna 5.0
Lea 4.9
Combined Counties3 4.8
Socorro 4.6
Sierra 4.5
Rio Arriba 4.3
Cibola 3.9
San Miguel 3.8
McKinley 3.8
Grant 3.6
New Mexico Study Area 3.2
San Juan 3.0
Lincoln 2.9
Roosevelt 2.8
Guadalupe 2.6
Los Alamos 2.6
Sandoval 2.1
Chaves 2.1
Taos 2.0
Valencia 1.8
Otero 1.6
Dona Ana 1.5
- 1.0 2.0 3.0 4.0 5.0 6.0 7.0 8.0
Figure 6 Overall Weighted Average Vacancy Rates
Rent
Rental data were only tabulated for a subset of the survey respondents. Some properties did not
provide rental data while other properties were identified as receiving lump-sum subsidies that could
not be allocated to individual units. Therefore, the rental tabulations were based on 281 properties, for
a total of 13,645 units.
The weighted average monthly rent, regardless of apartment type, was $648. Weighted rents are
estimated at the property level by dividing total rental revenue by the total number of units at the
property. An average is then calculated for all the properties in that county.
Around 53 percent of the properties (148) had overall weighted average rents that were equal to or
less than the study-area average of $648. Most of the properties (183) had overall average rentsMARCH 2021 NEW MEXICO
APARTMENT SURVEY | 11
between $500 and $799. Seventy-seven properties averaged rents in the $500-$599 range. Both
ranges $600 to $699 and $700 to $799 had 53 properties each. Fourteen percent of properties were in
the $800 to $999 range. This year there were 15 properties (5%) with $1,000 or more in rent. There
were 46 properties that reported rents less than $500. See Figure 6 below.
FIGURE 6. COUNT OF PROPERTIES* BY OVERALL1 WEIGHTED AVERAGE RENT
$1,000 or More, (15
$900 to $999,( 10 properties), 5%
Less than $500, (46
properties), 4% properties), 16%
$800 to $899, (27
properties), 10%
$700 to $799, (53
properties), 19%
$500 to $599, (77
properties), 27%
$600 to $699, (53
properties), 19%
Note: The overall weighted average rent for the NM Study Area was $648.
* Rent calculations based on 281 properties.
Figure 7 on page 12 records study-area weighted average rents by apartment type. These are as
follows: efficiencies, $592; one-bedroom, $587; two-bedrooms, $670; three-bedrooms, $774; and four-
or-more-bedrooms, $841. The high rent amount for efficiencies appears to be related to higer
numbers of efficiencies in counties such as Los Alamos with overall higher rent rates.
Rents exceeded study-area averages ($648) in the following 10 individual counties: Los Alamos ($960),
Lea ($792), Eddy ($760), San Juan ($711), Valencia ($695), Doña Ana ($691), McKinley ($663), Sierra
($654), Lincoln ($653), and Guadalupe ($651). Average rents were below the study-area average in 11
counties: Chaves ($663), Quay ($627), Socorro ($627), Luna ($596), Roosevelt ($582), San Miguel
County weighted average rents ranged from $522 to $960 with a median of $648.MARCH 2021 NEW MEXICO
APARTMENT SURVEY | 12
FIGURE 7. WEIGHTED AVERAGE MONTHLY RENTS* BY TYPE OF APARTMENT
$900
$841
$800 $774
$700 $670
$648
$592 $587
$600
$500
$400
$300
$200
$100
$-
Effic. 1-BR 2-BR 3-BR 4+BR Overall
* Rent calculations based on 281 properties.
($562), Otero ($559), Sandoval ($558), Grant ($553), Curry ($553) and Taos ($526). Combined, the
counties of Cibola,Colfax, Hidalgo, Rio Arriba, Torrance, and Union ($552) reported rents below the
study-area average. Table 3 on page T-3 and Figure 8 on page 13 illustrates these findings.
Note that reported rents differ from advertised rents. This may indicate, among other cost
considerations, that actual collected rents are lower than advertised prices. In context, older leases
still in effect may be lower than newer leases. Table 3 on page T-3 shows the distribution of weighted
average rents by type of apartment and geographic area. Overall, county weighted average rents
ranged from $522 to $960.MARCH 2021 NEW MEXICO
APARTMENT SURVEY | 13
FIGURE 8. OVERALL1 WEIGHTED AVERAGE MONTHLY RENTS*
Los Alamos $960
Lea 792
Eddy 760
San Juan 711
Valencia 695
Dona Ana 691
McKinley 663
Sierra 654
Lincoln 653
Guadalupe 651
New Mexico Study Area 648
Chaves $633
Quay 627
Socorro 627
Luna 596
Roosevelt 582
San Miguel 562
Otero 559
Sandoval2 558
Grant 553
Curry 553
Taos 526
Combined Counties3 522
$0 $200 $400 $600 $800 $1,000 $1,200
*Rents calculated on 281 properties.
1 All types of apartments combined.
2 Sandoval part does not inlcude Rio Rancho
3 Combined CountiesMARCH 2021 NEW MEXICO
APARTMENT SURVEY | 14
Apartment Types and Services
To better understand the availability of apartment type for specific market populations, respondents
were asked to idenify whether a property was intended for Families, Seniors age 55+, Elderly age 65+,
or Adults with Disabilities. Of the responding, only 246 completed this question. The responses were
as follows: 76 percent were Family (188), 14 percent where Seniors age 55+ (35) , 23 percent were
Elderly age 65+ (57), and 11 percent were Adults with Disabilities (27) (see Figure 9 below). Some
properties checked multiple boxes, however. For instance, of the twenty-seven properties indicating
Adults with Disabilites, only three did not check one of the other boxes available. For records
indicating Family apartments, 20 checked additonal boxes.
FIGURE 9. APARTMENT PROPERTY TYPES
200 Family, 188
180
160
140
120
100
80
Elderly age 65 and over,
57
60
Seniors age 55 and over,
35 Adults with disabilities,
40
27
20
0
Family Seniors age 55 and over Elderly age 64 and over Adults with disabilities
Note: 246 of 302 properties resonded to this question.
The question on special-needs services asked, “Does this property have units set aside for (Check all
that apply): Adults w/ physical disability; Adults w/ mental disability; Individuals w/ chronic illness;
Veterans; Formerly incarcerated individuals and/or Housing individuals experiencing homelessness.”
Of the 232 properties responding to the question, 215 check at least one box while 31 selected more
than one and 10 selected all five options. Services for adults with physical disability was the most
commonly reported at 126 properties. Second-most common was services for adults with mental
disability (32). Services for veterans and individuals with chronic illness were chosen four times each.
Housing individuals experiencing homeless where selected by 9 respondents. One property reported itMARCH 2021 NEW MEXICO
APARTMENT SURVEY | 15
provided services for formerly incarcerated individuals. See figure 10 below and Table 4 on page T-4
for the special needs services by county.
FIGURE 10. SERVICES PROVIDED
140
126
Note: 232 out of 302 properties responding to this question.
120
100
80
60
40 32
20
9
4 4 1
0
Adults with physical Adults with mental Individuals with Veterans Formerly Housing individuals
disability disability chronic illness incarcerated experiencing
individuals homeless
Figure 11 Services Provided
Comparison of Affordable to Market-Only
The survey asked if the property has affordable units. All MFA-managed properties were assumed to
be affordable. Affordable properties have upper limits on rent as public housing has upper limits on
income. It is important to note, however, that some affordable properties also contain units which are
not characterized as affordable. Many properties can be a mix of affordable and market rents. The
survey recorded 76 properties (3,677 units) without an affordable option—these types of
properties/units are considered market-only. Market-only were 25.2 percent of the total properties in
the survey. Most market-only properties reporting in the New Mexico study-area were located in Doña
Ana County followed by Curry and Los Alamos counties. Note on Los Alamos County, one property
that participated last year converted to a homeowner association condo, being one more indication
that the demand in this county is very high for housing.
Statewide affordable properties account for 74.8 percent of total properties. In all, 359 vacancies were
documented, resulting in a vacancy rate of 3.3 percent for affordable properties. That rate is slightly
above that of the study-area (3.2%). In contrast, market-only properties had 107 vacancies,
contributing to a rate of 2.9 percent. Average rents for affordable properties were smaller than overall
rents ($634 versus $648). Average rents for market-only properties were $706 (See Table 5 on page T-
5).MARCH 2021 NEW MEXICO
APARTMENT SURVEY | 16
Comparisons with Prior Surveys
Comparing this year’s data with prior years’ can only be done to a limited extent. In 2020, COVID-19
restrictions required individuals to quarantine and compelled business to close just as survey materials
were being distributed at the end of March. This year when the survey went out, much of New Mexico
continued to be under quarantine. In 2020 only 258 completed surveys were received. In 2021 there
were 302 responses. In 2019, prior to COVID-19 impacts, 312 surveys were returned. The year with the
lowest response was 2009 (243) and the highest response was in 2012 (325).
The 2021 survey effort was to be administered at the end of March, as were the prior three surveys.
From 2016 to 2018, surveys were administered in mid-April. All other prior surveys were completed in
mid-May. Additionally, each of these surveys have differences between the mix of properties, the
total number of respondents, and geographic areas covered. Survey question have also been adjusted,
compared to those from 2018 (see Methodology section for the details). It is interesting to examine a
few broad changes in trends as this survey now covers more than a decade of data collection with
consistent responses from properties in some counties.
Vacancies Trends
The overall weighted average vacancy rate for the 2021 study-area was 3.2 percent, down from 3.9
percent in 2020. Direct comparisons are possible for the 23 individual counties. The vacancy rate
declined by two percent or more in six counties (Chaves, 2.3; Otero, 2.3; Quay, 2.4; Rio Arriba, 2.7; San
Juan, 2.1; and Sierra, 6.8). Sierra County saw the largest decline, from 11.4% in 2020 to 4.5% in 2021.
Conversely, vacancy rates rose by two percent or more in Roosevelt (2.8) and Lea (2.5) counties.
Roosevelt saw the largest increase from a zero vacancy rate in 2020 to 2.8% in 2021. In addition, six
counties had lower increases in the vacancy rate (Curry, 1.3; Eddy, 0.8; Luna, 1.4; McKinley, 0.9; San
Miguel, 1.9; and Valencia, 0.4). The remaining counties (Cibola, 1.8; Doña Ana, 1.9; Grant, 1.6;
Guadalupe, 1.9; Lincoln, 0.5; Los Alamos, 1.0; Sandoval, 1.8; Socorro, 0.5; and Taos, 1.8) had less than
a two percent decrease in vacancy rates from 2020 to 2021.
Specific seasonal shifts or current local market conditions must be taken into consideration before
drawing conclusions. Institutions of higher education have a significant impact on the rental market,
especially in Doña Ana and Socorro, where vacancy rates where potentially impacted by the continued
COVID-19 in-person class restrictions. Lea County and surrounding areas continue to be impacted by
the volatile changes in the oil & gas industry which saw a precipitous decline in oil prices in March of
last year but is now experiencing very high increases. Sierra County, which saw the largest decline,
may be seeing increased activity in tourism at Elephant Butte and businesses associated with
Spaceport America.MARCH 2021 NEW MEXICO
APARTMENT SURVEY | 17
Rent Trends
The overall weighted average rent in 2021 was up $19, from $629 in 2020 to $648 in 2021. Weighted
average rents increased by $27 for 2019 to 2020.The largest yearly increase in surveyed rents occurred
between 2014 and 2015 when rents increased $38 dollars ($576 to $614). Average rents then declined
by $29 dollars in 2016. In 2021, average rents increased in 17 counties (Chaves, Cibola, Doña Ana,
Eddy, Lea, Los Alamos, Luna, McKinley, Otero, Quay, Rio Arriba, Roosevelt, San Juan, San Miguel,
Socorro, and Valencia). From 2020 to 2021, three counties had more than a $100 dollar increase in
average rents (Cibola, Los Alamos, and Rio Arriba). In Cibola, the increase is most likely due to the mix
of properties responding while Los Alamos and Rio Arriba may be seeing increase demand due to Los
Alamos National Labs activities. Average rents declined in five counties (Curry, Grant, Guadalupe,
Lincoln, Sierra, and Taos). The greatest decrease was in Grant County, which saw a drop of $98 from
$651 in 2020 to $553 in 2021. In this case for Grant County, declines are likely related to the mix of
properties responding to the survey and not to any market change.
It is also possible to compare individual properties that responded to the survey in both 2020 and
2021. For the study area, this subset came to 233 properties accounting for approximately 11,470
units. In this subset, the 2021 average vacancy rate was 3.5 percent, which is less than the 2020 rate of
4.8 percent for this same subset of properties. The average rent for this subset was $653 for 2021, an
increase of $21 dollars over the $632 for 2020.
Finally, overall comparisons between survey responses from 2009 through 2020 are considered. The
overall average vacancy rate for the New Mexico study-area was 5.9 percent in 2009. That declined to
a low of 3.8 percent in 2011, and then increased to a high of 6.3 percent in 2014. Vacancy rates then
slowly declined to 3.9 in 2019. In 2020 we saw a slight increase to 4.2 which then declined to 3.2 this
year. Therefore, the 2021 average vacancy rate of 3.2 was the lowest vacancy rate observed over the
last 12 years.
The overall weighted average rent increased from $537 in 2009 to a high of $614 in 2015. In 2016 the
overall weighted average rent declined by $29, to $585. Another small decline is noted in 2017, to
$580. Weighted average rents rose marginally to $602 in 2018 and remained steady in 2019. In 2020,
that amount increased by $27, to $629. Then in 2021, rents increased again by $19 to a high of $648
(see figure 11 at the top of page 18). Therefore, the 2021 weighted average rent amount is the highest
amount over the past 12 years.MARCH 2021 NEW MEXICO
APARTMENT SURVEY | 18
FIGURE 12. APARTMENT SURVEY TRENDS
7 $700
6 $600
5 $500
4 $400
Rent
Rate
3 $300
2 $200
1 $100
0 $0
2009 2010 2011 2012 2013 2014 2015 2016 2017 2018 2019 2020 2021
Weighted Average Vacancy Rate Weighted Average Rent
Note: Data collected since 2019 are for March and from 2016 - 2018 are for Mid-April
Methodology
The survey focused on areas in New Mexico that are outside of Albuquerque, Rio Rancho and Santa
Fe. The Albuquerque-area and Santa Fe markets are covered extensively in apartment surveys by CB
Richard Ellis (CBRE) (the latest for Jan. 2020) and the Apartment Association of New Mexico. All
references to Sandoval County include only the portions outside of Rio Rancho. Doña Ana was the
largest single county covered by the UNM BBER survey, with a Census Bureau estimated population of
218,195 as of July 1, 2019 4.
Design
The history of the first questionnaire design begins in 2009, when UNM BBER solicited input from
several individuals familiar with apartment markets. Requested information and definitions on the
UNM BBER form are comparable in many ways to other apartment surveys. In 2016, the questionnaire
4
Source is US Census Population Division Table 1. Annual Estimates of the Resident Population: April 1, 2010 to July 1,
2019 (PEPANNRES)MARCH 2021 NEW MEXICO
APARTMENT SURVEY | 19
was modified to include a request for “Total Rentable Units” with the note “Rentable means available
to be or is rented.” While this question attempted to identify units, which part of the total units were
not able to rent, the information was not as helpful and the question was dropped in 2020. In 2017, to
address the interest on the availability of housing that includes special needs services, a “yes” or “no”
question was added. In 2018, a question was added to identify the number of affordable units offered.
In 2019 the question was changed to “Check all that apply if the property provides services and/or
units for adults with physical disability, adults with mental disability, individuals with chronic illness,
veterans, formerly incarcerated individuals, and housing individuals experiencing homeless.” New to
the 2019 survey was an instruction to “check all that apply if the property provides units for Families,
Seniors age 55+ , Elderly age 65+ and over, or Adults with Disabilities.” All other parts of the survey
have remained the same since the onset of this annual project.
The survey tool is designed to be brief to ensure the highest possible response rate. Respondents were
asked to provide only key data items for each property. These included the total number of units, the
number of vacant (physically empty) units, and the average asking rents—all according to five types of
apartments. These types of apartments are efficiencies, one-bedroom, two-bedroom, three-
bedroom, and four-or-more-bedroom. The survey allows for distinguishing between floor plans: floor
plan 1 and floor plan 2 (e.g., one or two baths) or amenities. Tabulations for total units and vacancy
includes all data received. Rent tabulations where income-limited properties receiving lump-sum
subsidies that could not be allocated to individual units were not included in rent tabulations.
Furthermore, some properties did not supply rent data. The low rate-of-response to questions asking
for the year a property was built continued into 2021. Even so, if this item had been provided in a prior
survey, the earlier information was used. See the Appendix (starting on page 27) for the complete set
of materials in the survey tool.
Space was provided for updated contact information and for the complete property address which
assists in managing the survey. Lastly, the questionnaire contained an assurance that only aggregated
data would be published and that information about individual properties would remain confidential.
Several steps were taken to apply both primary and complementary disclosure-avoidance criteria to
the results.
The survey process included creating an apartment property contact list from a variety of sources. The
primary source was the lists of respondents from the previous March survey. This list was
supplemented with local searches online using Google Maps; and internal databases from MFA. From
2019 to 2021, the apartment survey was divided into two sections: properties overseen by MFA and
market properties. There are many properties not managed by MFA which are also affordable. MFA
provided data for its portion of the list and UNM BBER surveyed the remaining properties. An attempt
was made to only survey properties once, however, some duplication of effort occurred specifically
where management companies worked with both MFA administered properties and other properties.MARCH 2021 NEW MEXICO
APARTMENT SURVEY | 20
The UNM BBER portion of the survey was primarily conducted as a standard U.S. Postal Service
mailing, though alternative versions of the questionnaire and notification/reminder cards were also
used. The electronic alternative materials were primarily used for larger management companies or as
requested by respondents. For several year now, an option to fill out the questions has been available
on SurveyMonkey.com.
Pre-survey notifications and post-survey reminder cards were sent to the contacts on the mailing list.
The questionnaire and an accompanying cover letter and instructions were also mailed. The mail-out
questionnaire and related materials are viewable in the appendix of this report.
The pre-survey notification material was sent at the beginning of the fourth week of March, followed
by the questionnaire on April 1st. Information was requested for March and a deadline was set for
April 30. Reminder cards were mailed at the end of April to properties who had not already responded.
Non-response follow-up e-mails were sent in May. Non-response follow-up via phone calls were
started in mid May and continued into June. The last few responses were received in July.
All properties that had not submitted responses for the year were phoned at least once during non-
response follow up. Non-respondents with alternative means of contact, (e.g., emails, phone
numbers, mailing addresses) were also contacted through those media. Once connected, if the non-
respondents expressed an interest in completing the questionnaire, UNM BBER continued the follow-
up process.
Response
Questionnaires (postal mail and e-mail) were sent to all known contacts for properties in the study-
area. These contacts included both on-site managers and management companies, as appropriate. In
several cases, unknown to UNM BBER, multiple contacts covered the same property. Over the course
of the data collection process, it was also discovered that the survey was not appropriate for
completion by some contacts. For example, the contact may only lease commercial properties that do
not include apartments or the contact may only lease apartment properties that have less than five
units. Efforts will be made to exclude inappropriate contacts from future surveys. Apartments are
continually changing ownership and/or property managers and UNM BBER continually seeks to build
new relationships with these new owners and/or property managers.
The 302 responding properties from 2021 were much higher than the 258 responses seen last year
during the COVID-19 impact and more inline with the 312 seen in 2019. In all, there were a total of 679
properties with 355 contacts on the master list. One hundred eighteen apartments had no associated
contact information. In those instances, surveys were addressed to the “Apartment Manager.” MFA
provided data on 151 properties. Some MFA properties were excluded for not meeting certain
limitations. UNM BBER received some surveys which overlapped with MFA. The mailing list was fairlyMARCH 2021 NEW MEXICO
APARTMENT SURVEY | 21
accurate with less than ten postal mailings being returned as undeliverable. Mailing address changes
were needed for 11 properties after the first mailing and 63 properties had change in contact
information. There were nineteen requests to be excluded from participating in the survey and two
properties were permanently closed.
UNM BBER data was collected via phone interview, the initial mailings (postal and e-mail), and
through 276 follow-up activities. This year 26 properties responded via SurveyMonkey.com.
To maintain confidentiality for individual properties, the data were aggregated and reported by
county. Each county may contain more than one community. To ensure that confidential information
was not disclosed, Colfax, Hidalgo, Torrance, and Union were combined into one group. Four counties
had no responses: Catron, De Baca, Harding and Mora County, although properties were surveyed in
these counties. Colfax, which had no surveys returned last year, did have some returned this year,
showing that the mix of properties responding does change year to year.
Criteria for non-disclosure included that at least three properties needed to report in a county with no
property having more than 50 percent of units. Table 1 on page T-1 shows the distribution of
properties by geographic area, along with the distribution of total units by type of apartment and the
upper and lower bounds of the years the properties were built. Some individual county cells for certain
types of apartments (e.g., vacancy rates for efficiencies) were also suppressed, if there were too few
respondents to maintain confidentiality.MARCH 2021 NEW MEXICO
APARTMENT SURVEY | 22
Tables
Counts of Apartment Properties, Year Property Built and Count of Units by Type T-1
Counts of Apartment Properties, Count of Units by Type, Count of Vacant Units by Type and Average Vacancy
Rates by Type T-2
Counts of Apartment Properties, Year Property Built, Count of Units by Type and Weighted Average Rents by
Type T-3
Affordable Compared to Market Only Properties T-4
Source for all Tables: University of New Mexico Bureau of Business and Economic Research (UNM
BBER), March 2021 Apartment Survey conducted for the New Mexico Mortgage Finance Authority.THE ECONOMIC OPPORTUNITIES AND CHALLENGES OF URANIUM MINE CLEANUP IN NEW
MEXICO |T-1
Table 1. Counts of Apartment Properties, Year Property Built and Count of Units by Type
New Mexico Counties and County Cluster: Mach 2021
Count of Year Property Built2 County of Units by Type*
1
Area Properties Earliest Latest Total Effic. 1BR 2BR 3BR 4+BR
Chaves 15 1972 2008 877 72 416 221 154 14
Cibola 4 1968 2018 259 - 87 140 32 -
Curry 30 1963 2014 814 17 253 328 190 26
Dona Ana 59 1960 2014 3,891 81 1,058 1,668 990 94
Eddy 14 1935 2018 671 - 323 243 105 -
Grant 9 1970 2000 391 - 163 157 71 -
Guadalupe 5 1969 1997 153 - 51 57 45 -
Lea 17 1960 2018 991 D 325 444 202 D
Lincoln 6 1984 2005 278 - 128 123 27 -
Los Alamos 11 1948 2002 536 72 134 311 19 -
Luna 14 1940 2005 599 54 188 205 116 36
McKinley 24 1970 2016 1,194 51 223 587 308 25
Otero 9 1984 2007 310 D 106 106 76 D
Quay 6 1969 2011 147 - 62 69 16 -
Rio Arriba 5 1978 2003 276 - 100 69 102 5
Roosevelt 10 1963 2012 249 16 154 64 13 2
San Juan 18 1970 2011 1,055 D 172 395 477 D
San Miguel 9 1976 2002 368 - 139 160 69 -
Sandoval 6 1971 2017 376 D 117 158 82 D
Sierra 4 1974 1988 155 - 126 21 8 -
Socorro 5 1973 1986 259 - 169 86 4 -
Taos 7 1996 2013 299 - 77 171 51 -
Valencia 10 1978 2010 382 - 114 215 53 -
Colfax/Hidalgo/Torrance/Union3 5 1974 1998 165 2 64 72 22 5
New Mexico Study Area 302 1935 2018 14,695 409 4,749 6,070 3,232 235
1. These figures do not represent a comprehensive coverage of all areas in each county. 2. A significant number of properties did not report the year the complex was built.
3. Counties combined to maintain confidentiality for areas that did not meet the thresholds for data disclosure. 4. Sandoval counts do not include Rio Rancho.
Note: This tabulation includes all respondents to the survey.THE ECONOMIC OPPORTUNITIES AND CHALLENGES OF URANIUM MINE CLEANUP IN NEW
MEXICO |T-2
Table 2. Counts of Apartment Properties, Units, Vacant Units, and Average Vacancy Rates by Type
New Mexico Counties and County Cluster: March 2021
Total Count of Units by Type* Vacant Units by Type* Weighted Average Vacancy Rate (%) by Type*
Count of
Area 1
Prop. Total Effic. 1BR 2BR 3BR 4+BR Total Effic. 1BR 2BR 3BR 4+BR Overall Effic. 1BR 2BR 3BR 4+BR
Chaves 15 877 72 416 221 154 14 18 - 8 9 1 - 2.1 - 1.9 4.1 0.6 -
Cibola 4 259 - 87 140 32 - 10 - 2 8 - - 3.9 - 2.3 5.7 - -
Curry 30 814 17 253 328 190 26 51 - 14 27 9 1 6.3 - 5.5 8.2 4.7 3.8
Dona Ana 59 3,891 81 1,058 1,668 990 94 59 3 16 22 17 1 1.5 3.7 1.5 1.3 1.7 1.1
Eddy 14 671 - 323 243 105 - 36 - 9 21 6 - 5.4 - 2.8 8.6 5.7 -
Grant 9 391 - 163 157 71 - 14 - 3 9 2 - 3.6 - 1.8 5.7 2.8 -
Guadalupe 5 153 - 51 57 45 - 4 - 1 2 1 - 2.6 - 2.0 3.5 2.2 -
Lea 17 991 D 325 444 202 D 49 D 14 18 15 D 4.9 D 4.3 4.1 7.4 D
Lincoln 6 278 - 128 123 27 - 8 - 4 2 2 - 2.9 - 3.1 1.6 7.4 -
Los Alamos 11 536 72 134 311 19 - 14 - 6 8 - - 2.6 - 4.5 2.6 - -
Luna 14 599 54 188 205 116 36 30 6 9 10 2 3 5.0 11.1 4.8 4.9 1.7 8.3
McKinley 24 1,194 51 223 587 308 25 45 7 5 24 8 1 3.8 13.7 2.2 4.1 2.6 4.0
Otero 9 310 D 106 106 76 D 5 D - 4 1 D 1.6 D - 3.8 1.3 D
Quay 6 147 - 62 69 16 - 10 - 7 3 - - 6.8 - 11.3 4.3 - -
Rio Arriba 5 276 - 100 69 102 5 12 - 10 2 - - 4.3 - 10.0 2.9 - -
Roosevelt 10 249 16 154 64 13 2 7 1 4 1 1 - 2.8 6.3 2.6 1.6 D D
San Juan 18 1,055 D 172 395 477 D 32 D 2 18 12 D 3.0 D 1.2 4.6 2.5 D
San Miguel 9 368 - 139 160 69 - 14 - 2 9 3 - 3.8 - 1.4 5.6 4.3 -
Sandoval3 6 376 D 117 158 82 D 8 D 5 2 1 D 2.1 D 4.3 1.3 1.2 D
Sierra 4 155 - 126 21 8 - 7 - 5 2 - - 4.5 - 4.0 9.5 - -
Socorro 5 259 - 169 86 4 - 12 - 7 5 - - 4.6 - 4.1 5.8 D D
Taos 7 299 - 77 171 51 - 6 - 1 4 1 - 2.0 - 1.3 2.3 2.0 -
Valencia 10 382 - 114 215 53 - 7 - 1 6 - - 1.8 - 0.9 2.8 - -
Colfax/Hidalgo/Torrance/Union2 5 165 2 64 72 22 5 8 - 1 5 1 1 4.8 - 1.6 6.9 4.5 20.0
New Mexico Study Area 302 14,695 409 4,749 6,070 3,232 235 466 19 136 221 83 7 3.2 4.6 2.9 3.6 2.6 3.0
1. These figures do not represent a comprehensive coverage of all areas in each county.
2. Counties were combined to maintain confidentiality for areas that did not meet the thresholds for data disclosure.
3. Sandoval counts do not include Rio Rancho.THE ECONOMIC OPPORTUNITIES AND CHALLENGES OF URANIUM MINE CLEANUP IN NEW
MEXICO |T-3
Table 3. Counts of Apartment Properties, Year Built, Units by Type, and Weighted Average Rents by Type
New Mexico Counties and County Cluster: March 2021
Count of Property Built2 Total Count of Units by Type Weighted Average Rent by Type*
1
Area Properties Earliest Latest Total Effic. 1BR 2BR 3BR 4+ BR Overall Effic. 1BR 2BR 3BR 4+BR
Chaves 14 1972 2008 735 72 360 192 97 14 $633 $557 $567 $641 $750 $885
Curry 30 1963 2014 814 17 253 328 190 26 553 490 505 590 633 767
Dona Ana 57 1960 2014 3,775 81 975 1,635 990 94 691 504 620 667 776 912
Eddy 13 1935 2018 631 - 283 243 105 - 760 - 667 896 1,046 885
Grant 8 1970 2000 311 - 147 109 55 - 553 - 478 552 618 -
Guadalupe 5 1969 1997 153 - 51 57 45 - 651 - 601 651 787 -
Lea 16 1960 2018 987 D 324 441 202 D 792 D 719 788 926 D
Lincoln 6 1984 2005 278 - 128 123 27 - 653 - 562 717 682 -
Los Alamos 11 1948 2002 536 72 134 311 19 - 960 818 857 1,078 1,218 -
Luna 14 1940 2005 599 54 188 205 116 36 596 517 503 587 674 690
McKinley 22 1970 2016 1,166 51 222 562 306 25 663 263 628 657 752 783
Otero 8 1984 2007 250 D 66 102 76 D 559 D 495 548 540 D
Quay 6 1969 2011 147 - 62 69 16 - 627 - 568 655 825 -
Roosevelt 10 1963 2012 249 16 154 64 13 2 582 497 518 618 688 808
San Juan 16 1970 2011 1,017 D 142 387 477 D 711 D 617 655 962 D
San Miguel 9 1976 2002 368 - 139 160 69 - 562 - 525 559 670 -
4
Sandoval 4 1971 2017 237 D 91 99 45 D 558 D 611 591 552 D
Sierra 4 1974 1988 155 - 126 21 8 - 654 - 631 729 860 -
Socorro 3 1973 1986 163 - 75 84 4 - 627 - 567 661 767 -
Taos 6 1996 2013 277 - 71 155 51 - 526 - 463 519 595 -
Valencia 10 1978 2010 382 - 114 215 53 - 695 - 619 706 933 -
Chaves 14 1972 2008 735 72 360 192 97 14 633 557 567 641 750 885
Curry 30 1963 2014 814 17 253 328 190 26 553 490 505 590 633 767
Colfax/Hidalgo/Torrance/Union3 9 1968 2018 246 270 116 7 2,925 275 522 605 678 589 128 9
New Mexico Study Area 281 1935 2018 13,476 661 4,221 5,569 5,889 483 $648 $592 $587 $670 $774 $841
1. These figures do not represent a comprehensive coverage of all areas in each county. 2. A significant number of properties did not report the year the complex was built.
3. Counties were combined to maintain confidentiality for areas that did not meet the thresholds for data disclosure. 4. Sandoval counts do not include Rio Rancho.
Note: These tabulations do not include properties that were identified has having lump sum subsidies. Hence, the total number of units is less than those used in vacancy rate calculations seen elsewhere in this report.THE ECONOMIC OPPORTUNITIES AND CHALLENGES OF URANIUM MINE CLEANUP IN NEW
MEXICO |T-4
Table 4. Affordable Compared to Market Only Properties
Property Type # of Properties Total Units Effic. 1BR 2BR 3BR 4+BR Vacancies Rate Rents1
Affordable 226 11,018 213 3,610 4,332 2,638 225 359 3.3 $634
Market Only 76 3,677 196 1,139 1,738 594 10 107 2.9 $706
New Mexico Study Area 302 14,695 409 4,749 6,070 3,232 235 466 3.2 $648
1
Average Rents are calculated on a subset of properties.
Note: Affordable properties include market units.MARCH 2021 NEW MEXICO
APARTMENT SURVEY| 27
Appendix
Postcard: Pre-Survey Notice A-1
Survey Letter A-2
Survey Instructions A-3
Survey A-4
Postcard: Post-Survey Notice A-5
Survey Monkey Tool A-6
Preliminary Apartment Vacancy Rate By County: March 2021 A-11
Revised Apartment Vacancy Rates By County: March 2021 A-12
Communities with Respondents A-13MARCH 2021 NEW MEXICO
APARTMENT SURVEY| A-1
Postcard: Pre-Survey NoticeMARCH 2021 NEW MEXICO
APARTMENT SURVEY| A-2
Survey LetterMARCH 2021 NEW MEXICO
APARTMENT SURVEY| A-3
Survey InstructionsMARCH 2021 NEW MEXICO
APARTMENT SURVEY| A-4
SurveyMARCH 2021 NEW MEXICO
APARTMENT SURVEY| A-5
Postcard: Post-Survey NoticeMARCH 2021 NEW MEXICO
APARTMENT SURVEY| A-6
Survey Monkey ToolMARCH 2021 NEW MEXICO APARTMENT SURVEY| A-7
MARCH 2021 NEW MEXICO
APARTMENT SURVEY| A-8
MARCH 2021 NEW MEXICO
APARTMENT SURVEY| A-9
MARCH 2021 NEW MEXICO
APARTMENT SURVEY| A-10
MARCH 2021 NEW MEXICO
                                                                                             APARTMENT SURVEY| A-11

Preliminary Apartment Vacancy Rate By County: March 2021
Preliminary Table June 7, 2021
Apartment Vacancy Rates by County: March 2021
County                        Properties        Total Units       Total Vacant Units       Vacancy Rate
Chaves                                 14               869                      18                2.1%
Cibola                                  4               259                      10                3.9%
Curry                                  30               814                      51                6.3%
Dona Ana                               59             3,867                      63                1.6%
Eddy                                   13               669                      35                5.2%
Grant                                   9               391                      15                3.6%
Guadalupe                               5               153                       6                2.6%
Lea                                    17               991                      30                4.9%
Lincoln                                 5               218                       6                3.7%
Los Alamos                             12               536                       5                2.6%
Luna                                   14               599                      20                5.0%
McKinley                               23             1,190                      32                3.8%
Otero                                   7               256                      12                2.0%
Quay                                    6               147                      12                6.8%
Rio Arriba                              5               276                      16                4.3%
Roosevelt                              10               249                       0                2.8%
San Juan                               18             1,055                      51                3.0%
San Miguel                              9               368                       6                3.8%
Sandoval (part)                         6               376                      10                1.9%
Sierra                                  4               155                      18                4.5%
Socorro                                 4               252                        6               2.0%
Taos                                    5               261                        11              0.8%
Valencia                               10               382                        6               1.8%

Combined                                5               165                        8               4.8%

New Mexico Study Area                294            14,498                      457                3.2%

Notes:
Properties of 5 or more units not including Albuquerque, Rio Rancho or Santa Fe.
Sandoval does not include properties in the City of Rio Rancho.
As of June 7, 2021; Combined Counties are Colfax, Hidalgo, Torrance, and Union.
Individual counties in the combined counties did not meet thresholds for data disclosure.
While properties were sent surveys in the following counties none were returned Catron, De Baca,
Harding and Mora.
These figures do not represent a comprehensive coverage of each county.
Follow-up continued into 2021 June. Thus, some data could refer to a period after March.
Source: University of New Mexico, Bureau of Business and Economic Research,
March 2021 Apartment Survey for the New Mexico Mortgage Finance Authority.
MARCH 2021 NEW MEXICO
APARTMENT SURVEY| A-12
Revised Apartment Vacancy Rates By County: March 2021
Revised June 23, 2021
Apartment Vacancy Rates by County: March 2021
Total Vacant
County Properties Total Units Units Vacancy Rate
Chaves 15 877 18 2.1%
Cibola 4 259 10 3.9%
Curry 30 814 51 6.3%
Dona Ana 59 3,891 59 1.5%
Eddy 14 671 36 5.4%
Grant 9 391 14 3.6%
Guadalupe 5 153 4 2.6%
Lea 17 991 49 4.9%
Lincoln 6 278 8 2.9%
Los Alamos 11 536 14 2.6%
Luna 14 599 30 5.0%
McKinley 24 1,194 45 3.8%
Otero 9 310 5 1.6%
Quay 6 147 10 6.8%
Rio Arriba 5 276 12 4.3%
Roosevelt 10 249 7 2.8%
San Juan 18 1,055 32 3.0%
San Miguel 9 368 14 3.8%
Sandoval 6 376 8 2.1%
Sierra 4 155 7 4.5%
Socorro 5 259 12 4.6%
Taos 7 299 6 2.0%
Valencia 10 382 7 1.8%
Combined 5 165 8 4.8%
New Mexico Study Area 302 14,695 466 3.2%
Notes:
Properties of 5 or more units not including Albuquerque, Rio Rancho or Santa Fe.
Sandoval does not include properties in the City of Rio Rancho.
Combined Counties are Colfax, Harding, Torrance, and Union.
Individual counties in the combined counties did not meet thresholds for data disclosure.
While properties were sent survey's in the following counties none were returned Catron,
De Baca, Harding and Mora.
These figures do not represent a comprehensive coverage of each county.
Follow-up continued into 2021 June. Thus, some data could refer to a period after March.
Source: University of New Mexico, Bureau of Business and Economic Research,MARCH 2021 NEW MEXICO
APARTMENT SURVEY| A-13
Communities with Respondents
Community County Community County
Acoma Pueblo Cibola Los Ranchos de Albuquerque Sandoval
Alamogordo Otero Loving Eddy
Anthony Dona Ana Lovington Lea
Artesia Eddy Mescalero Otero
Aztec San Juan Moriarty Torrance
Belen Valencia Navajo McKinley
Bernalillo Sandoval Ohkay Owingeh Rio Arriba
Bloomfield San Juan Picurius Pueblo Taos
Capitan/Carrizozo Lincoln Portales Roosevelt
Carlsbad Eddy Raton Colfax
Clayton Union Roswell Chaves
Cloudcroft Otero Ruidoso Lincoln
Clovis Curry Ruidoso Downs Lincoln
Columbus Luna San Jon Quay
Crownpoint McKinley Santa Clara Grant
Deming Luna Santa Rosa Guadalupe
Dexter Chaves Santa Teresa Dona Ana
Dulce Rio Arriba Santo Domingo Pueblo Sandoval
Espanola Rio Arriba Shiprock San Juan
Eunice Lea Silver City Grant
Farmington San Juan Socorro Socorro
Gallup McKinley Sunland Park Dona Ana
Grants Cibola Taos Taos
Hatch Dona Ana Texico Curry
Hobbs Lea Truth or Consequences Sierra
Laguna Cibola Tucumcari Quay
Las Cruces Dona Ana Tularosa Otero
Las Vegas San Miguel Vaughn Guadalupe
Logan Quay Zuni McKinley
Lordsburg Hidalgo Zuni Pueblo McKinley
Los Alamos Los Alamos
Los Lunas ValenciaYou can also read