Marine weather monitoring through a WebGIS application
←
→
Page content transcription
If your browser does not render page correctly, please read the page content below
Marine weather monitoring through a WebGIS
                            application
               Kolios(1),(2) S., Petsios (1),(2) S., Loukadakis(2) D., Stylios(1),(2) C.

       (1)
              Computer Technology Institute and Press “Diophantus”, Patras, Greece.
      (2)
             Lab. of Knowledge & Intelligent Computing (KIC-LAB), Dept. of Computer
              Engineering, Technological Educational Institute of Epirus, Arta, Greece.

        Abstract. Meteorological parameters are considered as significant physical pa-
        rameters that are essential for the study of a variety of phenomena in the atmos-
        phere, the climate, the weather and the general physical environment at the
        Earth surface. Extreme values of these parameters which in turn characterize
        extreme weather events are expected to increase regarding frequency and inten-
        sity because of the rapidly changing climate but they can be identified by moni-
        toring meteorological parameters. Furthermore, extreme weather events serious-
        ly affect sea-transportation and relative processes with great economic im-
        portance. A modern and integrated method to monitor these parameters and
        phenomena is the Geographic Information Systems (GIS). This study describes
        the main procedures for the development and the operational use of a WebGIS
        application regarding marine weather monitoring and forecasting in port areas
        and the sea-corridors.

        Keywords: Marine weather, Port Community Systems, extreme weather,
        WebGIS

1       Introduction

    Recently, there is an increasing tendency for the development and the usage of GIS
applications regarding environment. These applications are focusing not only in spa-
tial analysis, decision making and future planning using the wide range of GIS capa-
bilities, but they also provide integrated web based services to end–users and general
public, through modern visualization of scientific results and information using inter-
active maps and graphs (e.g [1]; [2]). More specifically, GIS applications are essential
for a modern, visual representation of environmental issues through monitoring the
spatial and temporal changes, supporting planners and stakeholders to design and
envision in medium and long-term scale the environmentally sustainable future.
    It is well known that many port related activities and the huge increase of maritime
commerce through intermodal and unimodal transportation have a great impact in
marine and air environment (e.g [3]; [4]; [5]; [6]; [7]; [8]).

TETHYS 2015 workshop
14 December 2015 – Bari, Italy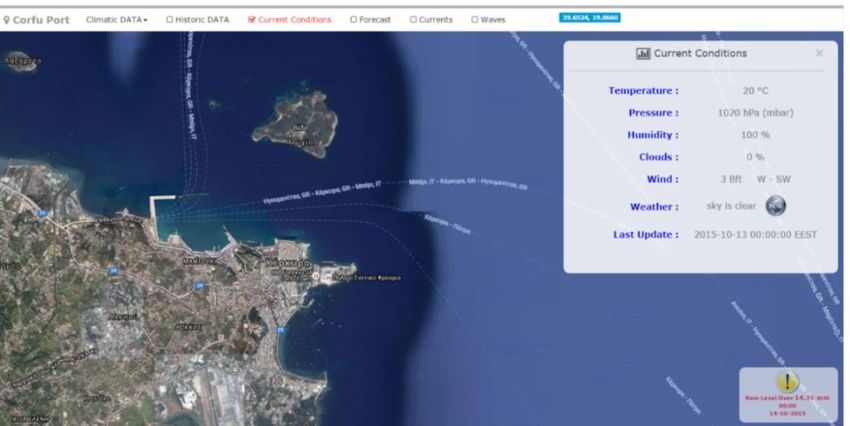
On the other hand, marine transportation and all relative port daily activities that
could be affected from extreme weather events, have crucial economic importance for
sea commerce. International organizations like IMO (International Maritime Organi-
zation) and WMO (World Meteorological Organization) define legislations & strate-
gies to ensure maritime safety and they require accuracy of weather reports & fore-
casts so that to decrease accidents and minimize economic and human losses. Conclu-
sively, it is essential the need for robust prognosis of extreme weather events in port
areas, early warning systems, automatic real-time information and high weather fore-
cast quality (especially about storms, heavy precipitation, wind, waves and extreme
temperatures) for the sustainable development of sea commerce.
    This study presents a WebGIS application (www.portweather.eu), which provides
marine weather monitoring and forecasting to support the mercantile and passenger
traffic. The application provides also information for past weather conditions and the
climatic profile of four port areas of interest [Bari (Italy), Corfu (Greece), Igoumeni-
tsa (Greece), Patras (Greece)]. The WebGIS application has developed with the gen-
eral objective to enhance the reorganization of the transport services, reducing poten-
tial accidents by monitoring weather conditions and improve services to passengers
and port stakeholders.
    Section 2 presents the available data and applied methods and section 3 describes
the WebGIS system the main menus and functionalities of the application.

2        Data and methods

   The WebGIS application for the marine weather monitoring/forecasting
(www.portweather.eu) in ports and their surroundings use real-time measurements
from ground stations nearby the ports of interest. It provides forecasts from three-
hourly to three days ahead. The measurements and the forecasts concern basic mete-
orological parameters, referred in the Table 1.

    Table 1. The meteorological parameters provided in the WebGIS for port weather monito-
                                       ring/forecasting.

                                 Parameter                 Unit
                                Temperature            Celsius (oC)
                                Precipitation              mm
                                Wind speed                  Bft
                               Wind direction            Degrees
                                 Cloudiness                 %
                                  Humidity                  %

   The real-time and forecasted values for the parameters of the Table 1 come from
the “http://openweathermap.org/” service. This service provides data of ground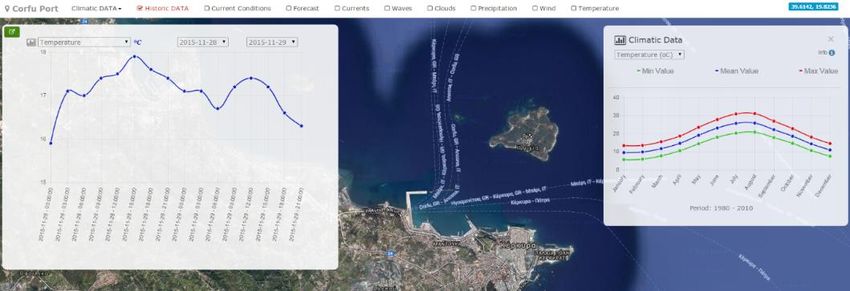
weather stations as well as forecasts based on their models. An Application Program
Interface (ΑPIs) has developed to retrieve information from the servive in suitable
time-steps and text format. Then, all the retrieved data are analyzed and visualized
automatically in the WebGIS application.
This WebGIS application consists of a software framework that integrates modules
providing various functionality along with specific user–written code to achieve the
required system functionalities. The WebGIS platform utilizes open–source frame-
works and libraries to achieve a professional level of development and maintenance.
More specifically, the Codeigniter – PHP MVC Framework, the Twitter Bootstrap –
CSS Framework, the jQuery – JavaScript Library, the jQuery UI – JavaScript GUI
Library and the Google Maps API (version 3) – web mapping service, are used. Such
tools have been used in many applications (e.g [9];[10]).
3 Main menus of the WebGIS application
The central introductory interface of the WebGIS application gathers a list with all
the available ports on the platform. By clicking on the port of choice, it is appeared
the main meteorological parameters and all the relative weather information.
More specifically, there is a checkbox regarding climate; by selecting it, graphs
about climatic behavior of main meteorological parameters in the area surrounding
the port of interest are provided (Figure 1).
Fig. 1. The weather information about the port of Corfu (Greece). The same list of content is
available for all ports. On the left, a past period of time is selected and illustrate the temporal
evolution of a parameter. On the right, the climatic variation of a parameter in monthly basis is
seen.
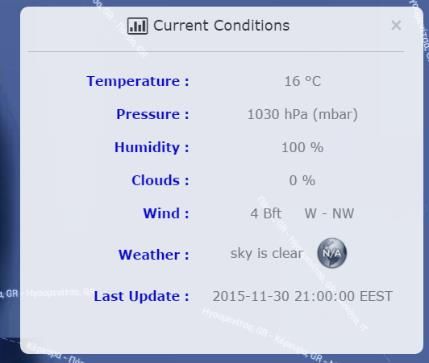
The current meteorological conditions in a port area can be seen when the check-
box “Current conditions” is selected. By clicking this, a legend that contains the cur-
rent values of various meteorological parameters (temperature, pressure, humidity,
clouds, wind) is provided (Figure 2).
Then, the user may select “forecast” check-box and so the temporal weather esti-
mations for a time that extents from three hours to three days three interval is illus-
trated (Figure 2).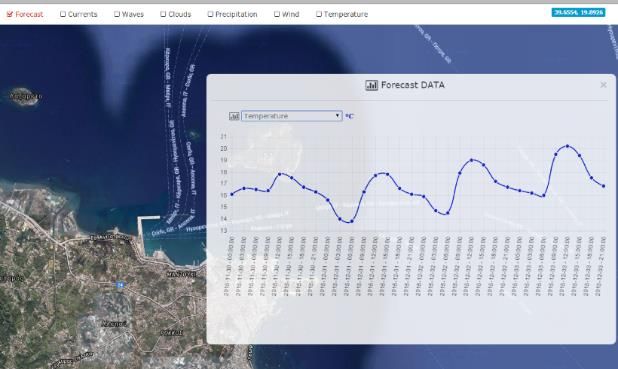
Fig. 2. Screen with the current conditions (on the left) and the forecast (on the right).

   The WebGIS application includes an alert system about extreme weather events.
Extreme weather events are considered of particular interest because such phenomena
and situations can cause great economic loses, damages to infrastructures and private
properties and even human losses. Thus, alerts about potential extreme weather events
are of crucial importance for the sea transport and all port activities.
   More analytically, when a value of the meteorological parameters (monitored or
forecasted) exceeds a threshold value, an alert sign (like the on presented at Figure 3),
is appeared in the graphical interface of the web-based application. The threshold
values for all the meteorological parameters have defined through a climatic statistical
analysis of the historical data for the last decade.

Fig. 3. An example of the alert signal (down right of the figure) is shown when a value of me-
   teorological parameter (monitored or forecasted) exceeds a pre-defined threshold value.

   There are three different alert labels (signs) according to the intensity of the ex-
treme weather event (Figure 4). The first alerts refer to a potentially extreme event,
the second level is the appearance of an extreme event and the third level is referred
to a very extreme event.
Fig. 4. Alert symbols referring to extreme and very extreme events correspondingly.
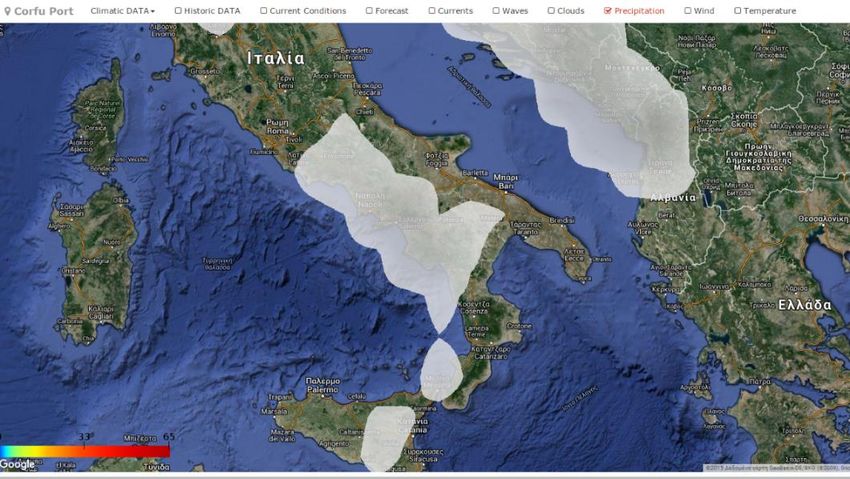
The WebGIS application also provides interactive maps (Figure 5), which provide
spatial distributions of main meteorological parameters such as cloudiness, precipita-
tion, wind, temperature and pressure. This module is particularly interest as it de-
scribes the weather conditions of the sea-corridors among ports of Adriatic and Ionian
Sea.
Fig. 5. The spatial distribution of precipitation is provided from the
“http://openweathermap.org/” service and visualized through the WebGIS application.
4 Conclusions
The presented WebGIS application provides essential information about weather
conditions at ports of Ionian and Adriatic Sea as well as in their greater areas. The
application has developed with modern techniques and creates an integrated web-
based interface easy to use and portable with every mobile device.
This application not only provides information about current meteorological situa-
tion and forecasts, but also alerts in case of extreme weather events referring to tem-
perature, precipitation and wind. The WebGIS is very useful for port stakeholders
because it helps them to improve the safety of many operations and especially activi-ties that are affected from meteorological conditions and extreme weather phenome-
na.
Acknowledgements
This work is supported by the project “pAssengeRs and loGistics information Ex-
change System” (ARGES-I5-2.2) under European Territorial Cooperation Pro-
gramme Greece-Italy 2007-2013 co-funded and by the European Union European
Regional Development Fund (ERDF) and by national funds of Greece and Italy.
References
[1]. Fustes, D., Cantorna, D., Dafonte, C., Arcay, B., Iglesias, A. (2014). A cloud–integrated
web platform for marine monitoring using GIS and remote sensing. Application to oil spill
detection through SAR images. Future Generation Computer Systems, 34, 155–160.
[2]. Kulkarni, A. T., Mohanty, J., Eldho, T. I., Rao, E. P., Mohan, B. K. (2014). A web GIS
based integrated flood assessment modeling tool for coastal urban watersheds. Computers
and Geosciences, 64, 7–14.
[3]. Dinwoodie, J., Tuck, S., Knowles, H., Benhin, J., & Sansom, M. (2012). Sustainable
development of maritime operations in ports. Business Strategy and the Environment,
21(2), 111–126.
[4]. Grifoll, M., Jordà, G., Espino, M., Romo, J., García–Sotillo, M. (2011). A management
system for accidental water pollution risk in a harbour: the Barcelona case study. Journal
of Marine Systems, 88 (1), 60–73.
[5]. Gupta, A. K., Gupta, S. K., Patil, R. (2005). Environmental management plan for port
and harbour projects. Clean Technologies and Environmental Policy, 7 (2), 133–141.
[6]. Bailey, D., & Solomon, G. (2004). Pollution prevention at ports: clearing the air. Envi-
ronmental Impact Assessment Review, 24(7–8), 749–774.
[7]. Edoho, F. M. (2008). Oil transnational corporations: corporate social responsibility and
environmental sustainability. Corporate Social Responsibility and Environmental Man-
agement, 15, 210–222.
[8]. Eyring, V., Isaksen, I. S. A., Berntsen, T., Collins, W. J., Corbett, J. J., Endresen, O.,
Grainger, R. G., Moldanova, J., Schlager, H., Stevenson, D. S. (2010). Transport impacts
on atmosphere and climate: Shipping. Atmospheric Environment, 44 (37), 4735–4771.
[9]. Pascual M., Alves E., De Almeida T., Holanda M., 2012. An Architecture for Geo-
graphic Information Systems on the Web – webGIS. The Fourth International Conference
on Advanced Geographic Information Systems, Applications, and Services, 209-2014,
ISBN: 978-1-61208-178-6.
[10]. Kolios S., Stylios C., Petunin A., 2015. A WebGIS platform to monitor environmental
conditions in ports and their surroundings in South Eastern Europe. Environmental Moni-
toring and Assessment, 187 (9), 574.You can also read