Market Sense Fidelity Viewpoints
←
→
Page content transcription
If your browser does not render page correctly, please read the page content below

®
Fidelity Viewpoints :
Market Sense
The latest headlines, the current market conditions,
and what it all means for you.
®
       Fidelity Viewpoints :
       Market Sense
       The latest headlines, the current market conditions,
       and what it all means for you.

Views and opinions expressed in this webcast are those of the speakers. This discussion is for educational purposes
and should not be considered investment advice. Fidelity does not provide legal or tax advice. The information herein
is general in nature and should not be considered legal or tax advice.
Our Speakers
Host
Jim Armstrong
Director, Fidelity Investments
Jim Armstrong is a director with Fidelity’s Client Solutions Business team. Prior to this role, he was a
marketing director, focused on creating educational content for workplace participants to help with
retirement planning and other financial wellness topics. Formerly, Jim distinguished himself as an Emmy-
winning journalist, spending 17 years as a television reporter for network affiliates around the country.
Special guest panelists
Denise Chisholm
Director, Quantitative Market Strategy, Fidelity Investments
Denise Chisholm is a sector strategist in the Equity and High Income division at Fidelity Investments. In this role,
Denise is responsible for the research of portfolio construction strategies combining sector-based mutual funds
and exchange-traded funds (ETFs). Prior to assuming her current responsibilities in April 2013, Denise held
multiple roles within Fidelity, including research analyst on the megacap research team, research analyst on the
international team, and sector specialist.
Leanna Devinney, CFP®
Vice President, Branch Leader, Fidelity Investments
Leanna Devinney is responsible for leading one of Fidelity’s Investor Centers. In this role, she offers our clients
financial and investment guidance, including one-on-one retirement planning, wealth management, income
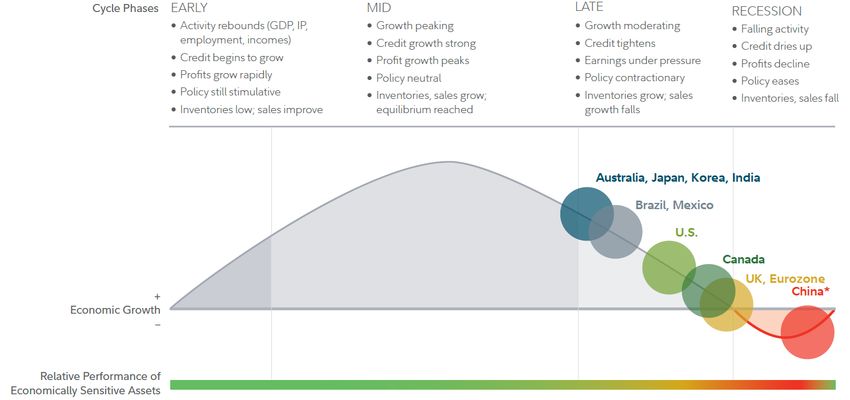
strategies, and college planning services as well as integrated employer benefits solutions.Phases of the Business Cycle The diagram above is a hypothetical illustration of the business cycle, the pattern of cyclical fluctuations in an economy over a few years that can influence asset returns over an intermediate-term horizon. There is not always a chronological, linear progression among the phases of the business cycle, and there have been cycles when the economy has skipped a phase or retraced an earlier one. * A growth recession is a significant decline in activity relative to a country’s long-term economic potential. We use the “growth cycle” definition for most developing economies, such as China, because they tend to exhibit strong trend performance driven by rapid factor accumulation and increases in productivity, and the deviation from the trend tends to matter most for asset returns. We use the classic definition of recession, involving an outright contraction in economic activity, for developed economies. Source: Fidelity Investments (AART), as of 7/31/22.
How Stocks Have Performed at Similar Times in the Past
Stocks historically have fared well after 20% declines.

Past performance is no guarantee of future results. NTM: Next 12 months. Analysis based on the top 3,000 U.S.
stocks by market capitalization. Source: Haver Analytics, Fidelity Investments, as of April 30, 2022.
Discretionary Bounce?
                                                   Discretionary Bounce?
                                       Odds of Outperformance After 15% Underperformance
                                                   10 Instances, 1962-Present
                                100%
                                                                               90%
                                90%

                                80%
                                                 70%
                                70%

                                60%

                                50%

                                40%

                                30%

                                20%

                                10%

                                 0%
                                             NextN6M
                                                 6 Months                  NextN12M
                                                                                12 Months
  Source: Haver, Factset, FMR
Missing Out on the Best Days Can Cost Investors Those who missed out on just a handful of the market’s best days significantly reduced their portfolio’s value. Past performance is not a guarantee of future results. The hypothetical example assumes an investment that tracks the returns of a S&P 500® Index and includes dividend reinvestment but does not reflect the impact of taxes, which would lower these figures. “Best days” were determined by ranking the one-day total returns for the S&P Index within this time period and ranking them from highest to lowest. There is volatility in the market and a sale at any point in time could result in a gain or loss. Your own investment experience will differ, including the possibility of losing money. Source: Bloomberg as of 12/31/18.
Please note that there is no uniformity of time among phases, nor is there always a chronological progression in this order. For example, business cycles have varied between one and 10 years in the U.S., and there have been
examples when the economy has skipped a phase or retraced an earlier one.
Information presented herein is for discussion and illustrative purposes only and is not a recommendation or an offer or solicitation to buy or sell any securities. Views expressed are as of the date indicated, based on the
information available at that time, and may change based on market and other conditions. Unless otherwise noted, the opinions provided are those of the speakers and not necessarily those of Fidelity Investments or its
affiliates. Fidelity does not assume any duty to update any of the information.
To the extent any investment information in this material is deemed to be a recommendation, it is not meant to be impartial investment advice or advice in a fiduciary capacity and is not intended to be used as a primary basis
for you or your clients’ investment decisions. Fidelity and its representatives may have a conflict of interest in the products or services mentioned in this material because they have a financial interest in them and receive
compensation, directly or indirectly, in connection with the management, distribution, or servicing of these products or services, including Fidelity funds, certain third-party funds and products, and certain investment services.
Investing involves risk, including risk of loss.
Past performance is no guarantee of future results.
All indexes are unmanaged, and performance of the indexes includes reinvestment of dividends and interest income, unless otherwise noted. Indexes are not illustrative of any particular investment, and it is not
possible to invest directly in an index.
The S&P 500® Index is a market capitalization–weighted index of 500 common stocks chosen for market size, liquidity, and industry group representation to represent U.S. equity performance. S&P and S&P 500 are registered
service marks of Standard & Poor's Financial Services LLC. You cannot invest directly in an index.
Diversification and/or asset allocation do not ensure a profit or protect against loss.
Stock markets are volatile and can fluctuate significantly in response to company, industry, political, regulatory, market, or economic developments. Investing in stock involves risks, including the loss of principal.
Because of their narrow focus, sector investments tend to be more volatile than investments that diversify across many sectors and companies.
The consumer discretionary industries can be significantly affected by the performance of the overall economy, interest rates, competition, consumer confidence and spending, and changes in demographics and consumer
tastes.
The technology industries can be significantly affected by obsolescence of existing technology, short product cycles, falling prices and profits, competition from new market entrants, and general economic condition.
Foreign markets can be more volatile than U.S. markets due to increased risks of adverse issuer, political, market, or economic developments, all of which are magnified in emerging markets. These risks are particularly
significant for investments that focus on a single country or region.
In general, the bond market is volatile, and fixed income securities carry interest rate risk. (As interest rates rise, bond prices usually fall, and vice versa. This effect is usually more pronounced for longer-term securities). Fixed-
income securities also carry inflation risk, liquidity risk, call risk, and credit and default risks for both issuers and counterparties. Lower-quality fixed-income securities involve greater risk of default or price changes due to
potential changes in the credit quality of the issuer. Foreign investments involve greater risks than U.S. investments, and can decline significantly in response to adverse issuer, political, regulatory, market, and economic risks.
Any fixed-income security sold or redeemed prior to maturity may be subject to loss.
Dollar-cost averaging does not assure a profit or protect against loss in declining markets. For the strategy to be effective, you must continue to purchase shares in both market ups and downs.
The CFP® certification is offered by the Certified Financial Planner Board of Standards Inc. (“CFP Board”). To obtain the CFP® certification, candidates must pass the comprehensive CFP® Certification examination, pass the
CFP® Board’s fitness standards for candidates and registrants, agree to abide by the CFP Board’s Code of Ethics and Professional Responsibility, and have at least three years of qualifying work experience, among other
requirements. The CFP Board owns the certification mark CFP® in the United States.
Fidelity Wealth Services provides non-discretionary financial planning and discretionary investment management through one or more Portfolio Advisory Services accounts for a fee.
Advisory services offered by Fidelity Personal and Workplace Advisors LLC (FPWA), a registered investment adviser. Discretionary portfolio management services provided by Strategic Advisers LLC (Strategic Advisers), a
registered investment adviser. Brokerage services provided by Fidelity Brokerage Services LLC (FBS), and custodial and related services provided by National Financial Services LLC (NFS), each a member NYSE and SIPC.
FPWA, FBS, and NFS are Fidelity Investments companies.
Fidelity does not provide legal or tax advice. The information herein is general and educational in nature and should not be considered legal or tax advice. Tax laws and regulations are complex and subject to change, which
can materially impact investment results. Fidelity cannot guarantee that the information herein is accurate, complete, or timely. Fidelity makes no warranties with regard to such information or results obtained by its use and
disclaims any liability arising out of your use of, or any tax position taken in reliance on, such information. Consult an attorney or tax professional regarding your specific situation.
Before investing in any mutual fund or exchange-traded fund, you should consider its investment objectives, risks, charges, and expenses. Contact Fidelity for a prospectus, an offering circular, or, if available, a
summary prospectus containing this information. Read it carefully.
Personal and workplace investment products are provided by Fidelity Brokerage Services LLC, Member NYSE, SIPC, 900 Salem Street, Smithfield, RI 02917
© 2022 FMR LLC. All rights reserved.
923295.170.0
You can also read