LONG-TERM HOUSING RENTALS IN MALTA - Article published in the Quarterly Review 2021:1, pp. 51-55 - Central Bank ...
←
→
Page content transcription
If your browser does not render page correctly, please read the page content below
LONG-TERM HOUSING RENTALS
        IN MALTA

        Article published in the Quarterly Review 2021:1, pp. 51-55
BOX 2: LONG-TERM HOUSING RENTALS IN MALTA1
Over the past years, the Maltese home-ownership and rental markets were very dynamic,
with factors such as population growth, new market trends in tourism and a turnaround in
the construction sector affecting both supply and demand of housing. The Central Bank of
Malta closely observes rental prices advertised in Malta.2 This Box looks at some of the
findings in Ellul (2020) which assesses the long-term housing rental market, in particular
through the channel of online advertised listings with leading real estate agents.
No single study can claim to assess comprehensively the various trends at play in the
housing rental market. Ellul (2020) focuses on a selected database of uniquely identifi-
able online adverts and property listings. This is the first attempt to approach fundamental
questions on the rental market in Malta using a validated database. A significant amount of
effort and care was placed in compiling and ensuring the validity of the original data, which
being in the realm of big data does not necessarily comply with the strict requirements of
economic analysis. In particular, rigorous checks were implemented to filter out duplicate
observations, and thus allow for an accurate discussion on the distribution of long-term
rental properties in Malta during the reference period studied, as well as the pricing of prop-
erty characteristics over time. A further benefit from focusing on what were termed ‘viable’
advertised listings is the ability to look at the monthly trends in advertised rents, which in
turn allow useful comparisons with what stakeholders observe in these markets.
Viable listings were defined as those adverts for rental properties which were observed
for the first time in the month when the data were being collected, or whenever a previ-
ously-observed listing experienced a price change. Between January and December 2019,
around 16,500 viable observations of rental units were identified. Such observations –
while accounting for only a small proportion of the database – provide a better representa-
tion of current rental market conditions at the time of collection, unlike, for example, adverts
of properties which may have been unavailable but have remained online for subsequent
periods without being updated.
Firstly, looking closely at property types, most of advertised properties in the dataset
were apartments (66.1% of the total), followed by penthouses (11.8%) and maisonettes
(10.8%). There were also listings advertised as individual rooms (2.1%). The rest of the
listings (9.1%) included houses, townhouses, villas, farmhouses, bungalows and palaz-
zos. In terms of individual property characteristics, of the approximate 16,500 viable prop-
erties in the dataset, 47.2% had three or more bedrooms, 38.6% had two bedrooms and
14.3% were listings with one bedroom. Thus, many advertised units on the rental market
1
Prepared by Reuben Ellul. The author is a Principal Economist within the Economic Analysis Department at the Central Bank
of Malta. The author would like to thank Mr. A. Demarco, Dr. A. G. Grech, and Dr. B. Micallef for their comments and suggestions
to earlier drafts of this analysis. The views expressed are those of the author and do not necessarily reflect those of the Bank. Any
errors are the author’s own.
2
For a deeper analysis on this topic, see Ellul, R., (2020), “Long-term housing rentals in Malta: A look at advertised listings,”
Policy Note September 2020, Central Bank of Malta. In this project, advertised rental data from leading property agents in Malta
were collected using public online sources and big data methods. The final dataset comprises hundreds of thousands of obser-
vations, which are then whittled down using data quality controls. The exercise is carried out on a monthly basis, and serves to
supplement and support two parallel projects on the property market carried out by the Bank’s Economics Division. These big data
methods allow the use of several modelling techniques which were previously not possible due to data limitations.
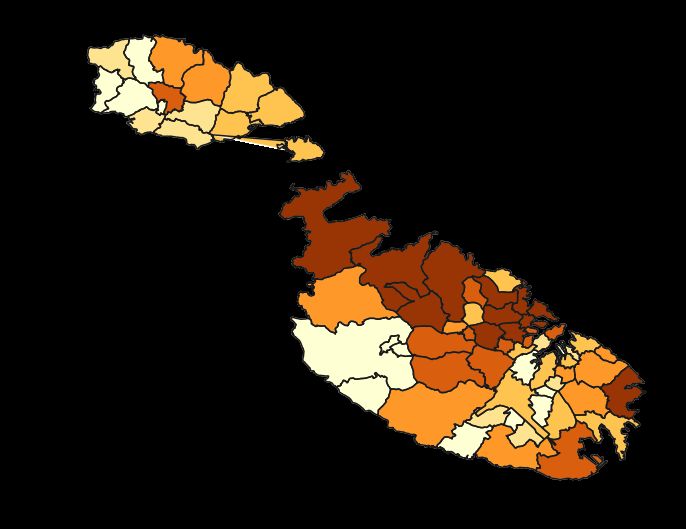
CENTRAL BANK OF MALTA Quarterly Review 2021:1were for larger proper-
Chart 1
ties. This may indicate ADVERTISED RENTAL PROPERTY COUNTS
the rental of units origi- (no. of properties)
nally oriented towards
the Maltese population,
or otherwise idle units for
foreign workers. Finally,
although the properties
appear to be spread
around Malta, they were
highly concentrated in
areas such as Sliema,
St Julian’s, Msida and
Gżira, with outlying - +
denser rental clusters in
Source: Author's calculations.
St Paul’s Bay and Mar-
sascala (see Chart 1).
Hedonic equations for rental prices with characteristics were also estimated.3 Assum-
ing that a one-bedroom, one-bathroom apartment in Sliema represents the base cat-
egory, an increase of one bed in the advertised listing to a two-bedroom unit leads to an
increase of 25.7% in the asking price. Apartments with three or more bedrooms result in
an increase of 47.8% over the base category. Likewise, an extra bathroom in a unit over
the base category leads to an increase in the asking price of 16.3%, while units with three
or more bathrooms command an extra 53.1% over the base category.
Turning to property types, penthouses were advertised with a premium of 20.7% over
an apartment with one bedroom and one bathroom in Sliema, while maisonettes do not
appear to have a statistically significant difference in advertised prices over such an
apartment.4 Listings for single rooms, which may indicate a shared-living space, returned
asking rents which were around 47.6% lower than a one-bedroom, one-bathroom apart-
ment. This may reflect the fact that rooms for rent may have a smaller living space than
studio flats, while also entailing the sharing of all other facilities with other individuals liv-
ing in the rental unit. Other property types, which include houses, townhouses, villas etc.,
command a substantial premium of 47.0% over the base category. These latter property
types tend to command an even higher premium once one considers that most of these
larger properties tend to have more than the ‘one bedroom, one bathroom’ configuration
of the benchmark category.
Estimates for price differences that are driven by location were also calculated for 66 locali-
ties and areas (see Table 1). All localities were advertised at a discount in asking rental prices
3
In order to avoid the problem of equation misspecification bias, this study focuses on relative differences between categories,
rather than on the estimated price levels of particular characteristics.
4
This finding may reflect the comparatively low number of maisonettes for rent with respect to apartments, in particular result-
ing from maisonettes being placed on the market as part of a larger block of apartments. This may reflect the lower quality of
maisonettes placed on the rental market with respect to the more typical maisonettes for domestic residential purposes built in
previous decades.
CENTRAL BANK OF MALTA Quarterly Review 2021:1Table 1
RELATIVE VALUE WITH RESPECT TO SLIEMA
Locality Relative Locality Relative
value (%) value (%)
Sliema 100.0 Fgura 53.2
Mdina - Gudja 52.8
Valletta 91.2 Tarxien 52.6
Ta' Xbiex 91.2 Marsaxlokk 52.6
St Julian's 90.3 Mġarr 52.3
Swieqi 80.9 Paola 52.2
Birgu 75.1 Żebbuġ 52.1
Gżira 75.1 Santa Lucija 50.9
Pembroke 74.3 Żurrieq 50.8
Floriana 69.9 Mqabba 50.5
San Ġwann 66.8 Dingli 49.5
Msida 66.4 Safi 49.2
Naxxar 66.2 Xgħajra 48.9
Għargħur 65.7 Marsa 48.7
Pietà 65.1 Qrendi 48.6
Iklin 64.8 Kirkop 48.3
Lija 64.4 Siġġiewi 47.9
Attard 62.8 Rabat (Gozo) 47.2
Kalkara 62.0 Żabbar 46.3
Bormla 61.1 Mtarfa 46.1
Balzan 60.1 San Lawrenz (Gozo) 41.2
Mellieħa 59.5 Għarb (Gozo) 39.1
Isla 59.2 Żebbuġ (Gozo) 37.4
Santa Venera 57.7 Qala (Gozo) 37.3
Mosta 57.0 Sannat (Gozo) 36.7
St Paul's Bay 56.6 Munxar (Gozo) 36.1
Birkirkara 56.3 Għasri (Gozo) 35.4
Qormi 55.8 Għajnsielem (Gozo) 35.4
Għaxaq 55.0 Xagħra (Gozo) 35.2
Ħamrun 54.8 Kerċem (Gozo) 35.0
Birżebbuġa 54.7 Fontana (Gozo) 34.0
Luqa 54.0 Nadur (Gozo) 33.3
Marsascala 53.7 Xewkija (Gozo) 30.5
Żejtun 53.2
Source: Author's calculations.
with respect to Sliema.5 A limited number of localities have lower discounts, probably due
to their relative proximity or perceived similarity to Sliema, although the opportunity costs
of placing a unit on long-term rent in a highly touristic area may also play a role. In terms of
5
The exception would be Mdina, where no statistically significant difference was found. This finding, which may be due to low
sampling, is explained in more detail in the main Policy Note. This may also reflect the low supply of properties in Mdina, and the
relative exclusivity of the locality.
CENTRAL BANK OF MALTA Quarterly Review 2021:1negative premiums, or rental discount in prices with respect to Sliema, the cheapest rental
properties – controlling for hedonic characteristics – were found in Gozo, with a one bed-
roomed apartment on average being advertised at a monthly asking price of 64.3% less
than a comparable unit in Sliema, while localities such as St Julian’s and Ta’ Xbiex return
discounts of around 9.7% and 8.8%, respectively.
Finally, this approach is also able to provide useful evidence to assess market trends.6 This is
especially useful when looking at shocks to the rental and property markets during the early
months of the COVID-19 pandemic. The data indicate that the number of newly observed
adverts were already
increasing in the latter Chart 2
NEWLY OBSERVED LISTINGS
half of 2019, remaining at (no. of viable newly observed properties)
elevated levels until June 1,200
2020 (see Chart 2). This
1,000
may indicate an increase
of housing supply directed 800
towards the rental market
towards late 2019, 600
and – more recently –
400
an increase in vacant
properties following the 200
COVID-19 pandemic.
0
2019M1
2019M2
2019M3
2019M4
2019M5
2019M6
2019M7
2019M8
2019M9
2020M1
2020M2
2020M3
2020M4
2020M5
2020M6
2019M10
2019M11
2019M12
The direction of price
changes in advertised Source: Author's calculations.
listings monitored in the
Chart 3
dataset act as a clear and SHARE OF POSITIVE AND NEGATIVE PRICE CHANGES IN RENTS
simple indicator of trends (percentage)
100
in the rental market. This 90
is based only on those 80
advertised listings which 70
registered a change 60
in their rent from that 50
observed in the previous 40
listing and does not look 30
20
at the total number of list-
10
ings found online. A nar- 0
row majority of 50.4% of
2019M1
2019M2
2019M3
2019M4
2019M5
2019M6
2019M7
2019M8
2019M9
2020M1
2020M2
2020M3
2020M4
2020M5
2020M6
2019M10
2019M11
2019M12
advertised price changes
were positive (see Chart Positive changes Negative changes
Source: Author's calculations.
3). From October 2019
6
Data quality restrictions may alter the signals derived from adverts as those properties which experience unchanged prices
and are still available on the market, are automatically excluded. Such an exclusion would, in theory, affect the calculation of price
indices, as the possibility of zero inflation is ignored. However, the benefits from ensuring strict data quality controls, in a period
where prices were reported to be increasing strongly, were seen to outweigh this possible effect. To avoid possible biases, studies
which do compute rental price indices from online sources should ensure – as far as the data allow – that the data obtained from
such sources reflect current market conditions.
CENTRAL BANK OF MALTA Quarterly Review 2021:1onward, positive price changes start to taper off, with negative price changes – that is, dis-
counts over previously advertised prices – beginning to feature in higher proportions. This
suggests that by late 2019, the rental market may already have been experiencing changing
conditions, with more landlords willing to accept relatively lower rents – as evidenced by the
more balanced distribution between positive and negative price changes in observed listings
in the second half of 2019.
The proportion of properties registering discounts in their advertised rents, as a share of
the listings with price changes, rose dramatically between March and April 2020, increasing
from 53.7% to 86.2%, respectively. This suggests that landlords have been more willing to
accept lower rents during the period of uncertainty marked by the COVID-19 pandemic, a
finding which confirms similar results found in a study on the effects of COVID-19 on the
rental market undertaken by the Maltese Housing Authority.7
7
Galdes, R. (2020-05-21), “Trust and collaboration in rental market,” Times of Malta.
CENTRAL BANK OF MALTA Quarterly Review 2021:1You can also read