Machine Learning Multiple Linear Regression Algorithm for Fast Moving Consumer Goods: An Exploratory Research
←
→
Page content transcription
If your browser does not render page correctly, please read the page content below
ISSN: 0974-5823                                                                                        Vol. 7 No. 1 January, 2022
                                      International Journal of Mechanical Engineering

       Machine Learning Multiple Linear Regression
      Algorithm for Fast Moving Consumer Goods: An
                   Exploratory Research
                                                     Dr.SK.Dhastagiri Bhasha
                                     Associate Professor, Department of Management Studies
                                                         PBRVITS, Kavali
                                                          Dr.Shaik Karim
                                     Associate Professor, Department of Management Studies
                                       Sree Vidyanikethan Institute of Management, Tirupati
                                                         Dr.K.Vidyasagar
                                      Assistant Professor, Department of Management Studies
                                       Sree Vidyanikethan Institute of Management, Tirupati
                                                            Dr.K.Balaji
                                      Assistant Professor, Department of Management Studies
                                       Sree Vidyanikethan Institute of Management, Tirupati
                                                       Dr.P.Chenchu Reddy
                                      Assistant Professor, Department of Management Studies
                                Vikrama Simhapuri University, SPSR Nellore (Dt), Andhra Pradesh
Abstract:-
Purpose/Aim: - The aim of the exploratory research study was accurate prediction of sales using factors of sales forecasting which
facilitate the manufacturers and retails, especially in the fast moving consumer goods. Outcome: - The outcome of the research
facilitates to forecast the sales of the company in short run and long run to maximize the sales followed by customer satisfaction.
Research Methodology/Approach:-It is an exploratory research design, where researcher used structure questionnaire with a
sample of 150 and applied multiple linear regression analysis using R-Programming. The R2 value is above 90% which explains
90% of the variance in the sales being explained by the independent variables of product differentiation, market focus, offers and
benefits and customer relationship. Practical Implications: -The outcome of the research will facilitate to predict the sales of the
FMCG product under any market segment in India. Social Impact: - The outcome of the research is having social impact, where
maximum customer satisfaction can be understood with the help of developed concept. Originality/Novelty: - The research is new
in the contemporary research, the same factors might not have used in any research to predict the sales of the company. Type of the
Research:-It is an exploratory research design, where factors used in the research are extremely unique to estimate or to predict the
sales of the company.
Index Terms:-Multiple Linear Regression, machine learning algorithm, fast moving consumer goods, exploratory research

                                                          INTRODUCTION
The sales forecasting of FMCG is essential concept of production planning in manufacturing organizations. Unless no proper sales
forecasting it will seriously impact on production schedule. Procurement of factors of production is mainly depends up on the sales
forecasting. The fast moving consumer goods market is a market leader in the competitive economy. The machine learning
algorithms plays a crucial role predicting the future aspects of the sales especially the predictive analytics. The present research
study mainly concentrates on what are the various factors which will impact on sales forecasting in the competitive edge.

                                                       LITERATURE REVIEW
In fact, the holistic nature of approach it is purely depends on the sales forecasting.[1]. Lacking the proper demand forecasting the
inventories is ever increasing which becoming serious issue in later stages. The major categories of products which falls under this
category are: electronic goods, fashions, apparels, shoes and footwear’s are the basic components goods of this [2]. The time series
analysis is the sophisticated concept of forecasting the sales, based on the historical trends of the analysis of the sales [3]. There

Copyrights @Kalahari Journals                                                                        Vol. 7 No. 1 (January, 2022)
                                       International Journal of Mechanical Engineering
                                                             6950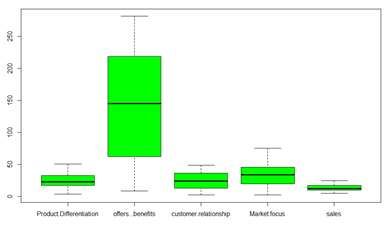
are many concepts of time series analysis like: seasonality and non-seasonality. Mere simple statistics are not sufficient to forecast
the sales of the company need to apply the concept of machine learning applications. There are some techniques like: artificial
neural network, decision tree analysis and regression models [4]. It is evident from the machine learning algorithms are giving
better results in the forecasting of short-term sales [5]. The machine learning algorithms are giving best results like: ANN and
other sorts [6]. The Deep learning algorithms is a more complex form of machine learning computer algorithm which gives better
results in performing the statistical analysis [7]. In fact, the machine learning algorithms are giving the best results while
extracting the reliable and valid results in the contemporary research in any segment. The sales/demand forecasting with the
machine learning algorithms are giving the good results in the especially by applying the time series analysis tool integrated
moving average (ARIMA) model in the contemporary research in sales forecasting [8]. The greater accuracy of the sales
forecasting will be done through machine learning models whereas the traditional models with the manual statistical tools are not
up to the mark with respect to sales forecasting [9]. Introduced machine learning networks sales data with the forecasting
techniques in the retail sales forecasting for better production decisions which facilitates to increase the revenue [10]. The
Bayesian networks analysis based on conditional probabilities are enhancing or increasing the accuracy of the sales forecasting
[11]. Therefore, it is evident that the machine learning algorithms are giving the accuracy while forecasting the demand or sales
which mainly influences the production.
                                                       NEED & IMPORTANCE
Estimation of factors which impact majorly on sales is being influenced by various factors like: product differentiation offers and
benefits, market focus and customer relationship. Improving the sales of the company plays a significant role in the contemporary
competition. Therefore, it is evident that there is a need to conduct the research in the area to identify the various factors which
impact on to maximize the sales of the company.

                                                     SCOPE OF THE RESEARCH
The scope of the research with respect to objectives restricted to estimate the factors which impact on to accelerate the growth of
the sales of FMCG. The scope with respect to the location restricted to the Andhra Pradesh.

                                                  OBJECTIVES OF THE RESEARCH
1.    To review the concepts of machine learning concepts related to sales forecasting.
2.    To identify the factors which influence more to develop the sales of the company
3.    To suggest the best factors for based on sophisticated machine learning algorithms to develop the sales of the company.

                                                    RESEARCH METHODOLOGY
4. Data Sources: Collected both primary and secondary data sources for conducting the research in a systematic manner. In fact,
it is a descriptive research design.
5. Statistical Tools: Applied both inferential and descriptive statistical tools to analyze the data in all dimensions. The predictive
analytics, multiple linear regression analysis applied to predict the sales of the FMCG goods.
6. Statistical Software: R-Programming software used to analyze the data in all aspects. The machine learning structural
equation modeling algorithm used to analyze the data in all aspects.

                                                            HYPOTHESIS
7.    Ha(1): There is a significant positive relationship between product differentiation and sales of the company.
8.    Ha(2): There is a significant positive relationship between offers and benefits and sales of the company.
9.    Ha(3): There is a significant positive relationship between market focus and sales of the company.
10.   Ha(3): There is a significant positive relationship between customer relationship and sales of the company.
Descriptive Analytics:- There are four factors which influence the sales like: product differentiation, offers and benefits given by
the seller, customer relationship and market focus. The following Table 4.1 exhibits the details of the descriptive statistics.
                                                  TABLE1: 1Descriptive Analysis

Sources: Author Complied
Copyrights @Kalahari Journals                                                                        Vol. 7 No. 1 (January, 2022)
                                       International Journal of Mechanical Engineering
                                                             6951
The above Table 4.1 shows the data is following the normal distribution as the skewness and kurtosis values falls in between +/- 2,
which explains that the data is following the normal distribution. The total samples of each observation will be 30 followed by the
highest mean value of offers and benefits given by the seller in the competitive market followed by the standard deviation will be
89.11 the maximum value will be 281 and minimum value will be 272.8. Therefore, it can be conclude that the data is suitable for
conducting parametric tests followed by the correlation among the independent variables can be drawn and the dependency and
independency can be tested through multiple linear regression analysis.Outliers:The outliers are the extremely different values in
the data, which deviates the outcome of the research in different direction. Need to identify the outliers in the data that has to be
eliminated which brings the accuracy in the data. The boxplot is a good measurement to identify the outliers existed in the data.
The following figure: 1 shows the outliers in the data.
FIGURE: 1 Whisker Box-Plot for Outliers Detection
The above figure.1 depicts the outlier’s concept in the data. In fact, the above figure shows that there are no outliers in the data.
The outlier points can be seen in the extremely upper side or extremely down side of the lower limit. In fact, to enhance the
accuracy of the analysis need to identify the outliers in the analysis that has to be eliminated. The central line in the above diagram
shows the Mean value of four different factors. The offers and benefits of the products will have more weightage compared to the
remaining product diversification, customer relationship and market focus.
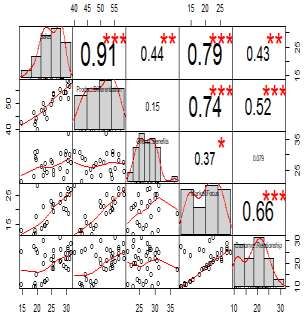
Correlation with Scatterplot: The scatter plot matrix explains about the correlation between the dependent variable and
independent variables followed by the linear/non-linear relationship between the variables. Except the market focus remaining all
other variables have shown the significant (PFigure: 3 Correlation Matrix Plot
Homoscedasticity:-The residual error plot explains about the homoscedasticity and hetroscedasticity existed in the data. The data
has to show homoscedastic relationship among the variables. Which explains about the variance has been equally distributed
among the variables. The straight line and variables which are concentrated in the middle which explains about the variance is
equally distributed among the variables.
Figure 4: Scatter plot Matrix Analysis
Wilki-Shapiro test: The wilki-Shapiro and histogram are the best to test the normality of the data. If data do not follow the
normal distribution it is not possible to conduct the parametric test. The figure 4.3 shows the p-value=0.4942 which is greater than
the standard significant value at 5% level 0.05. Therefore, it can be conclude thatthe data is being followed the normal distribution
and the w=0.96832 which is wilki-Shapiro value.
Figure 5: Normality test
The histogram, Q-Q plot and P-P plots are the best measurements for to estimate the normality of the data. From the below graph
the histogram shows that the data is following the normal distribution. From the wilki-Shapiro value came to know that the p-
value 0.4942 which is greater than the standard significant value at 5% level of significance. Hence, Therefore it can be conclude
that the data is being followed the normal distribution.
Copyrights @Kalahari Journals Vol. 7 No. 1 (January, 2022)
International Journal of Mechanical Engineering
6953Figure 6: Histogram Analysis for Normality test Regression Analysis: The regression analysis explains about the relationship between independent and dependent variables in the analysis. In this case the dependent variable is sales and the independent variables are product differentiation, offers and benefits, customer relationship and market focus. The R-Squared value is 0.8981 which is 89% of variance in the dependent variable sales is being explained by two independent variables and its standardized co-efficient are (p
Figure.7: Error residuals & Q-Q plot

The Q-Q plot explains about data normality. If all the points plotted along with the line, which explains about data is being normal
distribution. As per the above diagram all the values are plotted on the line with slight deviations which explains that the data is
being following the normal distribution. The residual plot also has shown the straight line which explains that data is following the
homoscedasticity rather than hetroscedasticity.The cooks distance value which is
Figure9: Multiple Linear Regression Analysis

Prediction Analysis: - A model has been created with the help of train data and prediction has been done with the test data
weather prediction is happening in right direction or not. The model predicted in such a manner where the actual value is 12.9 and
the predicted value is 11.85 for the fifth observation followed by 10.6 for the actual value and the predicted value is 12.73 for the
tenth observation and 19.07 for predicted value and the actual value is 19 for the 15 th observation and 14.97 of predicted value and
19.0 is the actual observation fir the 20 th observation. Therefore, it can be conclude that the accuracy of the analysis around 80%.
Therefore, the prediction is happening in right direction.
                                               Table10: Actual (Vs) predicted Sales

                                    Predicted
                                      value   11.858062 12.73 19.07 14.97 7.26 7.54

                                     Actual
                                     value         12.9      10.6     19.0    14.6    9.7   10.5

                                  Figure11: Line chart for mapping Prediction (Vs) Actual Sales

The above line graph shows that the predicted line and actual sales almost similar. Therefore, it can be conclude that our
prediction is going on right direction. Even, with the help of current model we can forecast the sales of FMCG with the new data.
From the above graph the blue line is actual sales of the FMCG goods from test dataset whereas the red color line is predicted
sales from actual dataset. Therefore, both train dataset model and test dataset model both are matching, in equal common parlance.
                                                            FINDINGS
1. The 93% of the variance in the dependent variable, the sales of FMCG is being explained by the product differentiation,
offers and benefits, market focus and customer relationship.
2. There is a significant positive correlation among the dependent and independent variables.
Copyrights @Kalahari Journals                                                                       Vol. 7 No. 1 (January, 2022)
                                       International Journal of Mechanical Engineering
                                                             6956
3. All the independent variables like: product differentiation, offers and benefits, market focus and customer relationship have
shown significant relation (.000) with each other.
4. There is no multicollinearity problem in the analysis. That is correlation among the independent variables.
5. The model validated with 90% accuracy. Still the model can be regenerated by adding some other independent variables.
6. No Auto correlation problem in the analysis followed by the data has followed the normal distribution.
CONCLUSION
Therefore, it can be conclude that the factors (product differentiation, market focus, customer relationship, offers and benefits)
have shown the significant relationship with the sales of the fast moving consumer goods in the competitive market. In fact, the
model can be redeveloped for accuracy by adding the other variables. Hence, the predictive analytics model which is multiple
linear regression analysis will give better results to predict the future of the market trend in the competitive market.
REFERENCES
[1] Arvan, M., Fahimnia, B., Reisi, M., Siemen, E. (2018). Integrating Human Judgment into Quantitative Forecasting Methods:
A Review. Omega.
[2] Nagashima, M., Wehrle, F. T., Kerbache, L., Lassagne, M. (2015). Impacts of adaptive collaboration on demand forecasting
accuracy of different product categories throughout the product life cycle. Supply Chain Management, Vol.20 (4), 415-433.
[3] Da Silva, I.D., Moura, M.D.C., Didier Lins, I., López Droguett, E., Braga, E. (2017) Non-Stationary Demand Forecasting
Based on Empirical Mode Decomposition and Support Vector Machines. IEEE Latin America Transactions, 15 (9), art. no.
8015086, 1785-1792.
[4] kabane, G. (2008). Gestão strategic das technologies cognitive: conceitos, methodologies e applications. Saraiva, São Paulo,
[5] Lu C.-J., Shao Y.E. (2012). Forecasting computer products sales by integrating ensemble empirical mode decomposition and
extreme learning machine. Mathematical Problems in Engineering.
[6] Lu, CJ., Chang, CC. (2014). A Hybrid Sales Forecasting Scheme by Combining Independent Component Analysis with K-
Means Clustering and Support Vector Regression. Scientific World Journal.
[7] Good fellow, I., Bengio, Y and Courville, A. (2015). Deep Learning. Cambridge: The MIT Press.
[8] Kandananond, K. (2012). A comparison of various forecasting methods for auto correlated time series, International Journal
of Engineering Business Management.
[9] Wu J., Zheng S. (2015). Forecasting for fast fashion products based on web search data by using OS-ELM algorithm.
Journal of Computational Information Systems, 11(14), 5171-5180.
[10] Chen F.L., Ou T.Y. (2011). Sales forecasting system based on Gray extreme learning machine with Taguchi method in retail
industry. Expert Systems with Applications.
Copyrights @Kalahari Journals Vol. 7 No. 1 (January, 2022)
International Journal of Mechanical Engineering
6957You can also read