Demand Response Baseline Enhancements - February 14, 2022 from 10-12PM
←
→
Page content transcription
If your browser does not render page correctly, please read the page content below
Demand Response Baseline
Enhancements

 February 14, 2022 from 10-12PM

 This web conference is recorded for stakeholder convenience, allowing those who are unable to
 attend to listen to the recordings after the meetings. The recordings will be publically available on
 the ISO web page. The recording, and any related transcriptions, should not be reprinted without
 the ISO’s permission.

 ISO Public
 ISO Public

Agenda

 Time Item Speaker
10:00 – 10:05 Welcome & Introductions Brenda Corona

10:05 – 10:15 Background Jill Powers
 Review and updates to request and
10:15 - 10:45 approval of load adjustment factors Hewayda Ahmed
 outside of min/max caps for 2022
 Update of comparison/control group Adam Scheer
10:45 – 11:30
 methodology (Recurve)
11:30 – 11:45 Final Q&A All

 ISO Public 2

BACKGROUND

 CAISO Public
Background: • Demand response providers (DRPs) expressed concerns that demand response performance was under-valued during 2020 high heat events In response, CAISO proposed tariff compliant options in to address baseline contributing factors in 2021 o Track 1 – Recurve comparison methodology study Produced a report studying the 2020 summer high heat events under a comparison group method for multiple demand response providers in multiple service territories 11/16/2021 – stakeholder call to discuss report and request comments Methodology approved for use o Track 2 – Approved use of load adjustment factors outside of the min/max caps for summer 2021 11/16/2021 – stakeholders informed that option will continue to be available for summer 2022 CAISO Public Page 4

ISO supports three baseline types for DR supply side
 resource performance measurement
1. Control Groups – Establishes baseline of load patterns
 during curtailment event using non-dispatched customers
 with similar profiles
2. Day Matching – Estimates what electricity use would have
 been in absence of DR dispatch, using electricity use data
 on non-event but similar days
3. Weather Matching – Estimates what electricity use would
 have been in absence of dispatch during non-event days
 with most similar weather
 Tariff compliant options available in 2022:
 • Recurve comparison methodology under Control Group type
 • Day and Weather matching baselines use of adjustment factors with
 outside of min/max caps

 CAISO Public
 Page 5

2022 REQUESTS
-REQUEST/APPROVAL TEMPLATE AND PROCESS

 ISO Public Page 6

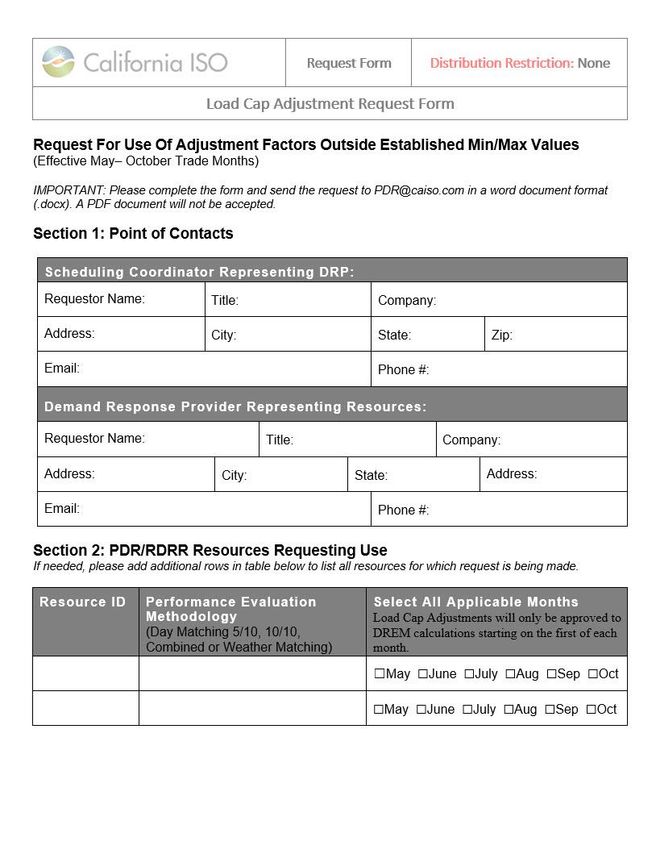
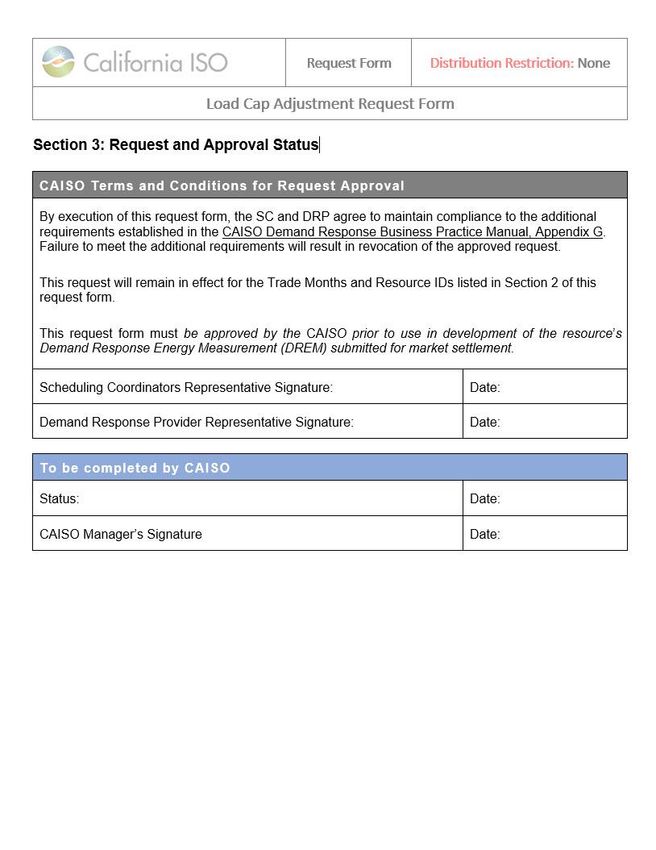
Request Process
• Request Form
 – Visit www.caiso.com – Participate – Demand Response and Load – Proxy
 demand resource agreements information request sheets – Load Cap
 Adjustment Request Form
 • https://www.caiso.com/Documents/LoadCapAdjustmentRequestForm.docx
 – Return completed form to PDR@caiso.com
 – ISO requires 5 Business days to approve
 – Requests received after the first of month will be approved to begin using the
 adjustment for the following Trade Month
 – CAISO will execute the Load Cap Adjustment Request Form through
 DocuSign
 • DocuSign document will be sent to Scheduling Coordinator and Demand
 Response provider for signature

 – NOTE: If you would like to be approved for the May Trade Month, please
 submit your request NO LATER THAN Monday, April 25, 2022

 ISO Public Page 7

ISO Public Page 8

CONDITIONS FOR APPROVAL
- ADDITIONAL DATA SUBMITTAL REQUIREMENTS
 ISO Public Page 9

Additional data submittals required as condition of approval
to allow ISO to evaluate adjustment factors used during May
- October

Additional requirements for DR meter monitoring data submission:

For BASE measurement type:
 1. Provide measurement data for 4 hours before and 4 hours after the hour
 for which a bid is submitted. Currently, submission is required only for the
 hour there is a bid.
 2. Include “Percent Residential” values for the data being submitted.

For CBL measurement type:
 3. Provide data for the day of the DR event in addition to the data being
 provided for 90 days prior.
 4. Include “Percent Residential” values for the data being submitted.

 ISO Public Page 10
Additional data submissions required for monitoring purposes
Additional hours for the BASE and CBL Measurement Types
 Measurement Type Adjusted/Unadjusted Periods Covered
 Current requirement:
 Calculated customer load baseline (CLB) values used to derive DREM.
 BASE data represents the customer load baseline used to calculate the DREM attributed
 Adjusted for to the pure load reduction only.
 intervals where BASE data is submitted for trade dates when the resource/registration is being actively bid
 TEE>0; Unadjusted into the market for the hours in which it is bid.
 BASE for all other hours Approved LPA data requirement:

 In addition to the above BASE data submittal time frames, data will be required for 4 hours
 preceding and 4 hours after a demand response event if they fall outside the hours in
 which the resource/registration is being actively bidding into the market.
 Data Granularity: Hourly

 By resource ID
 Current requirement:

 Underlying load data used in the customer load baseline calculation
 90 days of historical data prior to the day of the event is required.
 CBL N/A
 Approved LPA data requirement:

 Provide data for the day of the DR event in addition to the data being provided for 90 days
 prior.
 Data Granularity: Hourly

 By resource ID

 ISO Public Page 11
Additional data submissions required
Applicable to resource IDs using the Day Matching Combined
performance methodology.
 – Submission of, hour by hour, the percent of BASE (unadjusted baseline)
 and CBL (intra-day load) that is attributed to the residential service
 accounts within the aggregation.
 Measurement Type % Residential Note for both types

 Data Granularity: Hourly

 For resources using the
 BASE % of Calculated customer load baseline (CLB) values used to
 Day Matching Combined
 derive DREM attributed to residential customer load baseline.
 methodology

 Data Granularity: Hourly By resource ID

 CBL % of underlying Load (CBL) for DAY OF Event and 90 days
 historically serving residential customer

 ISO Public Page 12
Additional Data Requirements
• Example:

 ISO Public Page 13
Next Steps
Technical Specifications and Artifacts available:
CAISO Developer > Artifacts > MRI-S > TechSpecs > MRI-S Interface
Specification version 2.7:
https://developerint.oa.caiso.com/Artifacts/MRI-S/TechSpecs/MRI-S Interface Specification v2.7.pdf

• Please submit questions through our Customer
 Information & Dispute Inquiry (CIDI) ticket process

 ISO Public Page 14
MID-QUESTIONS/COMMENTS

 CAISO Public
 Page 15
RECURVE STUDY OVERVIEW
AND UPDATE
 ISO Public
FLEXmeter Methods Review
 Adam Scheer
 Vice President of Applied Data Science
 adam@recurve.com

 Joe Glass, Steve Suffian, Carmen Best
History
COVID-19 altered energy consumption in every area
of society and the economy.

Crisis for EE program M&V

Hourly Comparison group
method development was
critical
Recurve/DOE Partnership: Comparison Groups For the
COVID Era and Beyond

 Resulting Methods:
 - Random Sampling
 - Advanced Stratified Sampling
 - Site-based matching

 https://groups.recurve.com/methods.html
Test Case: August 14th 2020 Outage Event
 Aug 14, 7 pm: Demand Spikes,
 Rotating Power Outages
 - Emergency grid event

 - > $1,000/MWh real time prices
 across the grid
 - “All Hands on Deck” DR Events

 Standard DR methods did not
 sufficiently capture event impacts

 20
DR Study Origins: MCE / NREL / RECURVE Event Analysis

Pilot Deployment of Differential Privacy

● Analysis of OhmConnect’s response in MCE
 territory

● DR Event 5 - 8 PM

● Sample of 1,150 MCE Res participants

● Non-participant Comparison group

● GRIDmeter advanced stratified
 sampling/CalTRACK 2.0 Hourly methods
 21
Comparison Groups for Demand Response

 Event
 Savings
 Participants ● Approved in CAISO Tariff

 ● Often considered a best practice

 Comparison
 ● Have only rarely been deployed
 (e.g., COVID
 Impacts)
CAISO Key Objectives

 1. Understand and operationalize the baseline and
 comparison group methods in relation to existing
 guidance and practice

 1. Identify barriers to data access and viable paths to
 overcome them

 1. Better understand the 2020 heat storm events

 1. Measure impacts of demand response events
 through methods operationalized at scale.
Data Makes the World Go ‘Round

 Data Donors

 6 DRPs
 6+ LSEs

 - Res and Non-Res - Solar and Non-Solar
 - 11 Distinct Climate Zones - Variety of Programs
FLEXmeter
 Foundations
Open-Source, Standardized Methods

 Advantages of Open Source
 - Full transparency
 - Consistency and Verifiability
 - Concrete settlement
 - Leverage community of experts
 - Focus on program, not M&V
Methods Overview

FLEXmeter Load Impacts Calculation:
 1. Sample matched comparison group
 2. Calculate treatment and comparison group hourly load impacts
 3. % Difference of Differences adjustments

 4. Differential privacy to protect non-participant data
How Do Comparison Groups Work Again?
The “Difference of Differences” Calculation
 Savings
 ● Step 1: Measure change in consumption for
 program participants

 Savings
(“Difference_Treatment”)

 ● Step 2: Measure change in consumption for
 selected non-participants

(“Difference_Comparison”) Treatment

 Comparison
 ● Step 3: Calculate savings as:

Savings = Difference_Treatment - Difference_Comparison 28
FLEXmeter Comparison Group Selection:

Site Based Matching

Treatment and comparison customers must share:
 - Sector
 - LSE Territory
 - Climate Zone
 - Solar Status

Basis for equivalence: Avg. weekly load shape

Each participant meter is matched to the most similar
non-participant meters

Comparison group: the collection of non-participants
that are best matches to individual participants
FLEXmeter Comparison Group Selection:

Matching load
characteristics across
the entire range of
participating customers
% Diff of Diff Example (DRP B, LSE 2, Aug. 19, 2020)

Step 1. Treatment % Diff Event % Diff
 = -28.7%

 Treatment customers used 28.7% less than predicted during event.
% Diff of Diff Example

Step 2. Comparison % Diff
 Event % Diff
 = 5.1%

 Comparison customers used 5.1% more than predicted during event.
% Diff of Diff Example

Step 3. % Diff of Diff
 Event % Diff of Diff
 = -33.8%

 Taking the comparison group into account the demand response
 event had a -28.7% - 5.1% = -33.8% event period load impact.
% Diff of Diff Example

Step 4. Total Savings
 Avg. Event Load Impact
 = -0.94 kW

 Scaling the % Diff of Diff to predicted participant consumption yields
 average customer event load impacts of -0.94 kW.
Bringing it All Together

One graph to rule the
world
The “Adjusted Counterfactual”

Condenses % Diff of
Diff components into a
few steps

Adjusted Counterfactual
= best prediction of
usage absent the event
Differential Privacy
- Calibrated noise
 addition

- Masks the presence of
 individuals in datasets

- Much stronger
 protection than
 traditional aggregation
 methods
Event Day: Comprehensive Results

FLEXmeter enables measurement of
load impacts all hours of the day.

- Total savings determined (both
 event and non-event)
- Can directly monitor “takeback”
Takeback: Common but Varies By Program

For most (but not all) programs
Recurve observes takeback.
Takeback and 10 of 10 Baselines with SDA

 DRP D, LSE 1, Non-Res
For most (but not all)
programs Recurve
observes takeback.

Takeback can bias
baselines with Same Day
Adjustments

 Takeback during
 non-event hours
Takeback and 10 of 10 Baselines with SDA

 DRP D, LSE 1, Non-Res
For most (but not all)
programs Recurve
observes takeback.

Takeback can bias
baselines with Same Day
Adjustments

 Savings during
 non-event hours
Summary Results
FLEXmeter Summary Results

Wide variety of programs,
territories and results, and...

Apples to apples comparisons
across the board
Standardization and Reliable Measurement: Data Specification
Error and Uncertainty
Error Analysis (DRP B, LSE 2 Dummy Events)

Model error falls within 0.008
kWh ± 0.006 kWh at the 95%
confidence level.
Monte Carlo Analysis (DRP D, LSE 1, Residential, 8/15/2020)

Experiment:
 - Randomly split participants
 into 2 equal sized samples
 - Calculate Sample 1 % Event
 Savings
 - Calculate Sample 2 % Event
 Savings based on growing
 random samples
 - Calculate difference between
 Sample 1 and Sample 2 %
 Event savings at every step
 - Repeat analysis 100 times
FINAL QUESTIONS/COMMENTS
Stakeholder written comments on today’s
discussion are encouraged, and may be sent to isostakeholders@caiso.com

 CAISO Public
 Page 49
You can also read