4D VISUAL ANALYTICS AND DATA INTEGRATION WITH COVIZ 4D
←
→
Page content transcription
If your browser does not render page correctly, please read the page content below
COVIZ 4D PRODUCT SHEET
4D Visual Analytics and
Data Integration with CoViz 4D
Dynamic Graphics' 4D Quantitative Visualization Technology
CoViz® 4D leads the industry in providing
dynamic visual analytics for reservoir surveillance
and management. Understanding the changing
response of a reservoir over time is critical for op-
timizing production and development decisions.
CoViz 4D makes it possible for multi-disciplinary
users to simultaneously view and interrogate
datasets from throughout the asset development
team—regardless of the original data source.
Understanding through data fusion—powerful in
3D—increases enormously when used in 4D: The
unique temporal functionality in CoViz 4D allows
you to visualize how development decisions af-
fect your reservoir.
Integration of multi-disciplinary data, including reservoir simulation, 4D seismic, seis-
mic attribute extractions, structure model, and production data
True 4D Data Integration
CoViz 4D makes it possible for customers to
simultaneously view and interrogate multiple
time variant data and displays. Possible inputs
include 4D seismic volumes and attributes,
reservoir simulation, fluid production, well events
and real-time drilling feeds, production tests,
microseismic and monitoring data, time sensitive
remote sensing imagery, and other time rel-
evant data critical to the asset team. Utilities are
included for data to be evaluated simultaneously
in time snapshots or time sequence animations.
Real-time 4D data fusion on the desktop is finally
a reality.
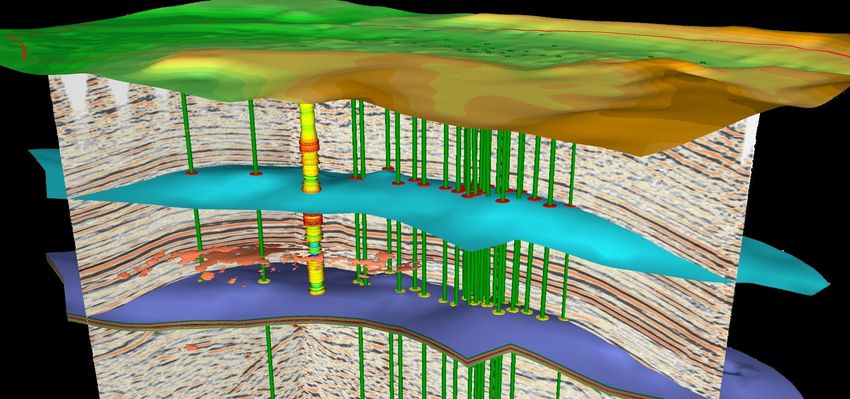
Core photos and completion diagrams are among many types of data which are easily
linked to the 3D/4D visualization environment. Data used with permission of owner.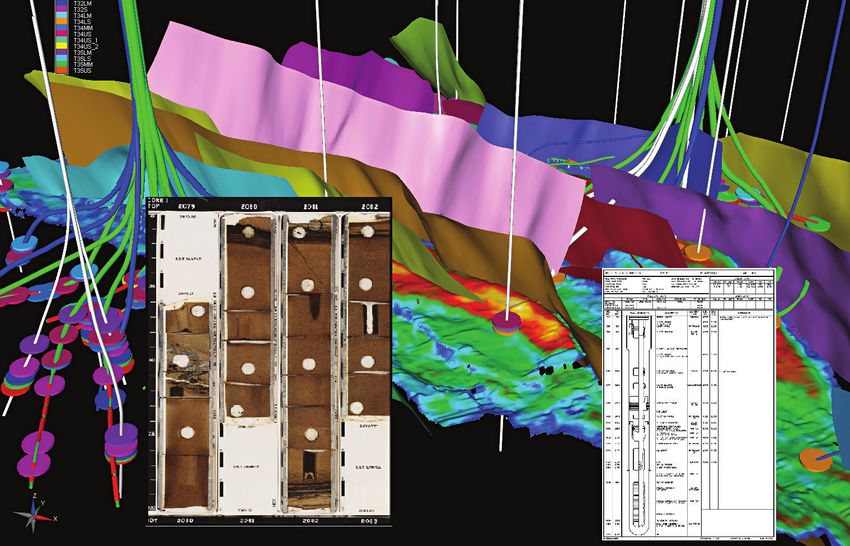
About Dynamic Graphics, Inc.
Software Solutions Since 1969
Dynamic Graphics,® Inc. provides world class
solutions for spatial analysis problems in the
petroleum, environmental, and earth-related
sciences. Over the past four decades, we have
been the premier provider of geospatial
answers with our innovative, easy-to-use
software and outstanding support services.
We offer three separate software packages:
CoViz® 4D, WellArchitect®, and EarthVision®.
Each can be a standalone product, serving a
different purpose in the hydrocarbon develop-
ment or environmental analysis workflow.
However, when used in conjunction, they
provide a collaborative multidisciplinary
environment that offers dramatic synergies.
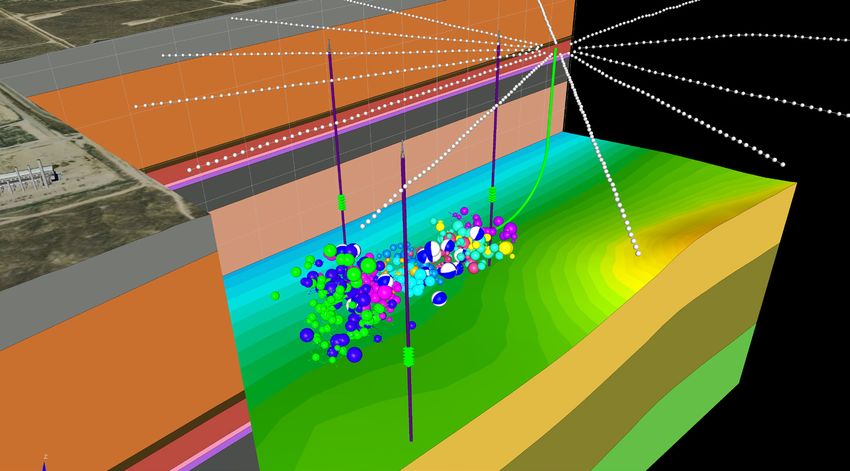
Hydraulic fracturing is monitored using microseismic data. Event locations, error bars, and focal
mechanisms are visualized in 4D in relation to the surrounding geologic model, well locations,
and surface infrastructure. Treatment curves are also integrated into the display.
All of our software products are designed
to meet clients’ practical application needs,
industry standards, and our own stringent
quality-control requirements. We provide a
complete spectrum of regularly scheduled and
customized training courses prepared by our
The large onshore dataset from Teapot Dome Wyoming visualized using CoViz 4D. Data cour-
full-time educational services staff. Once our tesy of RMOTC and the U.S. Department of Energy.
products are in use at a client site, our experi-
enced technical support personnel are available
to offer their expertise and unparalleled levels
of support.
Dynamic Graphics is committed to responding
to the challenges our clients face in their day-
to-day work. We know that the continued
success of our company depends upon develop-
ing innovative, dependable, easy-to-use soft-
ware, while offering strategic support services
that help our clients solve their demanding,
time-sensitive problems. The quality of our ser-
vice is the key to our past success: let us show
you how we can turn that into success
for your company!
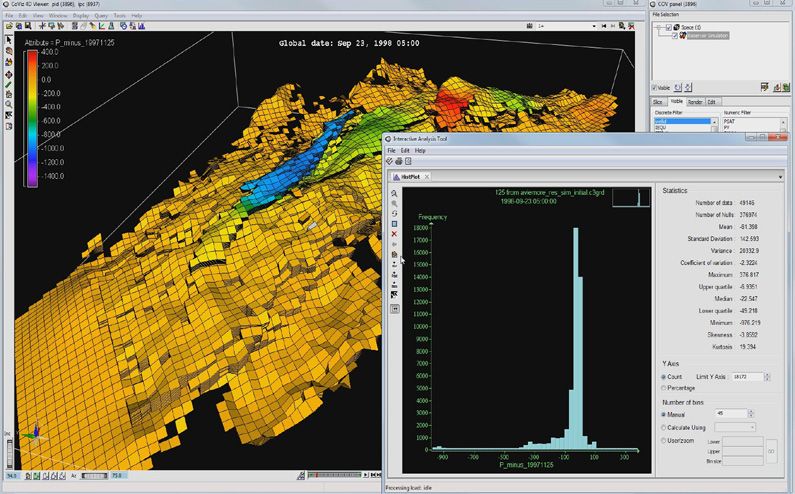
Seismic amplitude values are sampled into both a reservoir simulation grid and well log data,
enabling statistical analysis and comparison of diverse datasets.
DYNAMIC GRAPHICS SOFTWARE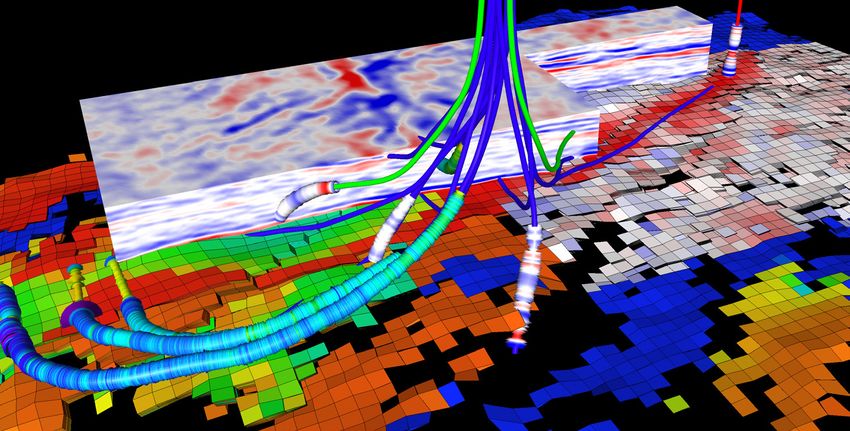
COVIZ 4D PRODUCT SHEET
Spend Your Time Hunting for Opportunity—Not For Data
Multidisciplinary teams are made up of experts
armed with many tools to advance their under-
standing within their realm of expertise. Even with
the evolution of greater centralized storage and
networking of data and information, no individual
in an asset team has complete knowledge of the
location, identity, or purpose of all of the informa-
tion that is vital and available to the team. Much of
these disparate data are processed within a variety
of software applications provided by multiple
vendors and operated by multidisciplinary users
with unique expertise. CoViz 4D provides a means
for teams and individuals to access information
simultaneously from many sources and applica-
tions in a flexible viewing environment without the
need for specific knowledge of where the infor-
mation is stored, or how to run the software that
generated the information. Data and information to
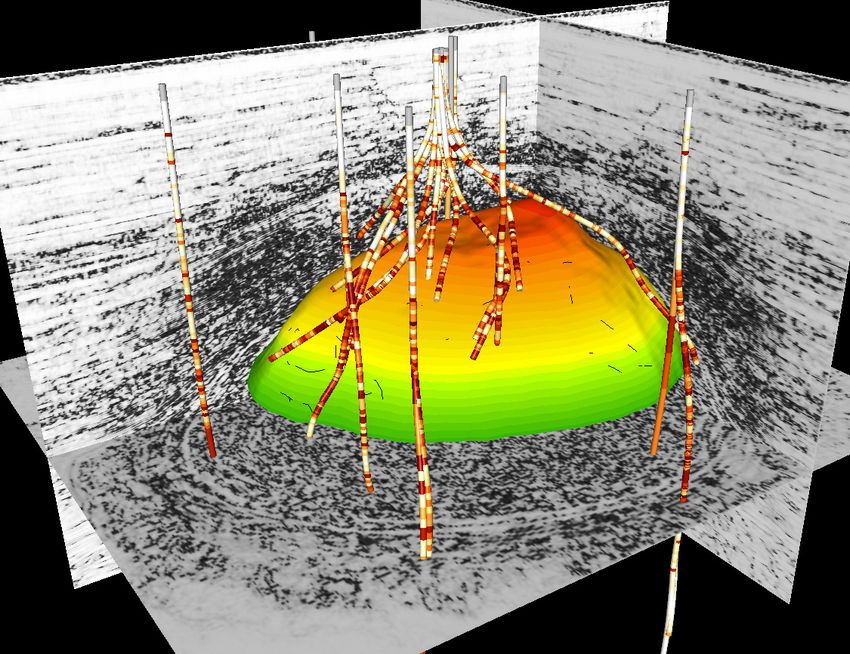
A seismic discontinuity attribute ("coherency cube") from around a North Sea Salt be included become a function of team needs, not
dome (in color) has been back-interpolated into the well data. This would allow, for
example, the direct comparison of fault/fracture information from the seismic attribute limited by user’s expertise: critical surface informa-
with similar information recorded in image/well logs. tion can be united with subsurface drilling; geologi-
cal, petrophysical and reservoir data are visualized
“Every CoViz 4D enhancement is focused on helping clients use with maps, models, and displays of related tabular,
their data to make better decisions. We firmly believe that seeing graphical, and text resources.
data in context is necessary to fully understand what your data are
telling you. We love hearing about successful drilling decisions that
could not have been made without the analysis and understanding
that CoViz 4D allows.”
Integrated 2D-3D-4D Visualization
for Collaborative Team Sessions and
for the Individual’s Desktop
This technology was first envisioned to empower teams
in a collaborative environment for processes such as
exploration planning, exploitation evaluation, and res-
ervoir surveillance. Now Dynamic Graphics is bringing
these same capabilities to the desktop so that team
members can have broad data fusion capability at all
times. With greater access to vital information from the
desktop or in collaborative meetings, Dynamic Graph-
ics’ customers are positioned to make better and faster
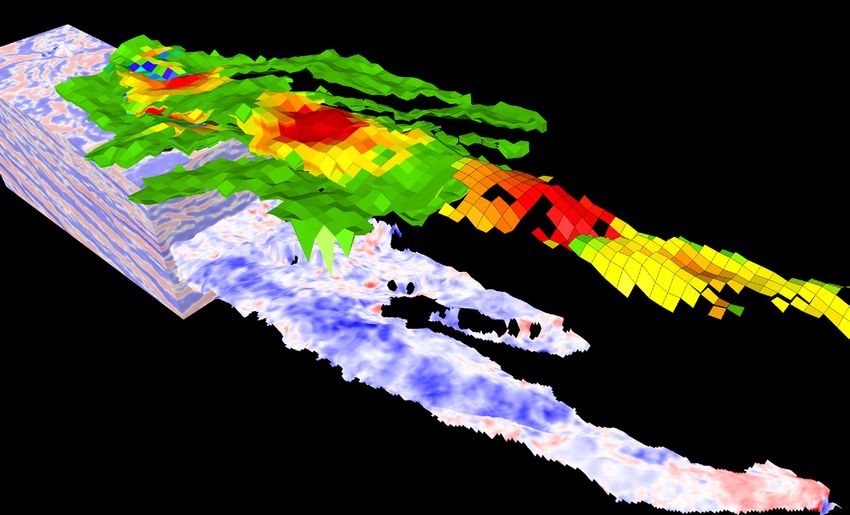
decisions in order to seize opportunities and accelerate Comparable seismic and cellular extractions and averages computed across a turbi-
dite channel offshore Northwest Europe.
returns from efforts and investments.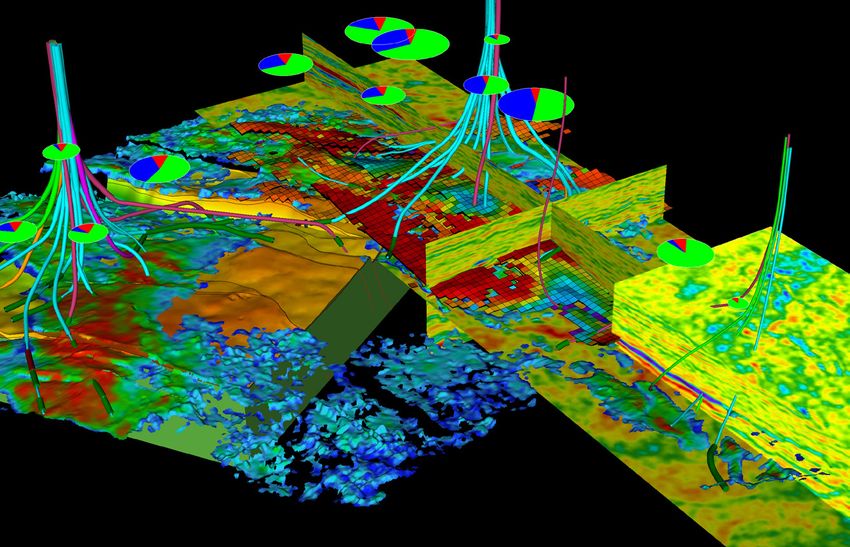
HEADQUARTERS
Dynamic Graphics, Inc.
1015 Atlantic Avenue
Alameda, CA 94501-1154
Phone 510.522.0700
www.dgi.com
info@dgi.com
OFFICES & REPRESENTATIVES
Aberdeen Scotland, UK
aberdeen@dgi.com
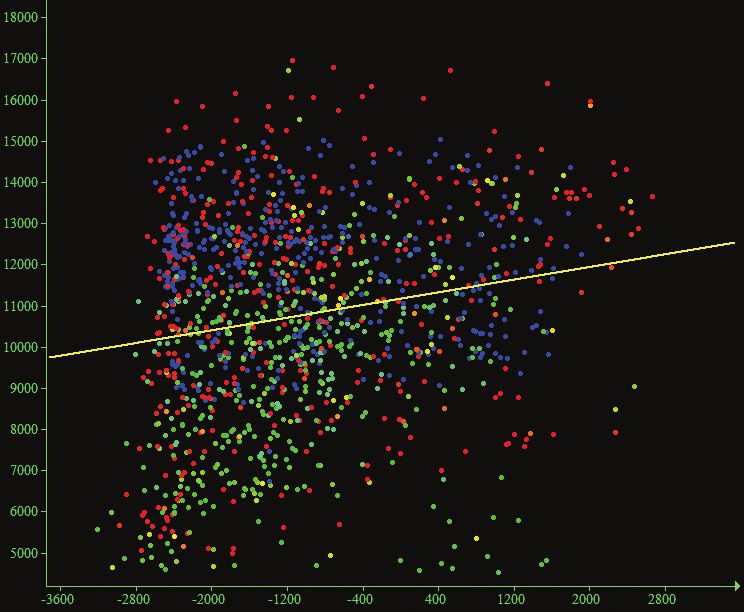
Houston, Texas USA In this image, a seismic inversion (Elastic Impedance) is
gulfcoast@dgi.com being qualitatively compared to a calculated synthetic
impedance volume of the same extents. The input PEM
Washington, DC USA cell model is also shown. The cross plot displays the
dgidc@dgi.com observed and synthetic seismic values extracted on a
horizon approximately at the top of the PEM cellular grid.
LEGAL NOTICE
© 2016 Dynamic Graphics, Inc. All Rights Reserved.
Quantitative Visualization and Seismic History Matches
No part of this publication may be reproduced, translated,
or transmitted in any form or by any means, electronic
or mechanical, including photocopying, recording, use or In addition to clear strengths as a team physics parameters via Gassmann
capture in any information storage or retrieval system, or
otherwise, without the express prior written permission of visualization tool, CoViz 4D is also the substitution (Sim2Pem)
Dynamic Graphics, Inc.
premiere environment for integrated • Calculation of 4D synthetic seismic data
The information contained in this document is subject
to change without notice and should not be taken as a
4D visual analytics. from a petroelastic model (Pem2Seis)
commitment, representation, or warranty on the part of
Dynamic Graphics, Inc. Further, Dynamic Graphics, Inc.
CoViz 4D includes significant features for • Rapid, first-order screening of
assumes no responsibility for errors that may appear in the rapid, integrated, quantitative analysis overburden deformation and time-shifts,
this document.
and statistical comparison of diverse 3D based on reservoir compaction
Dynamic Graphics, CoViz, and the logo(s) shown below (4D Geomechanics)
are trademarks of Dynamic Graphics, Inc. that are and 4D data sets. In particular, this includes
registered trademarks or the subject of pending the generation of synthetic 4D seismic • Time-step arithmetic operations (rapid
applications in various countries.
volumes from rock physics inputs, calculations of differences over time)
(Sim2Seis workflow), the calculation of • Interactive tools for property averages
displacement, strain and seismic time-shifts and attribute extractions in seismic space
All other trademarks belong to their respective owners. in the overburden due to thickness change and cellular space
rev.02152016.
in the reservoir (4D Geomechanics work- • Back-interpolations of property values
flow), and the quantitative analysis of 4D between spatially and temporally over-
seismic data within a multidisciplinary data lapping data
fusion environment. • Statistical analysis and cross-plotting of
diverse data types with interactive links
Specific functionality, available to users
back into the 3D/4D viewing space
interactively from the viewing environment,
includes: • Multiple output options to capture and
export the results of the quantitative
• Rapid time-to-depth, and depth-to-time, analysis
conversions of data sets
• Available well planning module for easy-
• Creation of petroelastic models from rock to-use well design in a data-rich environ-
ment (CVIWD)
DYNAMIC GRAPHICS SOFTWARE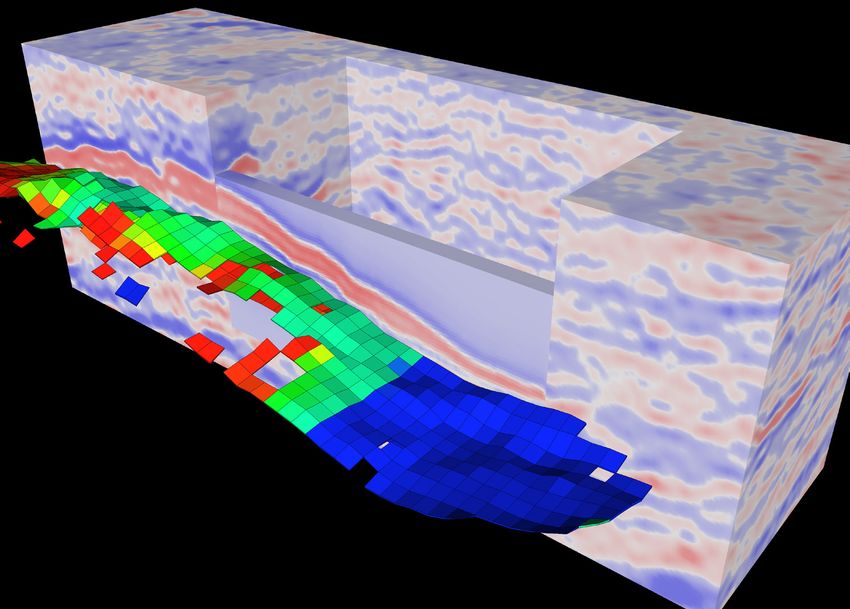
You can also read