Market update - First Financial Bank
←
→
Page content transcription
If your browser does not render page correctly, please read the page content below
market update
August 2021
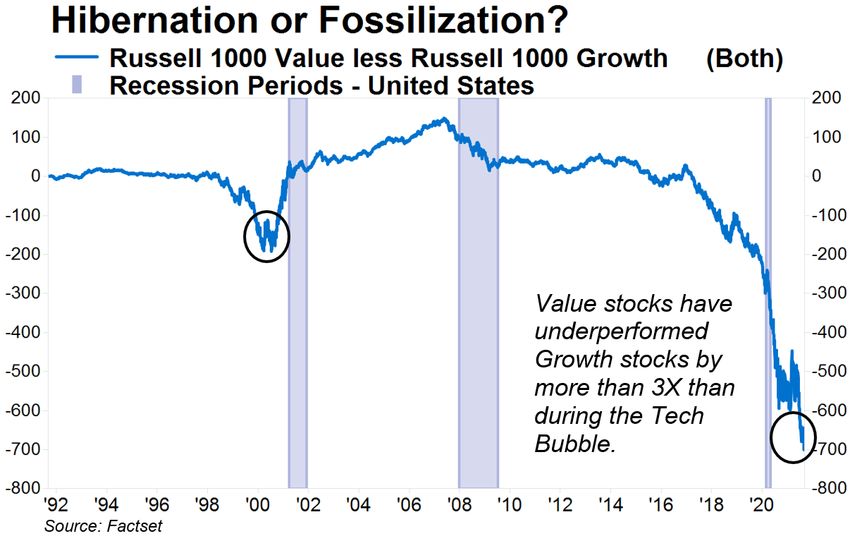
Hibernation or Fossilization?
“More money has been lost because of four words than at the point of a gun. Those words are
this time is different.” – Reinhart & Rogoff (This Time is Different - 2009)
The Twilight Zone was a TV series created by Rod Serling that ran for five seasons from 1959-
64. Known for its science fiction tales and unexpected twists, this black and white series was so
popular that it was brought back in various capacities over a span of five decades. If you’ve seen
any episodes, the entertainment value is rooted in the unusual world that is often portrayed.
More and more recently, the market environment is feeling a little Twilight Zone-esque as
evidenced by these recent observations (at the time of this writing):
• The top five largest market capitalized companies in the US (which include AAPL, MSFT,
GOOGL, AMZN, FB) sum to the equivalent of more than 40% of the ENTIRE US economy
(as measured by nominal US GDP).
• Tesla (TSLA), the electric car manufacturer, has a market cap greater than Toyota,
Volkswagen, Daimler, GM, Ford, Honda and Hyundai…COMBINED.
• Coinbase (COIN), a cryptocurrency exchange platform, has a market cap that is more than
double that of the Nasdaq exchange that its stock trades on.
• In a recent article on CNBC, a 12-year-old made almost $400,000 in two months coding
and selling NFT’s (non-fungible tokens) paid in Ethereum – another cryptocurrency.
• The number of SPACS (Special Purpose Acquisition Companies), so called blank check
entities that raise capital with as much as two years in advance of making ANY
investment, have already increased by almost 70% more than ALL of last year –
representing $123 billion in funding. One of the most notable registered earlier this year
was LMF Acquisition Opportunities – listed under the symbol LMAO.
We can’t make this stuff up…strange ruminations indeed.
While these stories may seem random, we would suggest they’re more related than not.
Investors seem to be distinguishing between old world and new world stocks to an increasing
extreme (think Innovator and Disruptor and/or MEME stocks). This isn’t to suggest that some of
the companies above don’t have tremendously successful products and business models.
However, we think it’s important to recognize that great companies may not always make great
stocks if underlying growth assumptions have been pushed to overly optimistic levels. We also
think it’s not coincidental that the culmination of these events is happening during a period of
record setting liquidity and extraordinarily low interest rates.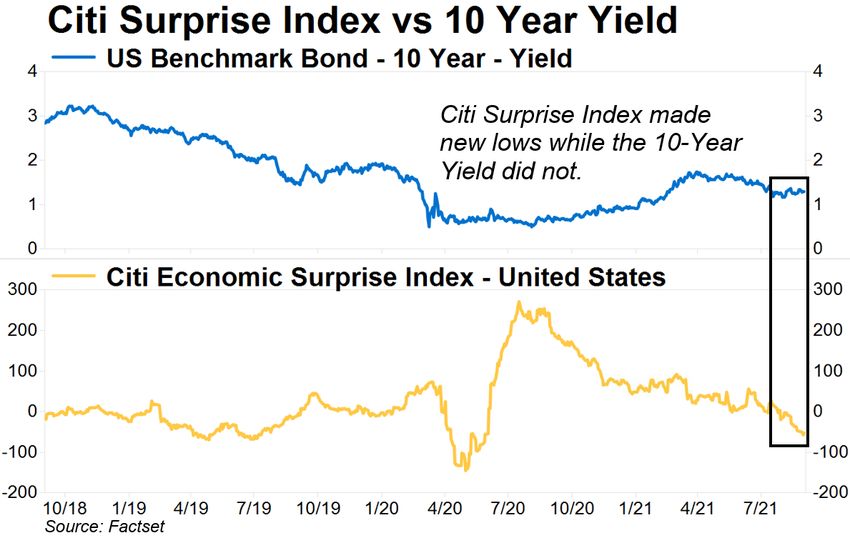
market update
                                                                                        August 2021

A lot of the previously mentioned stocks fall into the Growth category and are represented by
high Price to Earnings valuations making their terminal growth rates very sensitive to interest
rate changes. To that point, according to Factset, the S&P 500 Growth index sports a P/E ratio
of 29 times forward earnings (52% above the 10-year average) compared to the S&P 500 Value
index of 16 (15% above the 10-year average). That gap of 13 multiple points compares to a
difference of only 2 a decade ago. With rates at exceptionally low levels, expensive Growth
stocks have flourished but should rates rise – as we’ve previously evidenced by a higher growth
and inflation backdrop – caution might be warranted for that group.

As can be seen in the chart below, the cumulative performance of value stocks relative to growth
stocks consolidated
late last year into early
this year but recently
took     another      leg
lower. Currently, the
performance
differential is now
more than THREE
TIMES greater than
that         witnessed
during      the     ‘90’s
decade – concluding
with the 2000 Tech
bubble.

Are value stocks hibernating after a LONG winter lull or have they gone the way of the
dinosaur – fossilized in time? In other words – dare we say – “is this time different”? We’re
not convinced the answer is yes. That doesn’t mean that some of these technologies won’t be
life changing. It simply may suggest that some of the growth stocks leveraged to these themes
may have valuations that reflect better-than-best-case scenarios. Hardware and software
companies in the ‘90’s introduced computing technologies that absolutely changed our lives. But,
with hindsight, we often joke that stock valuations back then not only reflected the assumption
that there’d be a PC in every home and office on earth, but also on every planet of the universe
as well.
market update
                                                                                         August 2021

While some market trends reversed over the past several months, full year returns have generally
still indicated a reflationary bias. Real Assets outperformed Stocks and Stocks outperformed
Bonds. Commodities, Real Estate, and Cyclical sectors did the best while interest rate sensitive
Bonds suffered the most.

Stocks

Global equities posted
mixed returns so far in the
third quarter amid still
mostly strong year-to-
date totals. Of late, a
more defensive market
posture has been evident
with profit taking in the
more cyclical areas like
Small Caps (Russell 2000) and Emerging Markets (MSCI EM). A combination of COVID
resurgence along with inflationary pressures dampened consumer sentiment. Policywise, Fed
tapering remains on the horizon while fiscal spend continues to advance in Congress. At the
same time, corporate profit growth (albeit likely peaking) has remained exceptionally robust. For
the year, S&P 500 sectors have reflected an investor preference for Cyclical exposure with
outperformance in Energy and Financials (Cyclical Value) as well as Communication Services and
Tech (Cyclical Growth). Conversely, more traditional Defensives (Health Care, Utilities) were
positive but lagged – though this started to reverse quarter-to-date as yields backed down and
these sectors outperformed.
market update
August 2021
Bonds
Bond returns were mostly negative year-to-date. Long-term interest rates started to trend
higher last August with the pace picking up in the first quarter only to consolidate over the past
several months. Meanwhile, short-term rates remained mostly anchored by the Fed – resulting
in a Yield Curve that steepened in the first quarter to its highest level in over 5 years – only to
retrace about 40% of that move since then. Year-to-date, the more interest rate sensitive areas
of the bond market saw their returns pressured the most – including long-duration Treasuries
(Govt Tsy Long) – though that reversed quarter-to-date. A stronger dollar also pressured
International Fixed Income (Global Agg ex US). Meanwhile, securities with shorter durations and
more sensitivity to equities outperformed, including Securitized Assets (ABS, MBS, CMBS) as
well as Investment Grade and High Yield corporate bonds along with Emerging Market Debt
(EMBI).
Alternatives
Alternatives posted mostly
strong returns quarter-to-
date and for the year.
Treasury inflation protected
securities (TIPS) were held
back by the rise in long-term
interest rates though
outperformed nominal
Treasuries given increased
inflation expectations. Both
publicly traded real estate (REIT’s) and Commodities generated among the best results for the
year. The former has been viewed as an attractive reopening opportunity though with some
defensive yield characteristics. The latter has benefited from rising Energy, Industrial Metals and
Agriculture prices (Industrial Metal and Energy prices remained solid quarter-to-date).market update
August 2021
Market Outlook
Coming into this year, our business cycle outlook has continued to be best defined by the
phrase “From Red Lights to Green Lights”. Having a medical solution to the medical problem
is ushering in an economic
reopening. This, combined
with record levels of
stimulus, is expected to
generate sizeable GDP
and earnings growth in
2021 (see table at right).
From an investment
perspective, we’ve been
believers in the “Reflation
Reset” theme, whereby nominal growth improves from a combination of rising real growth
and inflation. A federal budget deficit today that only rivals that of World War II, along with de-
globalization trends, and the Fed’s FAIT (Flexible Average Inflation Target) policy are all structural
reasons to support this theme. Similarly, the widening disconnects between the 10 Year
Treasury Yield and the Consumer Inflation index (widest since 1990) as well as nominal GDP
growth (widest on record since the early ‘50’s) suggest these gaps are not sustainable. We
continue to believe that the transitory portion of inflation moderates from here, but still
normalizes back to structurally higher levels than what we’ve seen in the recent past. The
chart below is a
good illustration
of how the
inflation dynamic
could play out as
described above.
The PCE index is
the Fed’s
preferred
inflationary
gauge which
incorporates the
Fed’s inflationary
forecasts out
through 2023.market update
August 2021
In short, pre-pandemic inflationary levels might be noticeably lower than post-pandemic
inflationary levels. Furthermore, should wage inflation remain elevated – and even accelerate
from here – structural inflation tendencies might become more embedded especially if
investors are surprised by a tighter labor market than previously thought.
Up to now, longer-term rates have been more sensitive to factors other than inflation,
including a stronger dollar, COVID case resurgence, moderating economic data and a Fed that
now owns about a quarter of the ENTIRE Treasury market. Might longer-term rates start
incorporating a changing view if some of the above factors change? While COVID case counts
due to the delta variant remain troublesome, the data is starting to suggest that positivity rates
are peaking in US hot spots (South). Meanwhile, the FDA granting full approval for the Pfizer
vaccine could spur
further vaccination
uptakes. More
recent Fed
commentary has
made it clear that
policymakers are
likely to begin
tapering (reducing
Treasury and
Mortgage bond
purchases) late this
year or early next
year – lessening
some of the
artificial influence
as noted above. Finally, the Citigroup Economic Surprise index, an indicator that measures the
degree to which economic data is beating or missing expectations, is now at a low historical level
(moving from the 10th decile last year to the 2nd decile currently – relative to history dating back
to 2003). As can be seen in the chart above, this index has recently made a new low while the
10 Year Treasury Yield has not. In other words, the rates market might be suggesting that
economic expectations have now been sufficiently reset enough for the economic data to begin
surprising to the upside.
The confluence of these events may be enough to price in a higher rate dynamic, which would
benefit relationary pockets of the market – cyclicality within equities, shorter duration within
bonds and real assets within alternatives. All of these areas have been tactical points of
emphasis in client portfolio positioning.market update
August 2021
At the same time, we want to be cogznizant of risk and recognize that investors may not want
to be as aggressive in positioning as they were to begin the year – for the following reasons:
• Year Two of a cyclical bull market has historically ushered in more volatility (albeit positive
returns). Through the first five months of Year Two, we’ve seen comparable historical
FULL year returns without much of the volatility.
• As we get closer to the end of the year, corporate profit growth is likely to slow. While
this is not a major negative for market returns, in aggregate, it does tend to signal a
rotation under the surface – having implications for sectors and risk factors.
• Stock valuations are elevated in an absolute sense and may becoming more so in a
relative sense. The equity risk premium may look less favorable if rates rise.
• Policy conditions are likely to be less favorable over the next 12 months than over the
past 12 months (less liquidity and more potential headwinds for corporate earnings).
In short, we advocate maintaining a reflationary tilt in one’s portfolio while managing the
degree of that tilt.
Consistent with the above, we remain deliberate in emphasizing a reflationary bias in client
portfolios while also controlling overall portfolio risk. Accordingly, several times this year we’ve
trimmed some of our OW to risk assets (via Equities) while bolstering our inflationary hedges
(Real Assets including Real Estate and Commodities) and maintaining diversification with lower
volatility assets (via US Core Fixed Income and Diversified Alternatives).
Within equities, our OW’s continue to favor a pro-reflation bias. Previously, we’ve increased our
exposure to a modest OW in International Markets. We’ve also previously increased our US
Small Cap exposure to an OW and have shifted toward more of a cyclical value sector tilt within
our (UW) US Large Cap exposure (though recently have shifted some of that value tilt toward
higher quality companies).
Within fixed income, to mitigate some portfolio risk, we remain UW the most cyclical parts of
the bond market (High Yield and Emerging Market Debt) but our US Core managers are OW
investment grade credit and UW (defensive) treasuries. We also continue to carry a shorter
duration bias (less interest rate sensitivity). Our US Core Fixed Income exposure remains an OW
supplemented by our UW position in International Fixed Income which remains a beneficiary of
a weaker dollar environment.
Within alternatives, we previously have added to real assets as a way to bolster inflationary
hedges. As such, we are OW to Real Estate and Commodities. Rounding out our exposure,
we’re also OW to Diversified Alternatives which provide some hedge against market volatility.market update
August 2021
The information presented in the material is general in nature, should not be considered investment advice, and is not
designed to address your investment objectives, financial situation or particular needs. Information contained herein has been
obtained from sources deemed reliable, but we do not guarantee its accuracy or completeness. The opinions expressed
herein may not actually come to pass, are as of the date of publication and are subject to change at any time based on market,
economic or other conditions.
You cannot directly invest in an index. Indexes are unmanaged and measure the changes in market conditions based on the
average performance of the securities that make up the index. Performance results reflected do not include fees or other
charges which impact an individual investor’s returns. Investing in small and mid-cap stocks generally involves greater risks,
and therefore, may not be appropriate for every investor. Alternative investments involve specific risks that may be greater
than those associated with traditional investments. Asset allocation and diversification does not ensure a profit or protect
against a loss.
First Financial Wealth Management, a division of First Financial Bank, provides investment advisory, wealth management and
fiduciary services. First Financial Wealth Management does not provide legal, tax or accounting advice. The products and
services made available by First Financial Wealth Management:
Are not deposits Are Not FDIC Insured Have No Bank or Federal Government May Lose Value
GuaranteeYou can also read