Greece and Your Portfolio, Again - Rockwood Wealth ...
←
→
Page content transcription
If your browser does not render page correctly, please read the page content below

Quarterly Perspective: July 2015

Greece and Your Portfolio, Again …

The Greeks are at it again – grabbing                 Given that there will always be uncertainty,
international headlines for the ongoing fiscal        here’s what you need to know.
challenges they must collectively meet as a
nation. The good news is that their plight is         To reinforce what we’ve communicated in the
unlikely to affect your portfolio for any             past, we have zero exposure to Greek
meaningful time period. We need only look back        government debt, as Greece is not eligible for
to 2010 to see that an even scarier Greek crisis      our fixed‐income strategies. Our exposure to
was only short‐lived.                                 Greek equities is less than 1/1000th of your
                                                      equity allocation, and we have suspended
Since Greece’s debt crisis began in 2010, most        further purchases in that country since 2011.
international banks and foreign investors have        Long‐term investment success requires one to
sold their Greek bonds and other holdings, so         benefit from uncertainty in the form of
they are less vulnerable to what happens in           participating in recoveries from events that do
Greece. (Some private speculators who                 not have clearly evident solutions.
subsequently plowed back into Greek bonds,
betting on a comeback, regret that decision.)         The popular press or those who are transaction‐
                                                      based market makers might be tempting you to
And in the meantime, the other crisis countries       react to current events by buying and selling, or
in the eurozone, like Portugal, Ireland, and Spain,   otherwise shifting around in reaction to the
have taken steps to overhaul their economies          winds of change. They may be well‐versed in
and are much less vulnerable to market                market economics, with impressive scholarly
contagion than they were a few years ago.             credentials and seemingly conclusive reasons for
What’s more, the European Central Bank has            why it’s time to act now. However, it’s not good
erected powerful firewalls by buying huge             or bad news that sets future market pricing; it’s
amounts of eurozone government bonds and by           whether the news is better or worse than the
promising to purchase more if needed, making          market has been expecting.
governments less subject to market whims.
                                                      Like you, we do not know precisely what the
                                                      future holds. But we do know that markets
                                                      incorporate all known information and that the
                                                      widespread anxieties are already reflected in
                                                      today’s prices. Put simply, all the bad news we’ve
                                                      collectively heard is already baked into the
                                                      current market prices.

                                                      Ill‐advised investors who say foolish things like
                                                      “It’s getting bad in Greece, so I am thinking about
                                                      selling my investments” are really saying “I am
Still, Greece may be linked to the world financial    unaware that today’s prices are already inclusive
system in ways that may not be evident unless         of the collective market sentiment and that
the unlikely scenario plays out where it actually     future price changes only reflect those events
defaults on its debts or its banks collapse. So       that haven’t yet happened, not some
there is still potential for unpredictable            extrapolation of recent events.”
consequences.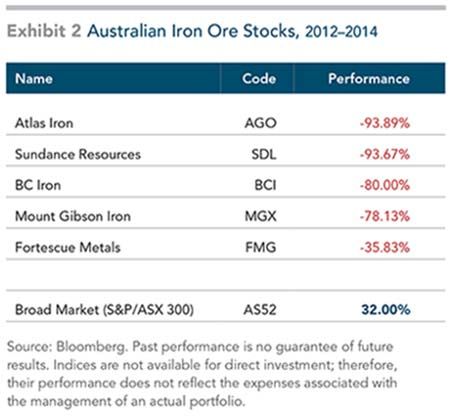
Quarterly Perspective: July 2015
What Long‐term Returns to Expect Here’s why:
If you ask most financial professionals, retail We examined the past 88 years’ worth of annual
investors, or PhD‐toting economists (or anyone market returns and looked to see how often the
else for that matter) what the long‐term returns market produced a calendar year return within
from the stock portion of their portfolio might that expected future average range of 8% to
be, you’re bound to get an answer of something 10%. The answer: a paltry three times. Those
like 8% to 10%. years were 1926, 1956, and 1992. Put another
way, in 85 of the past 88 years, the U.S. total
stock market did not produce an annual return
between 8% and 10%. The takeaway here is that
Put another way, in 85 of the past 88
we should expect significant year‐over‐year
years, the U.S. total stock market did volatility in the stock portions of our portfolios.
not produce an annual return Annual returns will be bumpy, but long‐term
between 8% and 10%. returns have been unassailable.
This yearly volatility will test investor discipline
While we believe that range of returns is and prompt some people to question their
fundamentally likely for long‐term investment commitment to equities. While no one knows
horizons (20 years+), the real difficulty exists in the future, looking at the past may help you gain
the manner in which those annual returns will be a better view of long‐term market performance
delivered. There is a temptation to look at our and put the recent market volatility in
annual equity returns and check to see whether perspective.
our stocks returned between 8% and 10% to see
if we are “on track” for building wealth as we
expect. Unfortunately, making those annual
1949
comparisons to the long‐term average will leave 20.2
1951
you needlessly frustrated and anxious. 20.7
1963
21.0
1970 1993 1982
0.0 11.1 21.0
1953 2014 1996
Positive Years: 67 75% 0.7 11.6 21.4
2011 2004 1944
Negative Years: 22 25% 0.8 12.0 21.5
1960 1959 1983
Total U.S. Market Index Returns by Year 1.2
1987
12.7
1952
22.0
1979 1997
1.7 13.4 22.6 31.4
1948 1968 1998 2003
2.1 14.1 24.3 31.6
1939 1965 1955 1985
2.8 14.5 25.2 32.2
1947 2006 1999 1936
3.6 15.5 25.2 32.3
1973 1966 1934 1942 1976 1980
-18.1 -8.7 4.1 16.1 26.8 32.8
1929 1932 1984 1964 1961 1927
-15.2 -8.6 4.5 16.1 26.9 33.5
2000 1940 2007 1971 1938 1991
-11.4 -7.1 5.8 16.1 28.2 34.7
2001 1946 2005 2012 1943 2013
-11.1 -6.2 6.2 16.2 28.4 35.2
1969 1990 1978 1986 1967 1995
-10.9 -6.0 7.5 16.2 28.7 36.8
1930 1962 1977 1956 1972 2009 1928 1935
-28.8 -10.2 -4.3 8.3 16.8 28.8 38.4 44.4
2008 1974 1941 1981 1926 2010 1989 1945 1958
-36.7 -27.0 -10.1 -3.6 8.4 17.7 28.9 38.5 45.0
1931 1937 2002 1957 1994 1992 1988 1950 1975 1954 1933
-43.5 -34.7 -21.1 -10.0 -0.1 9.8 18.0 29.6 38.8 50.0 56.7
-50% to -40% -40% to -30% -30% to -20% -20% to -10% -10% to 0% 0% to 10% 10% to 20% 20% to 30% 30% to 40% 40% to 50% 50% to 60%
Annual Return Range
Quarterly Perspective: July 2015
The chart on the previous page shows the trough‐to‐peak trailing 12‐month return is about
historical distribution of U.S. market returns 40% at the time of writing. We are certain we
since 1926. The performance years are stacked could fashion a convincing narrative about why
in ascending order by return range. This chart these sectors will continue to outperform
illustrates that: others. Perhaps we could offer demographics
about the aging population, the increasing
Over the long term, the market’s consumption of health care, the favorable
positive return years have outnumbered impact of legislation on these sectors, etc. Please
the negative return years. Since 1926, know that media outlets writing headlines about
the market has experienced a positive fashionable sectors are here to stay. Building
return in almost three‐quarters of the investment strategies around them is patently
calendar years. foolish – and our friends in Australia can help us
remember why.
Not only are the positive years more
numerous, the chart shows a larger There’s nothing inherently wrong with this kind
concentration of performance in the of journalistic sector sensationalism, by the way.
higher ranges of returns. The boost in productivity brought by digital
technology and communication was a real story
The sequence of calendar returns in the late ’90s, as was the impact of China as it
appears random, suggesting that integrated into the world economy over the past
accurately predicting future decade.
performance is a difficult task for any
investor or professional manager.
Typically, the market has one down year for
every three up years. Over time, the market has
rewarded investors who can bear the volatility of
stocks and stay committed through various
periods of performance.
Where it goes off the rails for investors is the
Australia, Coal Mining, & the Hot Sector point at which they extrapolate well‐
documented economic trends in order to make
At Rockwood Wealth Management we changes to their portfolios based on what has
frequently remind ourselves and our clients to already happened or speculation about what
ignore the “hot sector” upon which the media might happen in the future.
occasionally locks in. Everyone remembers the
late 1990s, during which time the hot sector was We think the best example of this notion comes
technology. What you may not remember is to us from the Australian equity market. While it
what took place in Australia in the mid‐2000s – may not have made headlines here in the U.S.,
the great mining boom and inevitable mining stocks boomed in the first part of the last
subsequent bust. decade amid insatiable demand for metallurgical
coal and iron ore by Chinese steelmakers (who
One can argue that today the hot sector is produce 45% of steel globally). By 2008, the
biotech and health care services. Their combined boom was making billionaires of Australian
Quarterly Perspective: July 2015

mining entrepreneurs like Andrew “Twiggy”             chart shows, iron ore prices collapsed, falling by
Forrest and Gina Rinehart. While Texas had its oil    two‐thirds to below US$60 by 2015. Chinese
tycoons, wrote a Reuters reporter, the road to        demand peaked just as new growth in global
mega‐riches in Australia ran through red‐dirt         supply was coming online, a legacy of the long
iron ore towns.                                       lead times in mining investment.

At the time, Forrest’s listed company, Fortescue
Metals Group, was so hot that it launched a 10‐
for‐one stock split to take advantage of strong
interest among smaller retail investors. (They
knew that amateur investors chase hot stocks.)
The shares had quadrupled in value in less than
a year. The performance of stocks such as
Fortescue mirrored what was going on in the
commodity markets they serviced. Coal and iron
ore prices had roughly tripled in Australian dollar
terms in the six years up to mid‐2008, with these
bulk commodities by that stage accounting for
nearly 30% of the Australian economy’s total
exports.

The love affair around mining and commodities
continued to intensify over the next couple of
years.     By     March       2010,     London’s
Telegraph newspaper predicted a further
doubling in ore prices within months, stating the     The market prices of mining stocks followed suit.
outlook for the sector was “very sunny indeed.”       On the Australian market during 2012–2014,
Desperately seeking cheaper supplies, Chinese         many of the worst‐performing stocks have been
companies went on an acquisition spree. In July       either iron ore miners or companies serving that
2010, the Wall Street Journal said acquisitions by    market, as shown in Exhibit 2.
companies based in China or Hong Kong had
grown a hundredfold in five years.

By 2012, though, iron ore prices were starting to
fall from historic highs as China’s economic
expansion slowed. Chinese steelmakers, in
annual contract negotiations, sought to pay
prices that better reflected the fall in the spot
market.

Even so, Australian mining companies remained
bullish. In an interview with the Australian, BHP
Billiton’s head of iron ore forecast that the spot
price would settle around US$120 per metric
ton, down from the record of about US$180.
Oops, that wasn’t to be the case. Indeed, as the
Quarterly Perspective: July 2015

Ouch! This all goes to show the dangers of            adjusted returns are derived from these
building investment strategies around sector          dimensions – not from the hot sector.
stories. The iron ore companies were leveraged
to China’s steelmaking boom. They invested
heavily in new capacity to take advantage of high
prices. But China’s boom started to wind down             The more sector‐specific risk and
just as new mining capacity was coming online.            company‐specific risk in a portfolio,
The double whammy from weakening demand                   the more it is exposed to these
and surging supply pummeled iron ore prices               idiosyncratic factors beyond the
and drove down the market values of the mining
                                                          control of the individual investor.
stocks.

This is all another argument for the virtues of
diversification. The more sector‐specific risk and    In the small‐cap, high relative price (growth
company‐specific risk in a portfolio, the more it     stock) end of the Australian market, where many
is exposed to these idiosyncratic factors beyond      of the underperforming mining companies have
the control of the individual investor. But           crowded, some of the risk may be managed by
diversification does not just apply to sectors. We    excluding and underweighting companies with
can also manage it by diversifying across the         the lowest profitability and those with the
dimensions of returns, identified by academic         highest relative prices.
research as the basic organizing principles of the
market.                                               Of course, this does not mean a portfolio will be
                                                      completely immunized against security‐ or
These dimensions point to systematic                  sector‐specific risk. But it is a way of diluting
differences in expected returns based on              those influences and finding a balance between
characteristics of the security. To meet this         seeking to improve expected returns and striving
definition, they must be shown to be sensible,        for appropriate low‐cost diversification.
persistent across different periods, pervasive
across markets, and capable of being cost‐            At the end of the day, nothing in investment is
effectively captured.                                 ever cast in iron. But diversification, discipline,
                                                      and maintaining a level of balance can help
The four dimensions are the degree to which the       ensure that a single sector doesn’t bend your
portfolio is exposed to stocks vs. bonds, small vs.   portfolio out of shape.
large companies, low relative price stocks (value
stocks) vs. high relative price (growth stocks),
and high vs. low profitability firms. High risk‐
Quarterly Perspective: July 2015 Rockwood Wealth Management John Augenblick, MBA, CFP® john@rockwoodwealth.com Brian Booth, CFP® bbooth@rockwoodwealth.com Ted Toal, CFP® ted@rockwoodwealth.com Mark Kelly, CPA, CAIA mark.kelly@rockwoodwealth.com William Aquila, CFP® baquila@rockwoodwealth.com (267) 983.6400 www.RockwoodWealth.com 6236 Lower York Road New Hope, PA 18938 130 Admiral Cochrane Drive, Suite 200 Annapolis, MD 21401 Rockwood Wealth Management, LLC (RWM), a Pennsylvania limited liability company, is a fee‐only wealth advisory firm specializing in personal financial planning and investment management. Rockwood Wealth Management, LLC, is a U.S. Securities and Exchange Commission (SEC) Registered Investment Advisor. A copy of RWM’s Form ADV‐Part II is provided to all clients and prospective clients and is available for review by contacting the firm. CRSP data provided by the Center for Research in Securities Prices, University of Chicago. The CRSP 1‐10 Index measures the performance of the total U.S. stock market, which it defines as the aggregate capitalization of all securities listed on the NYSE, AMEX, and NASDAQ exchanges. Indices are not available for direct investment; therefore, their performance does not reflect the expenses associated with the management of an actual portfolio. Past performance is not a guarantee of future results.
You can also read