MassMutual Market Update February 24, 2022 - ADVISORS - Insert Logo - Marino ...
←
→
Page content transcription
If your browser does not render page correctly, please read the page content below
Insert Logo

 MassMutual

 Market Update
 February 24, 2022
 Courtesy of ██████████████████
             Marino Financial
             MARINO           Advisors
                      FINANCIAL
                     ██████████████████
  ██████████████████
 ADVISORS
██████████████████
Insert Logo
Just after 5 a.m. Eastern European time (GMT + 2), Ukraine’s government reported it was facing a
“full-scale attack from multiple directions.” We also have learned of many explosions across the
country, confirmation of downed Russian aircraft, and mass migrations from Kyiv, the Ukrainian
capital.
While the attack had been telegraphed by Russian leadership over the past several weeks, it is still
hard to deny this is likely the most significant military engagement in Europe since the end of World
War II. As such, today’s market update will be both concise and focused, and will largely address
one primary question: “what, as investors, are we to do?”
To answer that question, let us consider the situation through three lenses: 1) history, 2) timing, and 3)
perspective.
Section 1: History
Before my dear reader begins an eye-roll at the mention of a history lesson, let me try to narrow the
scope.
We, as a country, and more specifically as an economy, have experienced pandemics, wars, supply
shortages, consumer crises, supply shocks, and many more events over the past several hundred
years. As Table 1 reminds us, there have been, in fact, no shortages of trials and tribulations for us
collectively to navigate.
Table 1: Standard & Poor’s 500 performance following geopolitical events1
Max Drawdown
Days to
Drawdown 1-Year Year of Event Length
Recover
% (Days)
COVID-19 Pandemic Selloff -34% 74% 2020 23 129
1966 Credit Crunch -22% 32% 1966 172 321
Suez Canal Crisis / USSR invades Hungary -22% 31% 1956 318 559
1990s Recession/Iraq invades Kuwait/Oil prices rise -20% 31% 1990 63 152
LTCM Collapse /Russian financial crisis -19% 39% 1998 31 91
Chinese Stock Market Crash/US Stock Market Selloff -14% 27% 2015 190 297
Dot-com Bubble -12% 8% 1999 65 87
Asian Financial Crisis -11% 22% 1997 14 43
President Eisenhower suffers heart attack -11% 15% 1955 12 36
Friday 13th / Black Friday /Junk market collapse -10% 6% 1989 81 166
Fed rate hikes/High VIX levels/Inflation concerns -10% 5% 2018 9 150
Sterling Devaluation -10% 13% 1967 116 156
Average -16% 25% 91 182
Past performance is not indicative of future results
While each event had its own circumstances and storyline, it was also deemed to be a crisis in some
1 Source: Bloomberg, and MassMutual Research as of February 24, 2022Insert Logo
shape or form. And yet…
Each time, regardless of the severity, the event was resolved, the market recovered, and capital
markets continued to generate long-term returns in excess of inflation.
Is the Russian escalation different? Well, yes, of course it is. But so were the World Trade Center
bombing in 1993, the Cuban Missile Crisis, and the assasination of President John F. Kennedy. Each
event had rampant speculation, analysis, and predictions, and yet, on average, markets found a
way to recover.
Section 2: Timing
Which then brings us to the obvious question of “what if I’m certain?” Said another way, history is
littered with examples of individuals who are “certain” of the outcome. Perhaps we understand the
Russia-Ukraine conflict better than others, or perhaps we are the world’s foremost expert on Russia’s
President Vladimir Putin, or perhaps we just contain a (seemingly frequent) penchant for over-
confidence.
The problem is 1) we need to be right, and 2) our timing needs to be perfect.
Chart 1, one of my favorites, essentially shows this dynamic.
Chart 1: The Cost of Market Timing – Annualized Return of the Standard & Poor’s 500 When Missing the
Best Market Days (January 1996- December 2021)2
Past performance is not indicative of future results
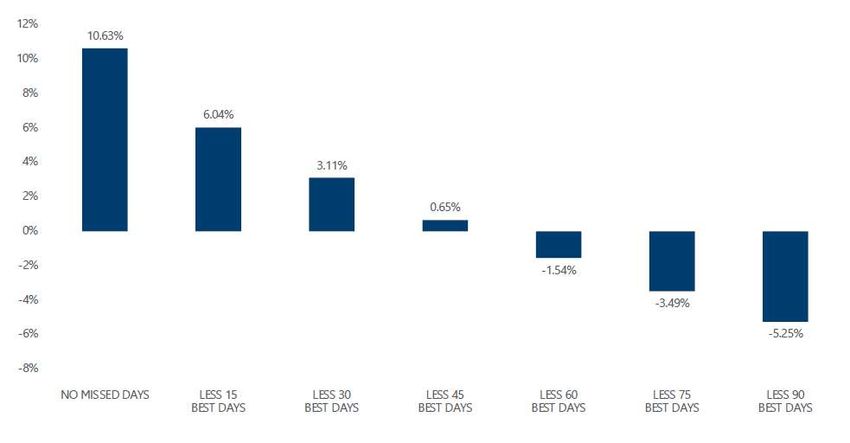
2 Source: Bloomberg;Insert Logo Let me explain. Chart 1 shows the annualized return from 1996 through 2021 when missing the best market days. To make this clearer, over this time period, the Standard & Poor’s 500 returned 10.63% if an investor were to remain fully invested for the entire time period. Yet if the investor missed the 15 best days over the ENTIRE 25-year period, the return dropped to 6.04%. That’s the equivalent of missing just one day every 1.6 years. If that investor were to miss the best 30 days (or a little bit more than one day per year), then the return drops to 3.1%. While interesting and fairly staggering, to me, the important question is why? When markets sell-off, they, by definition, become more volatile. Historically, they’ve moved down more, and they move up more. They, again, by definition, move a lot more. Yet if we exit the markets when they are moving down a lot, then we are likely to miss those days they are also moving up a lot. Over the past 20 years, most of the best market days occurred in 2008, 2011, and 2020, all years during which, not coincidentally, the largest crises occurred. In fact, generally speaking, the largest up moves occurred on those days following the largest down moves. This, also not coincidentally, tends to precisely the same moments when the pain is greatest for investors, and they are mostly likely to exit the markets. All of which is to say, even if one could predict which direction markets will move, and even if one could avoid taxes and the higher fees (both generally impossible), then that person must also get the timing right …or the opportunity costs will be enormous. Section 3: Perspective For the last section, let us take a moment and use a wider lens. Capitalism is an imperfect system. It does, however, through capital markets, allocate resources to those companies that need it for productive purposes remarkably well. If, for example, we provide a company our hard earned dollars, we expect it to utilize those dollars to make better products, to create a more thoughtful strategy, and in general to grow our dollars into more than what we gave it. Generally speaking, that company is fundamentally doing the same thing today as it was yesterday, and it is important to remember the Russian invasion has not changed that dynamic. Similarly, over history, we have faced many crises before (as discussed in section 1). Yet, historically, over the long term, markets have a way of generating returns despite those many crises. While table 1 demonstrated specific geopolitical events, Chart 2 reminds us of that dynamic by simply focusing on market sell-offs regardless of the reason.
Insert Logo

Chart 2: S&P 500 Historical Returns Following Drawdowns3

    200%

    150%

    100%

     50%

      0%

     -50%

    -100%
            1932 1957   1960   1962   1966   1970   1974 1982   1984   1987   1990   1998 2002   2009   2018   2020 Avg.

                                                                          Past Performance is not indicative of future results

The red bars represent every loss in the S&P 500 since 1929 along with its magnitude. At the far left is
1932 when the S&P lost nearly 90% and at the far right is 2020 when the S&P lost a bit over 33%.

The blue, grey, and yellow bars show subsequent gains in the S&P 500 following those losses.

I see two important takeways:

      (1) There wasn’t a single time period over the past 100 years that had a negative one-year, three-
          year, or five-year forward return (following the loss), and
      (2) Those returns for the subsequent time periods were strongly positive.

Will that happen this time? I have no idea.

Which is sort of the point. The short term is impossible to predict. Crises, pandemics, wars…those
events seem to be part and parcel with the human condition.

Yet we persevere. We evolve. We learn (hopefully) from those events, and we (hopefully) try to make

3   Source: FRED, Bloomberg as of Jan. 24, 2022.
Insert Logo better decisions the next time. Markets reflect that dynamic. Markets reflect the idea that the short term is noisy and confusing, but over the long term, incentives reward growth and ingenuity, and have done so in remarkable fashion over the past several hundred years. Try to take the short term in stride and turn your focus to the long term. As always, we remain at your service, and we’ll continue watching these events closely. Please let us or your financial professional know how we can serve you. Daken J. Vanderburg, CFA Head of Investments, Wealth Management MML Investors Services Asset allocation and diversification does not guarantee a profit or protect against loss in declining markets. There is no guarantee that a diversified portfolio will outperform a non-diversified portfolio or that diversification among asset classes will reduce risk. Investing involves risk, including the possible loss of principal. There are no guarantees an investment’s stated objective will be achieved. This material does not constitute a recommendation to engage in or refrain from a particular course of action. The information within has not been tailored for any individual. The opinions expressed herein are those of Daken J. Vanderburg, CFA as of the date of writing and are subject to change. MassMutual Trust Company, FSB (MassMutual Trust) and MML Investors Services provide this article for informational purposes, and do not make any representations as to the accuracy or effectiveness of its content s. Mr. Vanderburg is an employee of MassMutual Trust and MML Investors Services, and any comments, opinions or facts listed are those of Mr. Vanderburg. MassMutual Trust and MML Investors Services, LLC (MMLIS) are subsidiaries of Massachusetts Mutual Life Insurance Company (MassMutual). This commentary is brought to you courtesy of MassMutual Trust and MML Investors Services, LLC (Member FINRA, Member SIPC). Past performance is not indicative of future performance. An index is unmanaged and one cannot invest directly in an index. Material discussed is meant for informational purposes only and it is not to be construed as specific tax, legal, or investment advice. Although the information has been gathered from sources believed to be reliable, it is not guaranteed or independently verified Please note that individual situations can vary, therefore, the information should be relied upon when coordinated with individual professional advice. Clients must rely upon his or her own financial professional before making decisions with respect to these matters. This material may contain forward looking statements that are subject to certain risks and uncertainties. Actual results, performance, or achievements may differ materially from those expressed or implied. Securities, investment advisory, and wealth management solutions offered by MML Investors Services, LLC member SIPC, a registered broker-dealer, and a registered investment adviser. DBA Name is not a subsidiary or affiliate of MML Investors Services, LLC or its affiliated companies. ©2022 Massachusetts Mutual Life Insurance Company, Springfield, MA 01111-0001 All Rights Reserved. www.massmutual.com MM202502-300758
You can also read