U.S. Wealth Market Outlook - Q3 2021 - BlackRock
←
→
Page content transcription
If your browser does not render page correctly, please read the page content below

U.S. Wealth
Market Outlook
Q3 2021

                 USWAM0821U/S-1755111-1/23
U.S. Wealth Market Outlook
Our views for 2021

What we’re closely watching:

 1                        2                      3
 The economic restart     The low rate problem   The globe, rewired

                                                           USWAM0821U/S-1755111-2/23
THE ECONOMIC RESTART

                                        Back on track?
      1                                 Economic activity has accelerated sharply – in contrast to prolonged weakness following the
                                        global financial crisis. But strong growth is unlikely to be sustained once the restart completes.

                                            U.S. GDP growth trend after the Covid shock and global financial crisis
                                      10
                                                n U.S. GDP and consensus median
                                                n Pre-GFC five-year growth trend
                                                n Range of growth trend assumptions
                                                n GDP consensus range
                                      9.9
               Real GDP (log units)

                                      9.8

                                      9.7

                                      9.6
                                         2007          2009        2011               2013                2015                2017                2019                2021

Forward looking estimates may not come to pass. Sources: BlackRock Investment Institute and Reuters News, with data from Haver Analytics, July 2021. Notes: The pink line represents the extrapolation of
the five-year growth trend preceding the global financial crisis (GFC). The yellow area represents a range of consensus assumptions for trend growth following the Covidshock. The orange line represents
actual U.S. GDP up to the first quarter of 2021 and the median forecast from the second quarter of 2021 to the last quarter of 2022, based on the latest Reuters poll as of June 10, 2021. We plot the log of
GDP so that the slope of the line indicates the trend growth rate.
                                                                                                                                                                                   USWAM0821U/S-1755111-3/23
THE ECONOMIC RESTART

                         Not a typical business cycle
      1                  The essence of the “restart” is that it does not follow the pattern of a typical economic cycle.
                         According to traditional measures, the Covid-19 induced “recession” only lasted a few months.

                                                              U.S. unemployment rate and recessions

Source: Refinitiv Datastream, BlackRock Investment Institute, as of July 21, 2021
                                                                                                            USWAM0821U/S-1755111-4/23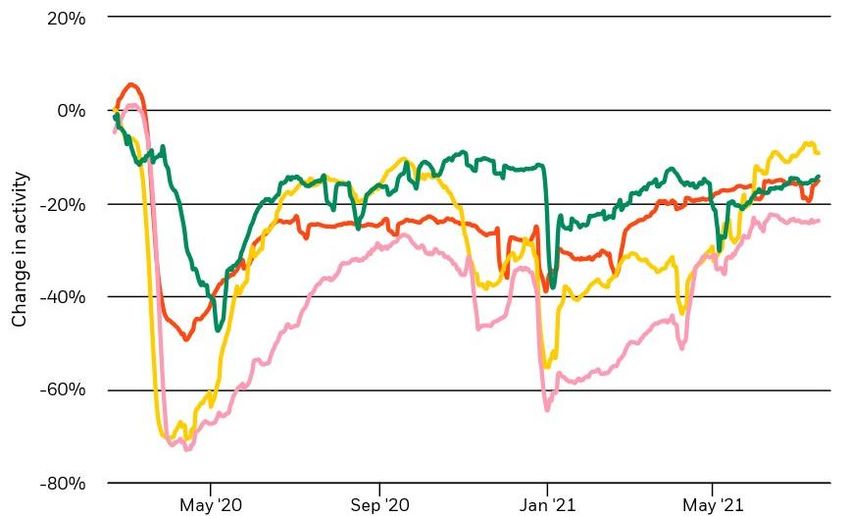
THE ECONOMIC RESTART

                         Virus dynamics
      1                  While new case data can be influenced by a myriad of factors, looking at positive test rates or
                         hospitalization data can give a better picture of the impact of the virus through time.

                                                                    Hospitalization levels per million

Sources: The COVID tracking project, ECDC, UK government.
Notes: Due to different definition/measurement data levels may not be comparable across countries.
                                                                                                             USWAM0821U/S-1755111-5/23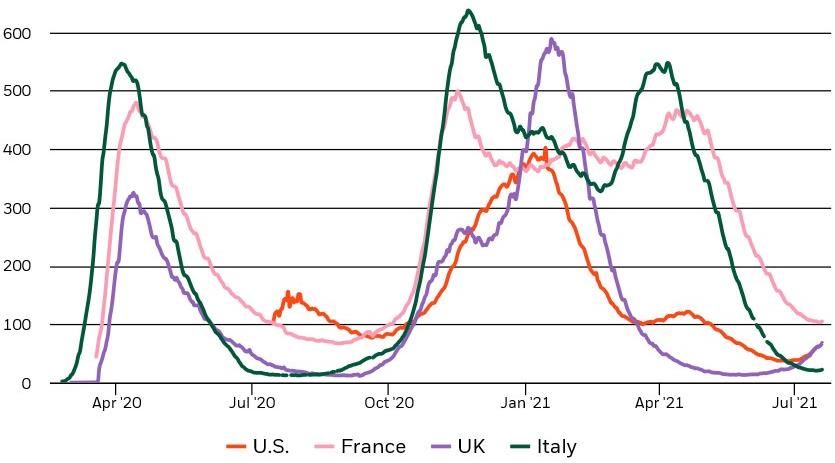
THE ECONOMIC RESTART

                          Cutting out the noise
      1                   Early in the pandemic, mobility data may have been a better predictor of economic activity than
                          lockdown mandates, or even virus cases.

                   Location based Google data showing the difference in activity from pre-virus baseline

Sources: BlackRock Investment Institute, with data from Google.
Notes: Google location data based on the average of the retail and recreation, workplace and transit categories, 7-day rolling average. Euro area based on average of Germany, France and Italy.
                                                                                                                                                                                    USWAM0821U/S-1755111-6/23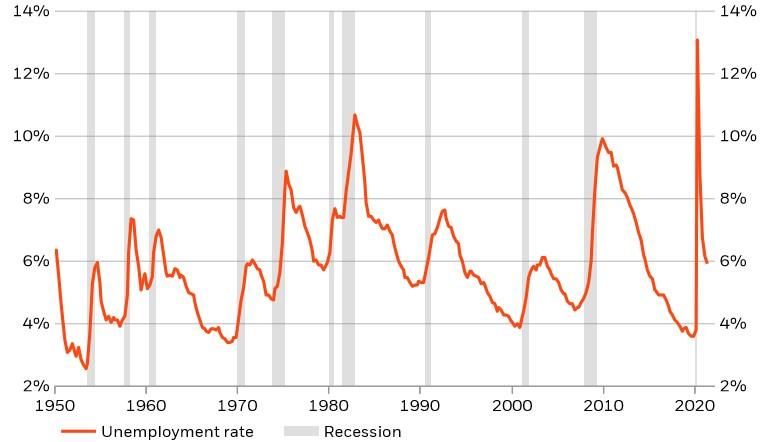
THE LOW RATE PROBLEM

                         Historically low bond returns
      2                  With interest rates at historic lows, expect low bond returns for the foreseeable future.

                                             Bond returns mirror interest rates at the start of a decade
                                                 Average annual 10-year bond returns since 1930

Represents return decade-to-date (1/1/10 to 12/31/20). Morningstar and U.S. Treasury as of 12/31/20. U.S. Bonds are represented by the BbgBarc U.S. Aggregate Bond Index from 1/3/89 to
12/31/20 and the IA SBBI U.S. IT Bond Index from 1/1/26 to 1/3/89.

Past performance does not guarantee or indicate future results.Index performance is for illustrative purposes only. You cannot invest directly in the index.
                                                                                                                                                                        USWAM0821U/S-1755111-7/23
THE LOW RATE PROBLEM
Loss of a shock absorber
2 During past stock market selloffs, core bonds rallied. But today’s yields are close to zero and
have not much more room to fall.
Can core bonds diversify equities like they used to?
U.S. 10-Year Treasury yield changes during recessions
P ast performance does not guarantee future results.
Source: BlackRock, Bloomberg as of 3/31/21. U.S. recession periods are defined by National Bureau of Economic Research. Graph displays U.S. 10-Year Treasury Yield rate changes during recession
periods. 10-Year Treasury change reflects the biggest move seen from as early as six months before the recession period
USWAM0821U/S-1755111-8/23THE LOW RATE PROBLEM
Inflation can spell negative returns
2 Unlike in previous inflationary periods, interest and savings rates may not keep up
Inflation versus interest and savings rates Largest gap between interest rates and inflation
today since 1980
As of 5/31/21 10-year U.S. Treasury yield minus inflation (CPI), as of 5/31/21
5.0% 12
10
8
6
4
2
1.6% 0
-2
0.1% -4
-6
Jun-64
Jun-67
Jun-79
Jun-82
Jun-85
Jun-00
Jun-03
Jun-06
Jun-18
Jun-21
Jun-70
Jun-73
Jun-76
Jun-88
Jun-91
Jun-94
Jun-97
Jun-09
Jun-12
Jun-15
Inflation 10-year U.S. 3-month
May-2021 Treasury CD
Source: Bureau of Labor Statistics, as of 5/31/21 and Morningstar.
P ast performance does not guarantee or indicate future results. Index performance is for illustrative purposes only. You cannot invest directly in the index.
USWAM0821U/S-1755111-9/23THE GLOBE, REWIRED
Deglobalizing forces
3 Purchasing manager surveys indicate longer delivery times, partly on shipping capacity
shortages.
PMI supplier delivery index, 2008-2021
Through March 2021
-8
Japan 2011
Supplier delivery times (z-score
Fukushima
-6 Longer delivery
n Global n Euro area times
n U.S. n Japan
-4
inverted)
-2
0
2
4
2008 2010 2012 2014 2016 2018 2020
Sources: BlackRock Investment Institute, Markit, with data from Refinitiv Datastream and Haver Analytics, March 2021. Notes: Chart on the left shows an index of delivery times for items used in the production
process, for manufacturing firms. As delivery times lengthen (for example due to capacity constraints) the level of the index falls (note the Y-axis is inverted). Euro area data is for the whole region.
USWAM0821U/S-1755111-10/23THE GLOBE REWIRED
Opposite poles
3 The world looks increasingly fragmented, with the U.S. and China at opposite poles.
Regional share of global GDP, 1990-2024
60%
50%
Share of global GDP
n North America, Europe and Japan
40%
n Asia ex-Japan
30%
20%
10%
1990 1995 2000 2005 2010 2015 2020 2025
Sources: BlackRock Investment Institute, with data from IMF, Refinitiv, October 2020. Notes: The lines how each region’s combined share of global GDP on a purchasing power parity (PPP) basis. The dotted
lines show the forecast period based on IMF projections to 2024.
USWAM0821U/S-1755111-11/23U.S. Wealth Market Outlook
Our views for 2021
The path forward:
Balancing optimism and realism
USWAM0821U/S-1755111-12/23THE PATH FORWARD
Chase individual stocks at your own risk
Not all stocks are created equal, but there’s strength in numbers.
Individual U.S. stocks U.S. stock mutual funds and ETFs
(last 5 years) (last 5 years)
26% 99.9%
74%
lost
money 0.1%
lost
money
# positive # negative % lost money
U.S. stocks 2698 951 26%
U.S. stock mutual funds 1702 2 0.1%
U.S. stock ETFs 276 0 0%
Source: Morningstar as of 6/30/21. Mutual Funds and ETFs are the Morningstar U.S. Equity Category, oldest share class only. US Individual Stocks are the Morningstar US Stock Universe, all securities on
the NYSE and NASDAQ. Analysis does not include obsolete mutual funds, ETFs or stocks as defined by Morningstar. Performance is historical and does not guarantee or indicate future results.
USWAM0821U/S-1755111-13/23THE PATH FORWARD
Waiting to invest can leave you behind
“Compound interest – the eighth wonder of the world.”
$300,000 Hypothetical growth of $100,000 assuming 10% annual yield
$259,374
$260,000
$220,000
$180,000
$161,051
$140,000
$100,000
0 1 2 3 4 5 6 7 8 9 10
Years
Source: BlackRock For illustrative purposes only.
USWAM0821U/S-1755111-14/23THE PATH FORWARD
It’s time in the market, not timing the
market
Missing top-performing days can hurt your return
Hypothetical $100,000 investment in the S&P 500 Index
over the last 20 years (2001-2020)
$425K Don’t miss out
$381K when markets
$344K snap back
$314K
$287K
$268K 22 of the 25
$195K worst days in the
$147K market were
$155K within one month
$92K
of one of the 25
best days
Stayed 1 2 3 4 5 10 15 20 25
Invested
Missing the top-performing days
Source: BlackRock; Bloomberg as of 12/31/20. Stocks are represented by the S&P 500 Index, an unmanaged index that is generally considered representative of the U.S. stock market. Past performance does not guarantee or indicate future results. It is not
possible to invest directly in an index.
USWAM0821U/S-1755111-15/23THE PATH FORWARD
Get cash off the sidelines
Investors are pouring record assets in money market funds – potentially to their detriment
Money market fund assets 3-year U.S. stock performance following a
Last 15 years (2/1/96 – 1/31/21) peak in money market fund assets
Average annual performance
Jan-21
$5,000 $4.3T
$4,500
Jan-09
$4,000 $3.8T 19.2%
$3,500
16.4%
$3,000
Jan-03
Billions
$2,500 $2.3T
$2,000
$1,500
$1,000
$500
$0
1/31/03 - 1/31/06 1/31/09 - 1/31/12
Source: Morningstar as of 1/31/21. U.S. stocks represented by the S&P 500 Index, an unmanaged index that is generally considered representative of the U.S. stock market. Past performance does not
guarantee or indicate future results. Index performance is for illustrative purposes only. You cannot invest directly in the index.
USWAM0821U/S-1755111-16/23THE PATH FORWARD
Go beyond your borders
Global market leadership comes in waves.
1International stock index returns and U.S. stock index returns, 10-year average annual rolling returns, 11/30/86 –12/31/20 with international stock positive index returns represented as negative.
Source: Morningstar as of 12/31/20. U.S. stock index represented by the IA SBBI U.S. Large stock index and international stocks represented by the MSCI EAFE NR USD index. Past performance does not
guarantee or indicate future results. Index performance is for illustrative purposes only. You cannot invest directly in the index. 2Source: BlackRock as of 03/31/21. US equities represented by the S&P 500
Index. International equities represented by the MSCI ACWI ex USA Index. Historical average data between 1/1/2011-03/31/2021. Past performance is no guarantee of future results.
USWAM0821U/S-1755111-17/23THE PATH FORWARD
Go beyond your borders
Rolling 10-year period outperformance, international vs. U.S.
(10-year rolling periods various, U.S. return levels 1970 — 12/2020)
International
US Returns outperforms +2.4% on avgTHE PATH FORWARD
Today’s leaders may not be tomorrow’s
Don’t unwittingly overweight today’s leaders. Consider strategies that seek tomorrow’s potential innovators.
Technology Health care
S&P 500 Select technology Sector S&P 500 Select health care Sector
Top 3 holdings Top 3 holdings
48% 22%
Microsoft J&J
Apple United Health
Visa Pfizer
The other 70 The other 60
holdings holdings
52% 78%
Source: State Street as of 10/26/2020. Allocations are subject to change. This is not meant as a guarantee of any future result or experience. This information should not be relied upon as research,
investment advice or a recommendation regarding the Funds or any security in particular. Specific companies or issuers are mentioned for educational purposes only and should not be deemed as a
recommendation to buy or sell any securities. Any companies mentioned do not necessarily represent current or future holdings of any BlackRock products.
USWAM0821U/S-1755111-19/23THE PATH FORWARD
Sustainability is the new investment
standard
Companies are disclosing Institutions are Investors are asking about
more ESG information investing in ESG sustainable investing
90%
20%
70% 72%
2011 2019
% of S&P companies of institutional investors of Americans surveyed by
reporting ESG disclosures have implemented ESG Morningstar have expressed
has increased1 strategies2 interest in sustainable investing3
1 Source: 2020 GA Institute Annual S&P 500 Sustainability Reporting Analysis;https://www.ga-institute.com/research-reports/flash-reports/2020-sp-500-flash-report.html.
2 Source: 2018 Morgan Stanley Survey: https://www.morganstanley.com/press-releases/morgan-stanley-survey-finds-sustainable-investing-momentum-high-.
3 Source: Morningstar Are Your Clients ESG Investors?, April 22, 2019.
USWAM0821U/S-1755111-20/23THE PATH FORWARD
Sustainability considers both
traditional and ESG analysis
Consider two companies that have …but different environmental, social,
similar financial characteristics... and governance characteristics.
Company A Company B Company A Company B
Consistent Which one looks Fair CEO
✓ profits?
✓
like a better
✓
Pay? X
✓
long-term Robust
Grows
✓ dividends?
✓ investment ✓ data X
✓
after applying security?
High an ESG lens?
Employee
✓ market
share?
✓ ✓
satisfaction? X
✓
Source: BlackRock. For illustrative purposes only.
USWAM0821U/S-1755111-21/23THE PATH FORWARD
Think beyond the traditional 60/40
portfolio
While stock volatility and valuations are elevated, bonds are less equipped to provide protection.
P ast performance is no guarantee of future results. Equity market data – Source: Morningstar, as of 3/31/21. Stock market represented by the S&P 500 Index. Average annual volatilit y based on standard
deviation. Index performance is for illustrative purposes only. It is not possible to invest in an unmanaged index. Rates dat a – Source: U.S. Dept. of the Treasury as of 3/31/21. Data is since 7/25/12 when
the 10-year Treasury hit a 30 year low point.
USWAM0821U/S-1755111-22/23Important notes
This material is prepared by BlackRock and is not intended to be relied upon as a forecast, research or investment advice, and is not a recommendation, offer or solicitation
to buy or sell any securities or to adopt any investment strategy. The opinions expressed are as of July 2021 and may change as subsequent conditions vary. The
information and opinions contained in this material are derived from proprietary and nonproprietary sources deemed by BlackRock to be reliable, are not necessarily all-
inclusive and are not guaranteed as to accuracy. As such, no warranty of accuracy or reliability is given and no responsibility arising in any other way for errors and
omissions (including responsibility to any person by reason of negligence) is accepted by BlackRock, its officers, employees or agents.
Investment involves risks. International investing involves additional risks, including risks related to foreign currency, limited liquidity, less government regulation and the
possibility of substantial volatility due to adverse political, economic or other developments. The two main risks related tofixed income investing are interest rate risk and
credit risk. Typically, when interest rates rise, there is a corresponding decline in the market value of bonds. Credit risk refers to the possibility that the issuer of the bond
will not be able to make principal and interest payments. Index performance is shown for illustrative purposes only. Commodities’ prices may be highly volatile. Prices may
be affected by various economic, financial, social and political factors, which may be unpredictable and may have a significant impact on the prices of precious metals.
Concentrated investments in specific industries, sectors, markets or asset classes may underperform or be more volatile than other industries, sectors, markets or asset
classes and the general securities market. A significant portion of the aggregate world gold holdings is owned by governments, central banks and related institutions. One
or more of these institutions could sell in amounts large enough to cause a decline in world gold prices. Should there be an increase in the level of hedge activity of gold
producing companies, it could cause a decline in world gold prices. Should the speculative community take a negative view towards gold, it could cause a decline in world
gold prices. You cannot invest directly in an index.
©2021 BlackRock. All rights reserved. BlackRock is a trademark of BlackRock, Inc. or its subsidiaries in the United States and elsewhere. All other trademarks are
the property of their respective owners.
Prepared by BlackRock Investments, LLC. Member FINRA.
USWAM0821U/S-1755111-23/23You can also read