Measuring and Comparing Municipal Policy Responses to COVID-19
←
→
Page content transcription
If your browser does not render page correctly, please read the page content below
Canadian Journal of Political Science (2020), 53, 227–238
           doi:10.1017/S000842392000044X

           R E S E A R C H N O T E / N OT E S D E R E C H E R C H E

           Measuring and Comparing Municipal Policy
           Responses to COVID-19
           David A. Armstrong II1 and Jack Lucas2*
           1
            Department of Political Science, University of Western Ontario, London, Ontario, N6A 5C2 and
           2
            Department of Political Science, University of Calgary, 2500 University Drive NW, Calgary, Alberta,
           T2N 1N4
           *Corresponding author. Email: jack.lucas@ucalgary.ca

           Introduction
           Municipal governments are experts in social non-distancing. From swimming pools
           to libraries, streetcars to public parks, municipalities bring residents together and
           move them around—services vital to a vibrant community in ordinary times, but
           potentially disastrous in a pandemic. Municipal decisions to shutter these services
           and enforce social distancing are thus crucial for a successful COVID-19 response.
              Not only are these municipal policy decisions costly, but they also depend on a
           shared commitment to decisive and coordinated action. This shared commitment is
           by no means guaranteed; in the U.S., for example, municipal responses to the pan-
           demic appear to vary quite substantially by region and local partisanship. Under
           normal circumstances, we would hardly be surprised to see variation in municipal
           policy decisions that involve substantial costs, serious collective action challenges,
           and potential ideological disagreement.
              In this note, we use a survey of 551 councillors in 306 Canadian municipalities
           to measure the aggressiveness of municipal COVID-19 policy responses. We show
           that aggressiveness is strongly related to municipal population size and case totals
           and modestly related to province and local ideology. These findings reflect a wide-
           spread commitment among Canadian municipalities to aggressive policy action
           while also revealing important features of Canada’s political geography.

           Municipal Policy Responses to COVID-19
           The CMB COVID-19 survey, a survey of politicians in municipalities above 9,000
           population, contained a number of factual questions about municipal responses to
           the COVID-19 pandemic.1 We asked if parks, libraries, city halls, recreation facil-
           ities, and public transit were open, partially closed, or fully closed; if council and
           Data and replication files are available at https://doi.org/10.5683/SP2/MXWJAZ. The second author is a
           member of the English-language CJPS editorial team. To maintain objectivity, an outside editor oversaw
           the review process and was fully responsible for editorial decisions related to this submission.
           © Canadian Political Science Association (l’Association canadienne de science politique) and/et la Société québécoise de
           science politique 2020. This is an Open Access article, distributed under the terms of the Creative Commons Attribution
           licence (http://creativecommons.org/licenses/by/4.0/), which permits unrestricted re-use, distribution, and reproduction in
           any medium, provided the original work is properly cited.

Downloaded from https://www.cambridge.org/core. IP address: 46.4.80.155, on 27 Jan 2022 at 17:20:46, subject to the Cambridge Core terms of
use, available at https://www.cambridge.org/core/terms. https://doi.org/10.1017/S000842392000044X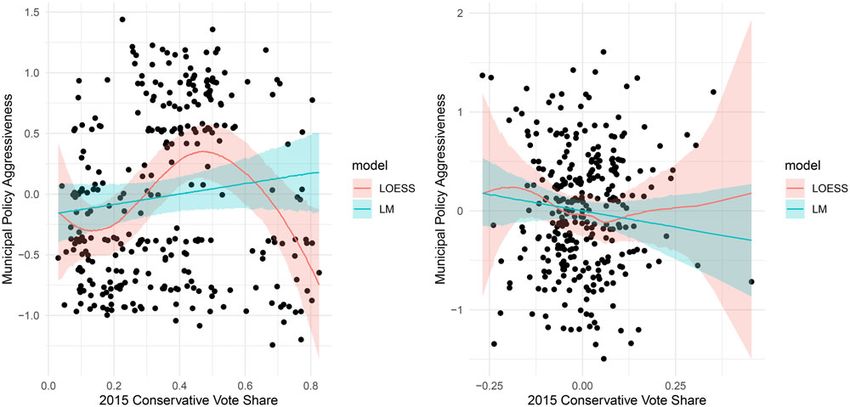
228        David A. Armstrong and Jack Lucas

              committee meetings were cancelled, in camera, virtual, or proceeding as usual;
              and if the municipality had declared a state of emergency. These questions were
              modelled on data that had been collected for a smaller number of cities, and
              provided a useful overall picture of how municipalities are responding to the
              pandemic.2 We begin with an overview of variation in the individual measures
              and then describe our approach to using the structure in the data to build a
              summary measure of municipal policy aggressiveness.

              Descriptive Overview
              In considering the individual policy instruments, we first want to highlight
              instances of near unanimity. Roughly 98 per cent of municipalities indicated that
              they had either cancelled or moved council meetings to in camera or virtual for-
              mats, and 100 per cent did the same for committee meetings. Only 1 per cent of
              municipalities have not fully closed recreation facilities and 5 per cent have not
              fully closed libraries.
                  On the remaining policies, we do see some variation across municipalities. For
              example, only 43 per cent of municipalities have fully closed city halls, and 65 per
              cent have fully closed their parks. Transit operations also remain at least partially
              open in most places. Only 13 per cent of municipalities have fully closed transit
              operations, and another 66 per cent have partially closed those operations.
              Finally, 41 per cent of municipalities have declared states of emergency.
                  To provide a sense of how these policy choices may vary, we plot policy adoption
              by health unit within provinces. Figure 1 shows the proportion of fully closed facil-
              ities (or emergency status declared) by health unit. The units are ordered within
              province by their mean across all of the indicators; on average, Ontario appears
              to have the most aggressive response (i.e., lightest blue colours). Provinces closer
              to the top have municipalities that have, on average, closed more services than
              those toward the bottom. There is also considerable within-health-unit variation
              in responses, which we explore in more detail below.

              Latent Variable Model of Policy Aggressiveness
              The structure that is visible in the plot in Figure 1 suggests that we might think
              about each policy choice as existing on an underlying scale, which we might call
              the “aggressiveness” of the municipality’s response. We can think of each policy
              as having a level of “difficulty,” where difficulty is understood to mean how
              much of the underlying trait (aggressiveness) a municipality needs to possess for
              us to predict that it would implement that policy. This allows us to array each policy
              on a single dimension, from less to more “difficult,” and to use this dimension to
              estimate a municipality’s overall “aggressiveness.”
                 We use a Bayesian Item Response Theory model to identify and describe the
              underlying structure in the survey responses (Fox, 2010). Due to the lack of varia-
              tion on the “parks” and “city hall” policies, we collapsed these into binary indica-
              tors of “fully closed” versus “partially closed/open” responses. The declaration of
              emergency is already a binary indicator. We maintain the three available categories

Downloaded from https://www.cambridge.org/core. IP address: 46.4.80.155, on 27 Jan 2022 at 17:20:46, subject to the Cambridge Core terms of
use, available at https://www.cambridge.org/core/terms. https://doi.org/10.1017/S000842392000044X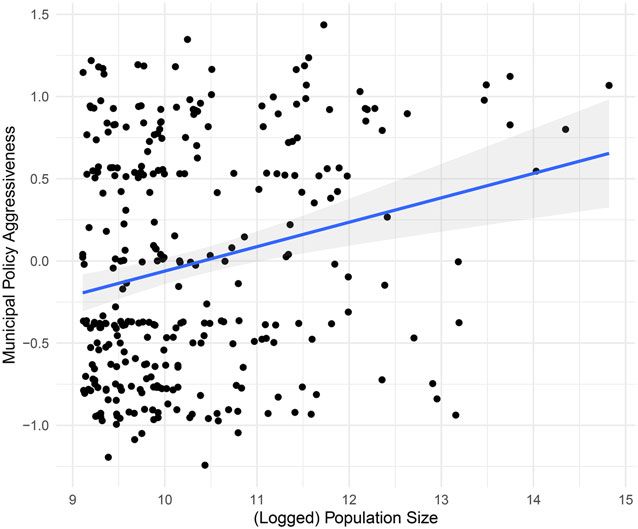
Canadian Journal of Political Science                  229

           Figure 1. COVID-19 response by health unit.

Downloaded from https://www.cambridge.org/core. IP address: 46.4.80.155, on 27 Jan 2022 at 17:20:46, subject to the Cambridge Core terms of
use, available at https://www.cambridge.org/core/terms. https://doi.org/10.1017/S000842392000044X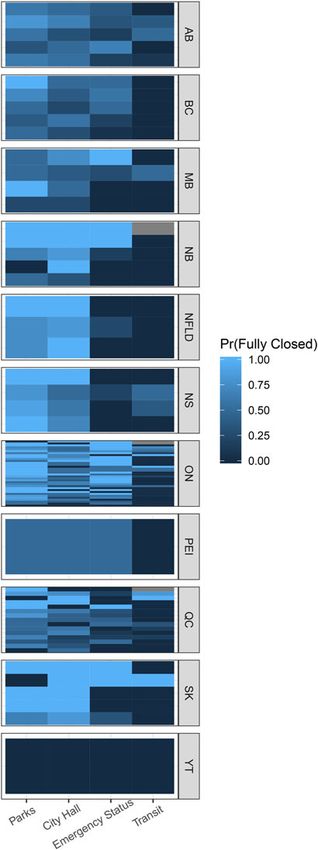
230        David A. Armstrong and Jack Lucas

              on the transit indicator (open/partially closed/fully closed), as there is meaningful
              variation across all three.
                 We model the binary indicators using a logistic regression of the indicator on the
              latent variable. For the binary variables, our model is

                                              Pr(yijk = 1)
                                      log                      = b1,k + b2,k jj
                                            1 − Pr(yijk = 1)

                 Here, i refers to the individual within each of the j municipalities for each of the
              k indicators. For the ordinal indicator (transit), we estimate

                                              Pr(yijk ≤ m)
                                       log                    = km − b2,4 jj
                                            1 − Pr(yijk ≤ m)

              where κm is the threshold parameter for each category such that,
                                      _
                                     pr (yijk = m) = F(km − b2,4 jj ) − F(km−1 − b2,4 jj )

                  We make a number of identifying assumptions. We assume κ0 = −∞ and
              that κ3 = ∞ and that κm > κm−1 to identify the ordinal logit model. We also use
              β1,2 = 1 and that β1,1 = F −1(Pr(city hall status = 1)) ≈ 0.166. We put a standard normal
              prior on the ξj (the latent variable estimates) and an uncorrelated bivariate normal
              prior with mean zero and variance of 10 on each of the βk = {βk,1, βk,2}. After examining
              diagnostics, we are confident that the model converged.3

              Summary of Distributions and Item Characteristic Curves
              For each indicator in the model, we can plot item characteristic curves (ICC), which
              display the probability of each indicator outcome as a function of the latent variable.
              These curves, which we plot in Figure 2, show that the most reliable indicator is
              whether or not a state of emergency has been declared, though the status of city
              hall and parks also appears to help discriminate on the latent trait.4 Because the latent
              trait appears to correspond to increasing levels of response, we refer to the latent trait
              as policy aggressiveness.5 Municipalities with the least aggressive policies close city
              halls at a rate of about 25 per cent, while the most aggressive municipalities close
              their city halls at a rate of about 80 per cent. Parks are closed by the least aggressive
              municipalities just less than 60 per cent of the time, whereas the most aggressive
              municipalities close parks at a rate of about 80 per cent. The opening and closing
              of transit operations seems to be almost completely unrelated to aggressiveness of pol-
              icy and is probably more directly related to local needs than the aggressiveness of the
              pandemic policy response. In terms of difficulty as defined above, we would say that at
              least partially closing transit is the least difficult, followed by closing parks, declaring a
              state of emergency, and fully closing transit operations, in that order.
                  Finally, the model allows us to visualize the overall distribution of aggressiveness
              in Canadian municipalities, which we do in Figure 3. The distribution appears to be
              bimodal, with one spike below the mean and one spike above—likely due to the
              importance of having declared an emergency.

Downloaded from https://www.cambridge.org/core. IP address: 46.4.80.155, on 27 Jan 2022 at 17:20:46, subject to the Cambridge Core terms of
use, available at https://www.cambridge.org/core/terms. https://doi.org/10.1017/S000842392000044X
Canadian Journal of Political Science 231
Figure 2. Item characteristic curves for the IRT model.
Downloaded from https://www.cambridge.org/core. IP address: 46.4.80.155, on 27 Jan 2022 at 17:20:46, subject to the Cambridge Core terms of
use, available at https://www.cambridge.org/core/terms. https://doi.org/10.1017/S000842392000044X232 David A. Armstrong and Jack Lucas
Figure 3. Distribution of policy aggressiveness.
Patterns of Policy Aggressiveness
Our measure of municipal aggressiveness also allows us to explore relationships
between municipal policy responses and potentially relevant features of the
Canadian local context. Here we focus on four: province, population size,
COVID-19 cases, and local ideology.
Province
Canadian municipalities exist within provincial statutory-regulatory regimes and
have been coordinating closely with provincial officials. We might therefore expect
to see variation in municipal policy responses by province. The left panel in
Figure 4 summarizes the distribution of latent aggressiveness values by province;
for each province, the thick horizontal line marks the median aggressiveness
value, and the box captures the interquartile range.6
One province, Ontario, clearly stands out from the others—a result, at least in
part, of a much higher likelihood in Ontario of having declared a municipal
state of emergency. The right panel of Figure 4 shows estimates of the average
policy aggressiveness by province with 95 per cent credible intervals surrounding
the estimates.7 Our follow-up research suggests that this difference is not a function
of provincial incentives; one Ontario mayor told us the province explicitly assured
him that funding was not contingent on a state of emergency.8 Instead, Ontario
municipalities appear to have been more inclined than others to use states of
emergency to communicate the seriousness of the pandemic to residents. They
were also more common in Ontario because of regional coordination, where every
Downloaded from https://www.cambridge.org/core. IP address: 46.4.80.155, on 27 Jan 2022 at 17:20:46, subject to the Cambridge Core terms of
use, available at https://www.cambridge.org/core/terms. https://doi.org/10.1017/S000842392000044XCanadian Journal of Political Science 233
Figure 4. Municipal policy aggressiveness by province.
Downloaded from https://www.cambridge.org/core. IP address: 46.4.80.155, on 27 Jan 2022 at 17:20:46, subject to the Cambridge Core terms of
use, available at https://www.cambridge.org/core/terms. https://doi.org/10.1017/S000842392000044X234 David A. Armstrong and Jack Lucas
Figure 5. Municipal policy aggressiveness by population size.
municipality in a region simultaneously declared a state of emergency. A combina-
tion of this “communicative” role and Ontario’s regionalized character appears to
have prompted this more widespread use of states of emergency.9
Population Size
Canada’s biggest cities are especially hard-hit by the COVID-19 pandemic. In
Figure 5, we see that larger cities are substantially more likely to have adopted
more aggressive policy responses than smaller municipalities. Despite the enor-
mous costs involved in these decisions, Canada’s biggest cities have been very
aggressive in their COVID-19 responses.10 This relationship is statistically reliable,
as 99.6 per cent of the posterior distribution of the effect is greater than 0. The esti-
mated effect (mean of the posterior distribution) is 0.149.11
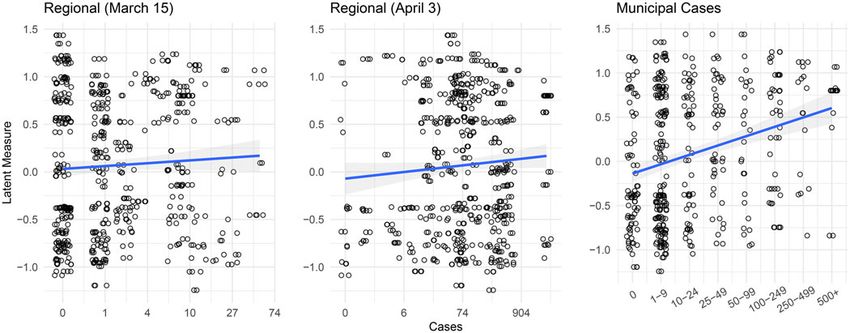
COVID-19 Cases
We might also expect municipal policy responses to be closely related to the local
seriousness of the pandemic. To explore this possibility, we matched each of our
306 municipalities to its corresponding health region—the most fine-grained geo-
graphic area for which COVID-19 case data are available. In Figure 6, we display
the relationship between aggressiveness and regional health totals up through
March 15 (when municipal responses began to ramp up) in the left-hand plot,
Downloaded from https://www.cambridge.org/core. IP address: 46.4.80.155, on 27 Jan 2022 at 17:20:46, subject to the Cambridge Core terms of
use, available at https://www.cambridge.org/core/terms. https://doi.org/10.1017/S000842392000044XCanadian Journal of Political Science 235
Figure 6. Municipal policy aggressiveness by COVID-19 cases.
Downloaded from https://www.cambridge.org/core. IP address: 46.4.80.155, on 27 Jan 2022 at 17:20:46, subject to the Cambridge Core terms of
use, available at https://www.cambridge.org/core/terms. https://doi.org/10.1017/S000842392000044X236 David A. Armstrong and Jack Lucas
Figure 7. Municipal policy aggressiveness by local ideology.
Downloaded from https://www.cambridge.org/core. IP address: 46.4.80.155, on 27 Jan 2022 at 17:20:46, subject to the Cambridge Core terms of
use, available at https://www.cambridge.org/core/terms. https://doi.org/10.1017/S000842392000044XCanadian Journal of Political Science 237
and totals up through April 3 (the beginning of the CMB survey) in the middle
plot. In both plots, we see little relationship between regional totals and municipal
aggressiveness.12 Instead, what is most obvious is the variation in aggressiveness
across the full span of case totals.
In the right-hand plot in Figure 6, we replace regional totals with municipal case
totals supplied to us by municipal politicians themselves. While these reported
totals cannot be verified against current official data, they do correspond closely
to news reports of local case totals. On this more localized measure, we see a
clear relationship between case numbers and municipal aggressiveness.13
Ideology
Finally, Figure 7 plots the relationship between policy aggressiveness and municipal
ideological complexion, which we measure using an estimate of Conservative Party
vote share in the 2015 federal election. The model was estimated with a second-
degree local polynomial regression (LOESS) model.14 Perhaps surprisingly, munic-
ipalities with middling levels of conservative vote share have the most aggressive
policy stances, on average. Conservative vote share explains about 10 percent of
the variation in aggressiveness of COVID-19 response, reliably more than the linear
model (R2= 0.01). This nonlinear relationship does not hold up when controlling
for province, however, as shown in the right-hand panel of Figure 7.
Conclusion
Understanding the factors that shape variation in municipal public policy is a
vibrant area of current research (Einstein and Kogan, 2016). In this note, we
described municipal COVID-19 responses and found that municipal population
size and local COVID-19 case totals are strongly related to municipal policy aggres-
siveness. In general, however, Canadian municipalities have responded to the pan-
demic in remarkably consistent ways.
We also found modest variation in policy responses by province and ideology.
These differences reflect features of Canadian political geography that are not yet
well understood, especially the role of regional clustering in local policy diffusion.
We thus see an important role for COVID-19 research as part of a larger agenda on
the determinants of Canadian municipal public policy.
Supplementary material. To view supplementary material for this article, please visit https://doi.org/10.
1017/S000842392000044X
Acknowledgement. The authors would like to acknowledge financial support from a SSHRC Partnership
Development Grant and from the Canada Research Chairs program.
Notes
1 See the Appendix (available online) for questions, breakdowns, and other details.
2 See https://citywatchcanada.ca/.
3 For technical details about how the model was estimated and an extended discussion about model iden-
tification and more about convergence, see the online Appendix.
Downloaded from https://www.cambridge.org/core. IP address: 46.4.80.155, on 27 Jan 2022 at 17:20:46, subject to the Cambridge Core terms of
use, available at https://www.cambridge.org/core/terms. https://doi.org/10.1017/S000842392000044X238 David A. Armstrong and Jack Lucas
4 Note that the city hall indicator has no credible interval around it because we set its value deterministi-
cally for the purposes of identification. For more on this, see the online Appendix.
5 Just with any scaling procedure, the latent variable has no inherent meaning. We treat it as policy aggres-
siveness because that interpretation is consistent with the results of the model. Again, as with any scaling
model, unless we introduce other external measures, there is no way to definitively determine the true
“meaning” of the latent variable.
6 NWT is not included in this plot because we did not receive any responses from Yellowknife, the only
municipality in NWT above 9,000 population.
7 We used Monte Carlo integration to develop these estimates. For more on this approach, see the online
Appendix.
8 See the online Appendix for detail on this follow-up research.
9 Ontario’s estimated latent aggressiveness is reliably higher than Alberta, BC, Manitoba, New Brunswick,
Newfoundland and Labrador, Nova Scotia and Quebec. In these cases, the posterior probability that
Ontario’s estimate is greater than the other province is greater than .95.
10 Given the highly skewed distribution of municipal population sizes, we use logged population size in the
figure and analysis.
11 One review suggested that the results appeared to be nonlinear and/or driven by a few outliers. To our
eyes, the seven high leverage points with log(pop) > 13.25 will be mostly offset by the six points below the
line where 12.5 < log(pop) < 13.25. The posterior probability that the adjusted R 2 of a LOESS model is big-
ger than the adjusted R 2 for the linear model is 0.738 for all of the data, 0.984 for the data where log(pop) <
13.25 and 0.7 for the data where log(pop) < 12.5. The statistically reliable result for the subset where
log(pop) < 13.25 goes away when we remove the offsetting over-predicted points 12.5 < log(pop) < 13.25.
Thus, we argue that there is little evidence of true nonlinearity in this result. The linear model coefficient
for the full data is 0.149 with posterior probability greater than zero of 0.995. The linear model coefficient
for the log(pop) < 12.5 subset is 0.172 with posterior probability greater than zero of 0.991. This would sug-
gest the linear finding is quite robust.
12 The relationships are statistically unreliable in both cases, b = { 0.029, 0.027} with 75.7 percent, 84.2 per
cent of the posterior distribution of the coefficients above zero.
13 The relationship is statistically reliable: b = 0.03 with 1.0 per cent of the posterior distribution to the left
of zero.
14 We controlled for province by residualizing the latent mean and conservative vote based on province.
For more on this see the online Appendix.
References
Einstein, Katherine Levine, and Vladimir Kogan. 2016. “Pushing the City Limits: Policy Responsiveness in
Municipal Government.” Urban Affairs Review 52 (1): 3–32.
Fox, Jean-Paul. 2010. Bayesian Item Response Modeling. New York: Springer Science+Business Media, LLC.
Cite this article: Armstrong II DA, Lucas J (2020). Measuring and Comparing Municipal Policy Responses
to COVID-19. Canadian Journal of Political Science 53, 227–238. https://doi.org/10.1017/
S000842392000044X
Downloaded from https://www.cambridge.org/core. IP address: 46.4.80.155, on 27 Jan 2022 at 17:20:46, subject to the Cambridge Core terms of
use, available at https://www.cambridge.org/core/terms. https://doi.org/10.1017/S000842392000044XYou can also read