MEASURING MOBILE NETWORK PERFORMANCE: COVERAGE, QUALITY OF SERVICE AND MAPS - JANUARY 2020 - Fratel
←
→
Page content transcription
If your browser does not render page correctly, please read the page content below
www.fratel.org

MEASURING MOBILE NETWORK
PERFORMANCE:
COVERAGE, QUALITY OF SERVICE
AND MAPS
JANUARY 2020
Table of Contents

    TABLE OF CONTENTS

    Table of contents. . . . . . . . . . . . . . . . . . . . . . . . . . . . . . . . . . . . . . . . . . . . . . . . . . . . . . . . . . . . . . . . . . . . . . . . . . . . . . . . . . . . . . . . . . . . . . . . . . . . . . . . . . . . . . . . . . .                 2

    Foreword by the Coordination Committee.. . . . . . . . . . . . . . . . . . . . . . . . . . . . . . . . . . . . . . . . . . . . . . . . . . . . . . . . . . . . . . . . . . . . . . . . . . . . 4
    Acknowledgements.. . . . . . . . . . . . . . . . . . . . . . . . . . . . . . . . . . . . . . . . . . . . . . . . . . . . . . . . . . . . . . . . . . . . . . . . . . . . . . . . . . . . . . . . . . . . . . . . . . . . . . . . . . . . . .                           5

    Synopsis.. . . . . . . . . . . . . . . . . . . . . . . . . . . . . . . . . . . . . . . . . . . . . . . . . . . . . . . . . . . . . . . . . . . . . . . . . . . . . . . . . . . . . . . . . . . . . . . . . . . . . . . . . . . . . . . . . . . . . . . . . . . . . . . . 6
    Introduction.. . . . . . . . . . . . . . . . . . . . . . . . . . . . . . . . . . . . . . . . . . . . . . . . . . . . . . . . . . . . . . . . . . . . . . . . . . . . . . . . . . . . . . . . . . . . . . . . . . . . . . . . . . . . . . . . . . . . . . . . . . 8

    CHAPTER 1: What data to collect and how to obtain it?
    Coverage and quality of service data collection and accuracy:
    overview of existing practices.. . . . . . . . . . . . . . . . . . . . . . . . . . . . . . . . . . . . . . . . . . . . . . . . . . . . . . . . . . . . . . . . . . . . . . . . . . . . . . . . . . . . . . . . . . . . . . 10

    1.1       Key definitions: coverage, quality of service, licences, etc.. . . . . . . . . . . . . . . . . . . . . . . . . . . . . . . . . . . . . . . . . . . . . . . . . . . . . . . . . . . . . . . . . . . . . 11

    1.2 Information collected by regulators. . . . . . . . . . . . . . . . . . . . . . . . . . . . . . . . . . . . . . . . . . . . . . . . . . . . . . . . . . . . . . . . . . . . . . . . . . . . . . . . . . . . . . . . . . . . . . 12

          1.2.1 Coverage. . . . . . . . . . . . . . . . . . . . . . . . . . . . . . . . . . . . . . . . . . . . . . . . . . . . . . . . . . . . . . . . . . . . . . . . . . . . . . . . . . . . . . . . . . . . . . . . . . . . . . . . . . . . . . . . . . . . . . . . . . 12

          1.2.2 Quality of service. . . . . . . . . . . . . . . . . . . . . . . . . . . . . . . . . . . . . . . . . . . . . . . . . . . . . . . . . . . . . . . . . . . . . . . . . . . . . . . . . . . . . . . . . . . . . . . . . . . . . . . . . . . . . . . . . 13

    1.3 Are the same data collected regardless of use (in a train, a car, pedestrian, indoors, etc.)? .. . . . . . . . . . . . . . . . . . . . . . . . . . . . . 15

    1.4 Data sources, their reliability and limitations. . . . . . . . . . . . . . . . . . . . . . . . . . . . . . . . . . . . . . . . . . . . . . . . . . . . . . . . . . . . . . . . . . . . . . . . . . . . . . . . . . . 15

          1.4.1 Data from operators’ networks: data from OMC meters and probes.. . . . . . . . . . . . . . . . . . . . . . . . . . . . . . . . . . . . . . . . . . . . . . . . . . . . . . 15

          1.4.2 Coverage maps’ simulation tools. . . . . . . . . . . . . . . . . . . . . . . . . . . . . . . . . . . . . . . . . . . . . . . . . . . . . . . . . . . . . . . . . . . . . . . . . . . . . . . . . . . . . . . . . . . . . . . 17

          1.4.3 Field measurement campaigns. . . . . . . . . . . . . . . . . . . . . . . . . . . . . . . . . . . . . . . . . . . . . . . . . . . . . . . . . . . . . . . . . . . . . . . . . . . . . . . . . . . . . . . . . . . . . . . . 17

          1.4.4 Consumer satisfaction surveys, complaints and reports. . . . . . . . . . . . . . . . . . . . . . . . . . . . . . . . . . . . . . . . . . . . . . . . . . . . . . . . . . . . . . . . . . . . . 18

          1.4.5 Crowdsourcing. . . . . . . . . . . . . . . . . . . . . . . . . . . . . . . . . . . . . . . . . . . . . . . . . . . . . . . . . . . . . . . . . . . . . . . . . . . . . . . . . . . . . . . . . . . . . . . . . . . . . . . . . . . . . . . . . . . 19

    CHAPTER 2: Coverage and QoS data, what for and for whom? . . . . . . . . . . . . . . . . . . . . . . . . . . . . . . . . . . . . . . . . . . . .                                                                                                                     21

    2.1 To monitor operators’ compliance with their obligations. . . . . . . . . . . . . . . . . . . . . . . . . . . . . . . . . . . . . . . . . . . . . . . . . . . . . . . . . . . . . . . . . . . . . 22

    2.2 To amplify the regulator’s capacity to take action.. . . . . . . . . . . . . . . . . . . . . . . . . . . . . . . . . . . . . . . . . . . . . . . . . . . . . . . . . . . . . . . . . . . . . . . . . . . . 24

    2.3 To inform users and stimulate competition based on the relationship between coverage, QoS and prices. . . . . . . . . . 24

    2.4 Producing a digital scorecard for the country and guiding and/or anticipating deployments. . . . . . . . . . . . . . . . . . . . . . . . . . 25

    2.5 Assessing public policies and/or investment efficiency. . . . . . . . . . . . . . . . . . . . . . . . . . . . . . . . . . . . . . . . . . . . . . . . . . . . . . . . . . . . . . . . . . . . . . . 25

2   Fratel - Measuring mobile network performance: coverage, quality of service and maps - January 2020
Table of Contents

CHAPTER 3: How to publish data in a way that serves regulatory objectives? . . . . . . . . . . . . . . . . . . . .                                                                                                             28

3.1 What “editorial choices” to make when publishing data?. . . . . . . . . . . . . . . . . . . . . . . . . . . . . . . . . . . . . . . . . . . . . . . . . . . . . . . . . . . . . . . . . . . 29

   3.1.1 How to represent data and whether to self-publish or outsource the task?.. . . . . . . . . . . . . . . . . . . . . . . . . . . . . . . . . . . . . . . . . . . . . 29

   3.1.2 What data should be displayed? And in what format?. . . . . . . . . . . . . . . . . . . . . . . . . . . . . . . . . . . . . . . . . . . . . . . . . . . . . . . . . . . . . . . . . . . . . 29

   3.1.3 Data produced by operators: whether or not to impose a format, and where to make the information available?.. 30

   3.1.4 Making it easy to superimpose/cross-reference different types of information: coverage maps, test results,
            other networks (transport, energy, points of interest…). . . . . . . . . . . . . . . . . . . . . . . . . . . . . . . . . . . . . . . . . . . . . . . . . . . . . . . . . . . . . . . . . . . . . 30

3.2 What are the main principles for ensuring a high quality publication?. . . . . . . . . . . . . . . . . . . . . . . . . . . . . . . . . . . . . . . . . . . . . . . . . . . . 30

   3.2.1 Transparency on data (how they are obtained, protocols used, collection date…).. . . . . . . . . . . . . . . . . . . . . . . . . . . . . . . . . . . . . . . 30

   3.2.2 Making the information easy for the public to understand. . . . . . . . . . . . . . . . . . . . . . . . . . . . . . . . . . . . . . . . . . . . . . . . . . . . . . . . . . . . . . . . . 31

   3.2.3 Relevant, representative and accurate aggregation. . . . . . . . . . . . . . . . . . . . . . . . . . . . . . . . . . . . . . . . . . . . . . . . . . . . . . . . . . . . . . . . . . . . . . . . . 31

   3.2.4 Publish using open data that anyone can reuse (and promote the fact). . . . . . . . . . . . . . . . . . . . . . . . . . . . . . . . . . . . . . . . . . . . . . . . . . 32

   3.2.5 Regularly refreshed data, while keeping the logs. . . . . . . . . . . . . . . . . . . . . . . . . . . . . . . . . . . . . . . . . . . . . . . . . . . . . . . . . . . . . . . . . . . . . . . . . . . . 32

   3.2.6 Enable comparisons between operators – and warn when operators’ data are not comparable. . . . . . . . . . . . . . . . . . . . . . . 32

3.3 A selection of case studies (What the experts have to say):. . . . . . . . . . . . . . . . . . . . . . . . . . . . . . . . . . . . . . . . . . . . . . . . . . . . . . . . . . . . . . . . . . . 33

   3.3.1 Arcep France’s www.monreseaumobile.fr website. . . . . . . . . . . . . . . . . . . . . . . . . . . . . . . . . . . . . . . . . . . . . . . . . . . . . . . . . . . . . . . . . . . . . . . . . . . 33

   3.3.2 Publication channels chosen by Ivory Coast regulator, ARTCI.. . . . . . . . . . . . . . . . . . . . . . . . . . . . . . . . . . . . . . . . . . . . . . . . . . . . . . . . . . . . . 34

   3.3.3 Belgian regulator BIPT’s mobile atlas. . . . . . . . . . . . . . . . . . . . . . . . . . . . . . . . . . . . . . . . . . . . . . . . . . . . . . . . . . . . . . . . . . . . . . . . . . . . . . . . . . . . . . . . . . 35

                                                                                                                                                                                                                                       3
Foreword by the Coordination Committee

    FOREWORD
    BY THE COORDINATION
    COMMITTEE

    One of the main features of today’s global digital revolution is the importance of having access
    to information while being mobile. Users want to have access to a network to be able to com-
    municate, stay informed, shop, work and be entertained, regardless of where they are, and
    especially when on the move.

    As a result, the ability to use a mobile network – whose quality is high enough to provide users
    with access to any service they want, at any given moment – has become a central issue and
    challenge in every country on the planet. This is why Fratel (the French-speaking network of
    telecommunications regulation) included the theme of mobile coverage and quality of service
    (QoS) in its 2019 action plan.

    Largely in preparation for the seminar in Douala, Cameroon, which was held on 2 and 3 April
    2019, a questionnaire on this topic was sent out to all Fratel members in early 2019. The 25 de-
    tailed responses that were received demonstrated how central this issue is for regulators. They
    expressed the need to discuss and share their experiences on this issue, which includes highly
    technical aspects and encompasses important regulatory objectives. These include region-
    al digital development, incentivising operators to invest in their networks, and making their
    country’s economy more competitive.

    Drawing on an array of mobile quality of service and measurement practices in countries that
    share French as a common language, this purpose of this document is to deliver an outline of
    current data collection, use and publication practices. It thereby sets out for authorities the
    key focal points for ensuring that mobile quality of service and coverage data are published
    under the best possible conditions.

    Mr. Sébastien SORIANO, Chairman              Mr. Diéméléou BILE, General Director of Telecom/TIC   Mr Tontama Charles MILLOGO, chairman
    of the Electronic Communications, Postal     Regulatory Authority (ARTCI) of Ivory Coast           of Electronic Communications and Postal Regulato-
    and Print media distribution Regulatory                                                            ry Authority (ARCEP) of Burkina Faso
    Authority Arcep) of France

4   Fratel - Measuring mobile network performance: coverage, quality of service and maps - January 2020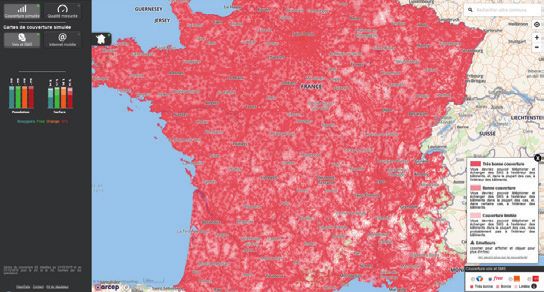
Acknowledgements

ACKNOWLEDGEMENTS

The Fratel Coordination Committee would like to extend its thanks to all of the Fratel member regulatory authorities
who contributed to the drafting, illustration, editing and proofreading of this document, and to all those authorities
who answered the questionnaire of January 2019: ARPCE of Algeria, BIPT of Belgium, ARCEP of Benin, ARCEP of Burki-
na Faso, ART of Cameroon, ARME of Cap Verde, ANRTIC of Comoros, ARPCE of Congo-Brazzaville, ARTCI of Ivory Coast,
Arcep of France, ARCEP of Gabon, ARPT of Guinea, ARN of Guinea-Bissau, ILR of Luxembourg, ARTEC of Madagascar,
AMRTP of Mali, ANRT of Morocco, ICTA of Mauritius, ARCEP of Niger, the CRA of Qatar, ANCOM of Romania, ARTP of
Senegal, OFCOM of Switzerland, ARCEP of Chad and INT of Tunisia.

This document also received precious support from the following institutions: AFD and the World Bank.

The Coordination Committee would also like to thank all of those who spoke at the Fratel seminar – held in Douala on
2 and 3 April 2019 on the topic of “Methodologies and tools for measuring mobile service coverage and quality” – for
the quality of their presentations and the quality of the ensuing discussions. This information proved invaluable when
drafting this document.

Publication Director
Sébastien SORIANO, Chairman of Arcep
Publication
Arcep for the French-speaking network of telecom-
munication regulation (Fratel)
14, rue Gerty Archimède - 75012 Paris 01 40 47 72 28 -
HYPERLINK “mailto:fratel@arcep.fr” fratel@arcep.fr
Graphism and layout
Antoine Bardelli - www.bardelli.fr
Photo credit
Arcep, ARCPE (Républic of Congo), AMRTP (Mali),
BIPT, Shutterstock/Abugrafie - I am zews, Unsplach/
Bogomil Mihaylov - Paula Lavalle - Steve Halama,
Shalom Mwenesi - linkedin-sales-navigator
February 2020
ISSN n°2258-3106
Translation with the support of AFD

                                                                                                                         5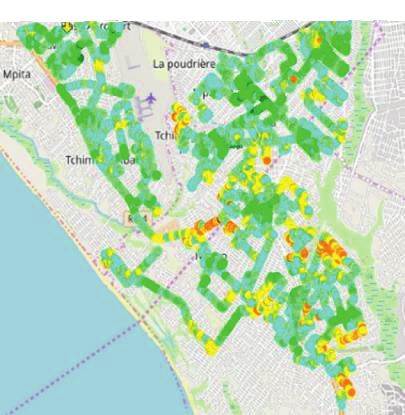
Synopsis

    SYNOPSIS

    Measuring and monitoring coverage and quality of                       What exactly is being measured? What do the terms
    service means being able to assess reality and its rep-                coverage and QoS encompass? These two notions are
    resentation. Data collection is a vital ingredient in this             sometimes confused, and need to be defined to be
    process. But which data need to be collected? How to                   able to properly assess their scope. While coverage is
    go about it? How to process the collected data and en-                 an indicator that is available nationwide, based in par-
    sure their accuracy?                                                   ticular on theoretical signal propagation simulations
                                                                           (which can then be verified by testing in the field), QoS
    These questions underscore the need to establish a
                                                                           is both a technical and subjective notion that can be
    common vocabulary on mobile coverage and quality of
                                                                           measured by more or less complex tests, whose ulti-
    service (QoS).
                                                                           mate purpose is to measure the network’s capacity to
    If the practices used to measure, simulate and estimate                satisfy the user of a service on that mobile network.
    coverage and QoS may vary, they can nonetheless be                     When tests make it possible to assess the degree of a
    summarised by four levels of testing. Namely:                          user’s satisfaction or dissatisfaction, we then refer to
                                                                           quality of experience (QoE).
    þ Utilisation of the data generated by operators’ net-
      works, notably those obtained from simulations;                      Measuring coverage means verifying whether a user
                                                                           is able to connect to their mobile network, establish
    þ Measuring technical parameters;
                                                                           and maintain a call for a set minimum period of time,
    þ Use of a network accessibility testing protocol;                     achieve a specific data transmission speed, and access
                                                                           different services. Several parameters can be used to
    þ Use of a protocol that reflects actual use.
                                                                           measure this coverage. If signal strength (signal range
    These measurements can be obtained either within a                     and quality) provides an initial indication, measuring
    controlled environment, or an uncontrolled environ-                    service accessibility (ringtone within a certain time,
    ment via crowdsourcing.                                                time it takes to download several bytes of data, etc.)
                                                                           makes it possible to obtain a more accurate represen-
                                                                           tation of coverage. By combining these different types
                                                                           of measurement we can eliminate, to some degree, dis-
                                                                           parities between operators’ stated coverage and users’
                                                                           actual experience. Providing only information on signal
                                                                           range can, on the contrary, result in a situation where
                                                                           users are unable to access services despite a location
                                                                           being covered in theory.

                                                                           As to quality of service, it can be measured using sever-
                                                                           al criteria or indicators set by the regulator. These indi-
                                                                           cators or criteria make it possible to measure voice call
                                                                           performance (accessibility, integrity, continuity) com-
                                                                           pared to benchmark thresholds. Indicators for measur-
                                                                           ing mobile internet quality are more challenging to de-
                                                                           termine, given the heterogeneousness of data services.
                                                                           Authorities can therefore measure the internet connec-
                                                                           tion success or failure rate, the average time it takes to
                                                                           establish a connection, or the success rate for connect-
                                                                           ing to a remote server, etc. These criteria can vary from
                                                                           country to country, depending on the ultimate objec-
                                                                           tives. In any event, regardless of the objectives, it is cru-
                                                                           cial that these indicators be reliable and reflect QoS as
                                                                           accurately as possible.

6   Fratel - Measuring mobile network performance: coverage, quality of service and maps - January 2020
Synopsis

    In countries where operators are subject to coverage         Depending on the country and the regulator’s prac-
    and/or quality of service obligations, QoS and cover-        tices, this delivery of information to consumers can
    age measurements enable regulatory authorities to            take various forms, such as rankings, scores by crite-
    conduct tests to ensure operators are complying with         ria, graphics, audit reports, maps and even raw data,
    those obligations.                                           supplied as open data sets, adapted to the different
                                                                 channels (online or print publication, press confer-
                                                                 ence, etc.).
Monitoring obligations is not the
                                                                 A professional observer, or a partner interested in using
sole aim of these measurements.                                  these data for publication in the form of their choosing
                                                                 (graphics or maps), will be more interested in data that
                                                                 they can repurpose. On the flipside, the dissemination
    Monitoring obligations is not the sole aim of these mea-     of QoS and coverage measurements in map form has
    surements, however. They can be used by the regulator        the advantage of providing a snapshot of QoS and cov-
    for information purposes, and to help steer the market       erage in a given geographical area, and gives consum-
    and investments. A consumer who is well informed, not        ers a clearer view than information presented in graph
    only about available products but also, and especially,      form or as raw data.
    about network quality and breadth of coverage, can
    choose the operator that best meets their expectations.
    Users’ choices can create real incentives for an opera-
    tor wanting to protect its market share. This process of
    gathering more accurate information from regulated          If the regulator wants to ensure
    players, and expanding the number of data sources,
                                                                transparency on data, it needs to
    through crowdsourcing, for instance, of more detailed
    data processing and centralising data also help amplify     make clear editorial choices on how
    the regulator’s capacity for action, notably for the pur-   to publish them
    poses of market supervision.

    QoS and coverage measurement campaigns can help
    in establishing and steering the actions of public au-       If the regulator wants to ensure transparency on data, it
    thorities and of the bodies providing funding regional       needs to make clear editorial choices on how to publish
    digital development initiatives. Findings obtained on        them, and pay particular attention to how these data
    areas where there is little or no coverage, and where        are structured. To this end, it can rely on its own exper-
    quality of service is poor, can help steer investments       tise, call on outside experts or form partnerships with
    and serve to gauge the financing that will be required       them.
    to remedy the situation.

    The audience for these findings can be relatively varied,
    and each will have their own set of expectations, so the
    way in which the measurement campaigns’ findings
    are delivered need to be tailored to each. Indeed, one of
    the most important stages is no doubt the publication
    of the findings.

                                                                                                                              7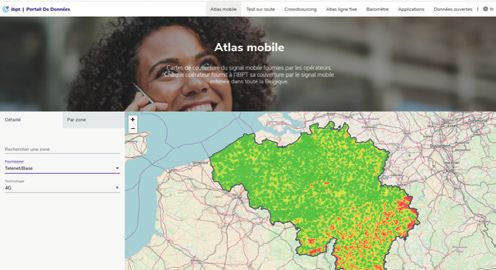
Introduction

          INTRODUCTION

          Citizens today aspire more and more to be informed,                    sultation with its members in early 2019 to assess reg-
          entertained, shop, transfer money and communicate                      ulators’ different measurement, processing and trans-
          using their mobile phone. Starting a conversation at                   parency practices.
          home and continuing it over their car’s speakers, send-
                                                                                 The number of responses received (25) testify to how
          ing out a request while travelling and using that infor-
                                                                                 important these issues are to regulators.
          mation once they arrive at their destination. Finishing
          up some work or getting a head-start while on public                   These responses helped provide a picture of the range
          transport. Getting groceries or shopping online, paying                of coverage and quality of service measurement and
          for a taxi or receiving their salary using mobile payment              data processing practices that exist. More importantly,
          solutions. All actions that are now possible on mobile                 the responses make it possible to assess the underlying
          networks, coming to complement fixed networks.                         objectives of regulators’ coverage and QoS data collec-
                                                                                 tion and processing initiatives.
          In reality, however, a distinction must be made between
          those areas where networks enable access to all of the                 A great many governments impose quality of service
          activities listed above, and those where only some of                  and/or coverage obligations, and their regulators moni-
          these activities are possible – not to mention the white               tor operators’ mandatory compliance with a set of spec-
          areas where the absence of network coverage makes it                   ifications, through a variety of actions. Depending on
          impossible to use one’s device for any form of commu-                  the regulator and the terms and conditions attached
          nication whatsoever.                                                   to licences, operators may consider the indicators to be
                                                                                 overly numerous and detailed.

                                                                                 For the regulator, measuring QoS and coverage also
    Talking about coverage and quality                                           means obtaining the means to stimulate competition
                                                                                 and steer the market in the right direction, by provid-
    of service above all means being                                             ing users with the information that will enable them
    able to assess reality through testing,                                      to choose the operator that best matches their needs,

    but also knowing how to represent it,                                        in an objective fashion. To this end, it is recommended
                                                                                 that the results be published in a way that creates in-
    through publications adapted to the                                          formed users, while not overwhelming them with tech-
    target audience.                                                             nical details. Collecting data from various sources and
                                                                                 centralising that data also creates a new market analy-
                                                                                 sis tool for the regulator.
          In a great many Fratel member countries, the mobile
                                                                                 Verifying the efficiency of investments (for international
          network was deployed gradually and enables users to
                                                                                 financial institutions and even operators), steering re-
          take advantage of the services supplied by operators, in
                                                                                 gional digital development actions, and assessing pub-
          most parts of the country. There are a number of issues
                                                                                 lic policies are all further reasons to conduct QoS and
          attached to this deployment, including: the ability to
                                                                                 coverage measurement campaigns.
          access the network anywhere in the country (coverage)
          and with a quality that is compatible with the type of                 Whatever the motivations, to be able to utilise and anal-
          use consumers want (quality of service).                               yse the collected data, their format must align with the
                                                                                 regulator’s goals. Delivering the findings in the form of
          Talking about coverage and quality of service above all
                                                                                 a map provides a snapshot of nationwide coverage that
          means being able to assess reality through testing, but
                                                                                 can be seen at a glance. Quality of service could, for in-
          also knowing how to represent it, through publications
                                                                                 stance, be represented with pictograms or colour cod-
          adapted to the target audience.
                                                                                 ing. For more informed audiences, data could be made
          Because mobile coverage and quality of service are                     available or represented using graphs that can be used
          such important issues, the Fratel network held a con-                  to analyse the situation in a given area or country.

8         Fratel - Measuring mobile network performance: coverage, quality of service and maps - January 2020
Introduction

   The purpose of this document is to lay out the state of     The aim of the first part will be to understand the no-
   the art of mobile quality of service and coverage mea-      tions and definitions surrounding the measurement of
                                                               mobile QoS and coverage, before examining the moti-
                                                               vations of the stakeholders involved in the second part.
Whatever the motivations, to be able                           The third part will focus on how to represent the col-
to utilise and analyse the collected                           lected data, and will draw attention to several key focal
                                                               points for authorities seeking to ensure transparency on
data, their format must align with                             QoS and coverage under the best possible conditions.
the regulator’s goals.

   surement, based on the experiences of Fratel member
   countries. If fixed network QoS is an equally significant
   issue, and the subject of interesting work being done
   in Fratel member countries, in this document we shall
   focus solely on mobile quality of service.

                                                                                                                           9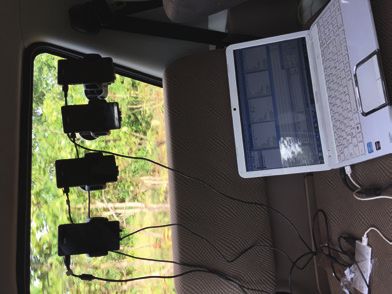
Chapter 1. What data to collect and how to obtain it? Coverage and quality of service data collection and accuracy:
     overview of existing practices

     CHAPTER 1

     WHAT DATA TO COLLECT AND HOW
     TO OBTAIN IT? COVERAGE AND QUALITY
     OF SERVICE DATA COLLECTION
     AND ACCURACY:
     OVERVIEW OF EXISTING PRACTICES

10   Fratel - Measuring mobile network performance: coverage, quality of service and maps - January 2020
Chapter 1. What data to collect and how to obtain it? Coverage and quality of service data collection and accuracy:
overview of existing practices
The exchanges that have taken place within the Fra- 1.1 Key definitions: coverage,
tel network, particularly in response to the question-
naire on mobile coverage and quality of service, led to quality of service, licences, etc.
two conclusions: first, that regulators are employing a Several key indicators are measured and verified by the
wide array of practices for estimating, simulating and different Fratel members, encompassing the notions of
measuring mobile coverage and quality of service, coverage, quality of service (QoS) and quality of experi-
depending on their imperatives (aim of the exercise) ence (QoE).
and their specificities. Despite the disparity of these
practices, all share a common goal: to obtain accurate To obtain an accurate measure of mobile coverage,
and objective data that enable regulators to qualify mobile services’ coverage maps provide a first level
the reality of operators’ deployments, and the accessi- of information. They are produced using digital signal
bility of the services being provided to users in terms propagation simulations. In addition to network prop-
of both coverage and quality. These data can come erties (antennae’s location, orientation and power, etc.),
from a range of sources, starting with operators, from they take into account the geography of the site’s sur-
regulators themselves and from third parties such rounding environment, notably relief and vegetation,
as consumers or data specialists. Next, the regulator whether there are buildings or other obstacles, without
must ensure their accuracy. necessarily defining them precisely). Produced based
on digital simulations, these maps thus provide a sim-
A host of possibilities and practices are being employed plified rendering of reality. Although theoretical, these
around the world for qualifying mobile networks. We maps give a good indication of the mobile signal’s a pri-
can distinguish four levels of testing that are used to
ori availability in a given location. They have the added
obtain coverage and quality of service data, each of
advantage of providing a snapshot of coverage across
which does not satisfy the same objectives (cf. Chapter
the entire country. Simplified also means imperfect,
II) nor offer the same advantages:
however: the maps do not constitute a guarantee of
þ utilising data collected directly from operators’ service, but rather reflect a deployment of capacity.
networks (e.g. call failure rate, usage statistics, cell
The notion of quality of service (QoS) is a technical one
towers, etc.);
that makes it possible to actually test a mobile network
þ taking a reading of or measuring one or several using a more or less demanding process. All of the tele-
technical network parameters (e.g. measuring the com service’s properties that could influence its ability
strength of the signal resulting from operators’ to satisfy the mobile service’s users are tested. The test-
base station deployments); ed service could be speed (downloading or uploading a
file), transfer time (latency or ping1 ), or reliability (packet
þ using a protocol that corresponds to a mobile net-
loss).
work accessibility test (e.g. pinging the network,
measuring speed, etc.); As defined by ITU, quality of experience (QoE) refers
to “the degree of delight or annoyance of the user of an
þ using a protocol that corresponds to an actual use
application or service”. Measuring QoE thus provides a
case representing the customer perspective (e.g.
view of a mobile network from the user’s perspective.
downloading a web page, watching a video, running
For instance, watching a video and observing any deg-
an internet speed test, etc.).
radation in quality can be qualified as measuring QoE.
In addition to the existence of these four levels of test- To measure the audio quality of voice calls, the bench-
ing, there are also several ways to collect data, regard- mark model is the POLQA algorithm defined by the
less of the level of testing being considered. Including: ITU-T P.863 standard. It is a model for measuring deg-
radation obtained from standardised sound samples.
þ measurements taken in a “controlled” environ-
This degradation is compared to the behaviour of the
ment, by technicians or people performing the
human ear to deduce the quality perceived by the end
same tests, in the same location, at the same time,
user.
using the same device;
þ measurements obtained through crowdsourcing,
both actively by users (dedicated apps) or passive-
1.2 Information collected
ly (background tasks that can be incorporated into by regulators
applications).
Fratel member national regulatory authorities (NRA)
Depending on regulators’ choices for defining and mea- employ different methods to calculate 2G, 3G and 4G
suring coverage and QoS and their data sources, these coverage, measure the quality of voice call, SMS and
different tests can be employed using both types of data data services, and monitor operators’ compliance with
collection. Regardless of the level of testing and how the their obligations. Each technique has its own set of
data are collected, all regulators want to ensure that the advantages and disadvantages. The various methods
data they collect are accurate and high quality. used to measure mobile coverage and QoS can be at-
1) A ping makes it possible to measure the time it takes for a data exchange between the phone and the network.
11Chapter 1. What data to collect and how to obtain it? Coverage and quality of service data collection and accuracy:
overview of existing practices
tributed to the coverage and QoS obligations that are toring compliance with these obligations, these regula-
imposed to solve specific problems, or by the different tors consider an area to be covered by mobile commu-
objectives that regulators have set for themselves. This nication services if there is compliance with two power
could include expanding coverage across the country, criteria combined.
especially to less dense populated areas, helping to re-
Still in the context of obligations attached to licenc-
duce the digital divide, incentivise operators to invest in
es, certain authorities may also set minimum speed
their networks, or to make the country’s economy more
thresholds, according to the technologies, to ensure
competitive.
good broadband or superfast broadband coverage.
The various coverage and QoS obligations may therefore
Lastly, in some cases, coverage measurements defined
require specific testing methods to be able to asses op-
in the specifications of frequency licences, depends on
erators’ compliance with their obligations as accurately
signal power, on the one hand, and on service accessi-
as possible. Regulator are also required to collect data
bility, on the other. This is the case in Ivory Coast, Guin-
to keep users informed about the different mobile net-
ea, Qatar and Senegal.
works’ performance, and to enable public bodies and
governments to obtain a scorecard on the status of dig- b) Service accessibility
ital tech in the country, to map out a digital blueprint
and launch network rollout schemes (see Chapter 2 for a
more detailed presentation of the objectives attached to
coverage and QoS measurements). In Senegal, to meet the 4G coverage
obligations listed in their licences,
1.2.1 Coverage coverage is measured, first, by signal
strength and, second, by the ability to
Generally speaking, a geographical area is considered
to be covered if a user, with a compatible device, can download a minimum 512 kb file at a
connect to their mobile network, establish and main- speed of at least 2 Mbit/s, in a significant
tain a phone call for a set minimum period of time, number of locations in the municipality in
achieve a specific data transmission speed, or access
question, or on the chosen roadway. The
the different services. NRAs typically measure coverage
for voice call, SMS and data services. For practical rea- download success rate must be equal to
sons, they use one or several key parameters to deter- or above 90% for a municipality or a road
mine whether an area is covered. This could mean, on to be declared covered.
the one hand, calculating the power of the received sig-
nal (signal strength and signal quality) and, on the oth-
er, testing the ability to access certain services, which
takes greater account of the user experience.
a) Measuring certain technical parameters
(signal strength and signal quality)
Because the radio signal’s properties will depend on
the technology (2G, 3G or 4G), different criteria are
used, such as RxLev (received signal level) for GSM,
RSCP (received signal code power) for UMTS and RSRP
(reference signal receive power) for LTE, to estimate
these signal strengths. In principle, this requires setting
different tiers. An area is considered covered if the set
maximum strength of field is reached.
Specific power thresholds and/or success rates can be
set, depending on the type of situation (in a car, station-
ary, indoors…) or the type of location (large cities, small-
er cities, villages and transport corridors).
In addition to signal strength, some regulatory authori-
ties, such as ANRTIC in Comoros and ANCOM in Roma-
nia, also include signal quality measurement in mobile
operators’ obligations (Rxqual for 2G, Ec/no for 3G and
SINR for 4G) to define coverage. As a result, when moni-
12 Fratel - Measuring mobile network performance: coverage, quality of service and maps - January 2020Chapter 1. What data to collect and how to obtain it? Coverage and quality of service data collection and accuracy:
overview of existing practices
If several Fratel member authorities use signal strength
to calculate voice call and internet access service cov- Radio signal strength and quality
erage, others believe that this method does not reflect do not guarantee that a mobile user
the customer experience accurately enough, and in-
stead analyse the services’ accessibility to assess wheth- will actually be able to employ the
er an area is covered. Indeed, radio signal strength and service.
quality do not guarantee that a mobile user will actu-
ally be able to employ the service. As a result, certain
authorities assess whether a location is covered using a minimum quality of mobile network for users. For
criteria that are tied more to the accessibility of the ser- other regulators, the only purpose of this information
vice being provided in that location, which corresponds is to supply end users with clear and accurate informa-
more to the user experience. This may simply involve tion, to enable them to make informed choices, beyond
verifying that there is a ring tone within 30 seconds, or just price, on the operator that best suits their needs –
the ability to download a file of several bytes of data. without creating any constraints for operators.
The results of the test are binary, so make it possible to
In addition, some regulators may set different QoS ob-
qualify an area as being covered or not covered.
ligations for different situations. Requirements for mo-
Lastly, it should be noted that some authorities impose bile use when travelling (by car, train or metro) are typ-
no coverage obligations. This is true Luxembourg, Mau- ically less demanding than those imposed on outdoor,
ritius and Madagascar. static use.
Whether for voice calls or data services, key perfor-
mance indicators (KPIs) are used to measure the ser-
While the signal value is the first step vice’s accessibility and integrity. For voice calls, however,
in measuring network coverage, it is authorities will also take the service’s continuity into ac-
count, while generally applying an average speed test
possible and, depending on the set
for data services.
goals, potentially necessary to go
further by analysing the service’s a) Calling services
accessibility.
The main performance indicators
for voice calls
1.2.2 Quality of service
Generally speaking, quality of service includes all of the
aspects of a service provided from end to end. It there-
fore depends on the performance of several pieces of
equipment (radio equipment or device used), as much
at the network core as the access network level. There
are several standards and concepts that address quality
of service. Service accessibility: Service integrity: Service continuity:
call success rate voice quality (MOS) dropped call rate/2-
minute call success rate
Regulatory authorities may define specific parameters
to measure a mobile network’s coverage and quality. If Top three QoS indicators for voice call services, by criteria
the most basic criteria may serve to determine whether
or not an area is covered (network accessibility, signal
quality or power), others are more elaborate and make
it possible to measure the various quality of service
aspects.
Every authority will be required to set their own perfor-
mance criteria and indicators according to their regu-
latory objectives, and these can differ from country to
country. The vast majority of Fratel member NRAs does
impose QoS obligations on mobile operators to ensure
13Chapter 1. What data to collect and how to obtain it? Coverage and quality of service data collection and accuracy:
overview of existing practices
Regulatory authorities generally analyse the accessibili- For service accessibility, authorities can measure the
ty, integrity and continuity of voice call services. Several internet connection success rate or rate of blocking,
measurements can be defined in each of these differ- the average time it takes to establish an internet con-
ent categories. For service accessibility, most authori- nection, the rate of successful connection within a set
ties measure call success rates. Call failure or call block- period of time (connection establishedChapter 1. What data to collect and how to obtain it? Coverage and quality of service data collection and accuracy:
overview of existing practices
1.4 Data sources, their reliability
and limitations
The data used to measure coverage and quality of service
come from several sources. These can include operators, reg-
ulators themselves via surveys, information from user com-
plaints, measurement campaigns from third parties (local
authorities, partner enterprises, associations, users through
crowdsourcing…). If various data sources are available to regu-
lators, there may also be inherent collection or reliability issues
attached to some.
To be able to utilise these data sources, regulators employ dif-
ferent collection and processing methods, to aggregate them
and ensure their accuracy, with a view to subsequent analysis.
Viewing data collected from mobile operators - AMRTP (Mali)
1.4.1 Data from operators’ networks:
data from OMC meters and probes servers on their equipment. Added to which, this in-
stallation of a data collection server can potentially be
a technically complex affair. And, finally, the process
a) Data from operation and maintenance
of ensuring the data’s accuracy requires either that
centre (OMC) meters
the regulator deploys a platform, or a post-processing
To measure performance indicators and monitor qual-
and analysis tool for the indicators. Virtually real-time
ity of service, some regulators gather network data di-
data transmission does, however, give the regulator the
rectly from operators. These can be performance files
ability to monitor the quality of mobile networks in its
that include a series of KPIs2 – generally those defined
country on a day-to-day basis, and to obtain a very large
by 3GPP or ITU – or raw data from data collection serv-
quantity of information.
ers that are connected directly to operators’ network
equipment.
Operators collect a massive quantity of data for mea-
suring and monitoring their network’s performance To measure performance indicators
and quality. Meters record a number of events, nota-
and monitor quality of service, some
bly the different requests that mobile phones send
and receive during an exchange with the network3. regulators gather network data direc-
Monitoring platforms then calculate performance cri- tly from operators.
teria based on dedicated protocols and formulas. This
also enables operators to configure and adjust the pa-
rameters of their network cells. Because these KPI are
b) Performance data files
calculated in real time, operators can intervene imme-
Authorities can recover these data through perfor-
diately when a problem is detected on the network. In
mance data files that mobile operators transmit to the
addition, thanks to these aggregated data, an operator
regulator at regular intervals, either as raw data (RAW
can analyse its network performance on a daily, weekly,
counters) or as PDFs. These files contain a number of
monthly, quarterly or annual basis.
KPIs established by operators’ OMC meter databases.
Although abundant and relevant for regulators, the in- Each operator uses its own formulas for processing
formation obtained from operators’ networks reflects these data and ensuring their accuracy. Operators
the operator’s viewpoint and network performance, generally adopt formulas provided by equipment sup-
and not necessarily the customer experience and their pliers, which comply with international requirements.
ability to use the network (end to end view). Moreover, Depending on the equipment supplier, the KPIs will
the right to collect data will depend on the legal frame- not be identical, however, which raises the issue of the
work put into place in each country: depending on ex- comparability of the different operators’ data. This infor-
isting regulations, it may be difficult (if not impossible) mation is then verified by the regulator and the data’s
to require operators to transmit this information to the accuracy ensured by cross-referencing them with field
regulator, or to install the regulator’s data collection measurements, for instance (see 1.4.3).
2) For instance: regarding network availability, rate of blocking, dropped call rate, call success rate and their progression, intra-cell handover success rate, interfer-
ence, radio channel traffic congestion…
3) These meters are located at the BTS (2G) and Node B (3G)/e-Node B (4G) level. Raw data files are transmitted to the BSC/RNC which aggregate them and send
them to the OMC platforms. The RNC (radio network controller) is an access component in a 3G UMTS mobile telephone network. It is the equivalent of a 2G GSM
network’s BSC (base station controller). It controls the base stations’ (Node B) radio transmissions and interfaces with the mobile operator’s core network.
15Chapter 1. What data to collect and how to obtain it? Coverage and quality of service data collection and accuracy:
overview of existing practices
Graphic of data collection of operators’ OMC servers
c) Data collection servers in the network software makes it possible to calculate theoretical pre-
Operators may also install OMC data meters directly on dictions of geographical and population coverage rates,
the data collection servers, installed on their networks both nationwide and on a regional and local scale.
at the regulator’s request These data are then sent to This therefore enables authorities to produce coverage
another server located on the regulator’s premises, maps and verify that they are consistent with operators’
using secure links. These raw data, in CSV or HTML maps, to verify compliance with coverage obligations
format, are analysed, fed into the database by the au- and to ascertain the coverage level in an area before
thority which, thanks to a reporting system, can issue scheduling a measurement campaign in the field. That
requests and produce its own indicators, regardless of said, the regulator must have the right technical exper-
which equipment supplier operators use. Here, it is the tise to use coverage maps’ simulation tools, which re-
regulator which, based on raw data, must ensure the quires it to train its staff.
data’s reliability using a post-processing tool. This gives
In any event, this is not necessarily relevant for every au-
the regulator a more detailed understanding of oper-
thority, notably in those countries where operators do
ators’ QoS, and it can compare its own KPI with those
not produce coverage maps.
calculated by operators.
The feedback obtained from Fratel members revealed
d) Probes that only three authorities (Burkina Faso, France and
Probes create the ability to collect all of the streams Morocco) have such a simulation tool.
traveling over a data interface, whether traffic or sig-
nalling. Operators use this technology to collect a max-
imum amount of information (to monitor a particular
procedure or a specific mobile phone, for instance).
The volume of the data to be collected, stored and
processed is substantial. Depending on the existing
legal framework in their country, some regulators can
require operators to install probes at traffic nodes to
log the volume of calls (to verify operators’ revenue,
whether for international or interconnection traffic) or
to collect certain QoS indicators that can be extracted
through these probes that regulators use, such as call
completion rates. This solution can only serve as a com-
plement to other data sources, to assess an operator’s
overall quality of service, and is not suitable for monitor-
ing coverage.
1.4.2 Coverage maps’ simulation tools
Regulators can use software to verify, simulate and ob-
Results of data collection for 3G voice. Source : ARPCE
serve operators’ theoretical coverage. In particular, this
(Republic of Congo)
16 Fratel - Measuring mobile network performance: coverage, quality of service and maps - January 2020Chapter 1. What data to collect and how to obtain it? Coverage and quality of service data collection and accuracy:
overview of existing practices
þ Data analysis requires several weeks of processing.
The regulator must have the right The information that regulators will potentially pub-
technical expertise to use cove- lish only reflects the network’s status a few weeks
before that information is published. Added to
rage maps’ simulation tools, which which, it is difficult to conduct very frequent cam-
requires it to train its staff. paigns (the rate for most regulators is once a year).
The resulting findings that are displayed are there-
fore several months old in many cases.
1.4.3 Field measurement campaigns
For the vast majority of Fratel network members, the
main source of data for measuring and monitoring the
It should also be noted that these sur-
coverage and quality of service provided to operators’
customers is field measurement campaigns. veys can apply to different networks,
notably when some form of network
These campaigns are generally carried out by an in-
dependent, outside service provider, overseen by the sharing is involved.
regulator, and using protocols and criteria agreed upon
with operators, to guarantee accuracy. They can either
When the aim is, for instance, to verify
be financed by the regulator or by operators them-
selves. It should also be noted that some regulators
an operator’s deployments, testing
have acquired their own hardware, and conduct these will be confined to just that network.
field campaigns themselves. But when the purpose is to verify the
The scope of the measurement campaigns and the accuracy of its maps, or customer
procedure’s complexity will vary, depending on the QoE, measurements will also include
criteria set for defining coverage (only outdoors or in
situations where the user is roaming.
several locations and situations. It should also be noted
that these surveys can apply to different networks, no-
tably when some form of network sharing is involved.
Regardless of the country, however, the process of an-
alysing QoS requires a large number of data, as a num-
ber of location-related use cases need to be taken into
1.4.4 Consumer satisfaction surveys,
account: indoors, on transportation (car, train, metro,
complaints and reports
etc.), on specific transport corridors (motorways and
main roads, high-speed trains, commuter trains, etc.), Regulators have traditional tools and technical and eco-
in different types of area (urban, suburban, rural) and nomic indicators that contribute to their knowledge of
covering both stationary and mobile use. the market. To round out this approach, and create the
There are several limitations and challenges inherent in ability to detect weak signals, they can develop a more
field campaigns: detailed understanding of users and the problems they
encounter.
þ Financially, they are relative costly, which restricts
the possible number of measurements that can be The first possible path is a user survey. This solution of-
taken to verify mobile coverage and measure QoS; ten makes it possible to better identify the issues that
users are encountering in their dealings with the sector.
þ To ensure the process’s accuracy, it is vital that reg-
ulatory authorities and operators agree on the mea- Beyond that, incident reports, particularly those sub-
surement protocol. Using an independent outside mitted by users, are an efficient way to develop a more
company to perform these tests may also reduce the detailed view of difficulties in the sector. By drawing
risk of disagreements, provided their protocols are lessons from users’ actual experience and their habits,
robust and mastered or approved by the regulator; regulators can look at recurring malfunctions that us-
ers encounter, and detect peak times to build a body
þ Compared to simulated coverage maps, field mea- of evidence that will help direct their actions, and de-
surement provides only information on a specific vise systemic solutions for improving the way the sec-
location at a given moment in time. And given the tor functions. A system for submitting reports can be
time and cost it takes to perform these tests, it is created by making a freephone number available to
unreasonable to plan on testing every centimetre of consumers, as is the case in Mali, or an online reporting
the country; platform, as is the case in France.
17Chapter 1. What data to collect and how to obtain it? Coverage and quality of service data collection and accuracy:
overview of existing practices
The results can also be more or less relevant depending
on the testing methods used. They depend to a large
extent on users’ capacity and desire to perform these
tests, and therefore on their devices, their mobile plan’s
data allowance, their ability to access the network to
perform the test and transmit the results, etc.
These measurements can, however, provide a useful
complement to those obtained in a controlled environ-
ment, creating a larger volume of data, from different
parts of the country and on a more regular basis. They
can thus help feed the regulator’s work and the process
of keeping citizens informed, creating a dialogue with
the controlled environment’s more representative data.
Certain regulators, such as those in Belgium, Burkina
Faso, Ivory Coast, Luxembourg, Qatar, Tunisia and Mo-
rocco, rely on or plan to rely on their own crowdsourcing
apps to collect additional information. One alternative
solution could be to establish partnerships with third
parties that specialise in crowdsourcing solutions, to
Drive-test data collection. Source AMRTP (Mali) share or obtain data that can supplement those ob-
tained through testing in the field.
Customer complaints and reports thus make it possible
to satisfy two of the regulator’s objectives at once: first,
to deepen their knowledge of users and the reality in
the field and, second, to better inform those users. Consumer satisfaction surveys,
Consumer satisfaction surveys, along with collecting
along with collecting consumer
consumer complaints and reports are an additional complaints and reports are an
and valuable source of information for regulators. How-
ever, setting up an online reporting platform or a ded-
additional and valuable source
icated number, or conducting satisfaction surveys can of information for regulators.
require substantial financial and human resources. The
lessons that the regulator can draw from this informa-
tion requires in-depth analytical processing. These data In addition to the technical and financial impediments
on their own cannot enable the regulator to analyse to developing a crowdsourcing app in-house, there is
network quality of service and coverage. the issue of representativeness, of analysing and en-
suring the reliability of the data collected from differ-
ent phones, in situations that are not always specified
1.4.5 Crowdsourcing
(indoors, in a car, etc.). Added to which the information
Quality of service can also be monitored using crowd- being sent back will be coming chiefly from areas with
sourcing solutions. These solutions use a different sufficiently good coverage, and do not provide a view
approach to quality monitoring in a controlled envi- of white or grey areas. However, based on aggregation
ronment: tests are conducted on a user’s device, typi- and bias reduction criteria, these data can prove a useful
cally using an app. The environment is thus no longer complement to those collected directly by regulators.
“controlled” and there is no longer a guarantee of com-
parability for different operators’ test results (different
devices, testing apps, type of tests, testing conditions,
etc.) – unlike the results obtained through a more close-
ly supervised measurement campaign.
18 Fratel - Measuring mobile network performance: coverage, quality of service and maps - January 2020Chapter 1. What data to collect and how to obtain it? Coverage and quality of service data collection and accuracy:
overview of existing practices
ARCEP in Burkina Faso: experience with data
sources and the accuracy of mobile network
coverage and quality of service data
Data sources The choice to tap into crowdsourcing solutions
comes from ARCEP’s desire to put users at the heart
There are three sources of mobile network coverage of the quality improvement process. The customer
and quality of service data: perspective this solution delivers enables us to better
steer our actions, and to provide users with reliable
The regulator (ARCEP) information on the quality of the networks where
We collect data through quarterly campaigns and an- they live.
nual drive testing.
Operators
Satisfaction surveys are also an important data source.
They make it possible to asses users’ perception of the Network operators’ data gives us an idea of network
quality of the services being provided. performance. Operators also have radio planning tools
for performing coverage simulations, which they share
ARCEP has a radio planning tool for performing nation- with ARCEP.
al and population coverage simulations, to satisfy white
areas’ coverage needs.
Users
These different data sources complement one anoth- Users provide a treasure trove of valuable information,
er, and enable ARCEP to reap the benefits of each. through the use of crowdsourcing tools to collect QoE
We also have a global view of operators’ networks’ data, as well as the complaints that the regulator re-
performance, of quality of service and network users’ ceives through various channels.
quality of experience, which helps to channel the ac-
tions we take to improve QoS.
19Chapter 1. What data to collect and how to obtain it? Coverage and quality of service data collection and accuracy:
overview of existing practices
Pros and cons of the different data sources
Collection tools Pros Cons
QoS-oriented and simulation of
High costs, long time to execute,
different measurement conditions,
Drive testing provides only partial and time-
objective assessment of voice and
specific view of QoS
service quality
KPIs dependent on equipment
suppliers, network performance-
Collecting data on the entire
oriented data, and not QoS/QoE,
Data network network, low cost and automatic
no data from not-spots, data can
process
be manipulated by operator or
equipment supplier
Need to have a smartphone,
Large quantity of data, need to implement an
Crowdsourcing information reflects users’ efficient communication plan,
quality of experience representativeness of the
sample
Global and consolidated view of Need to calibrate prediction models
radio coverage, ability to determine for greater precision, possible
Radio planning tool/coverage
white areas, ability to correct disparities between predicted
map simulation tool
coverage maps via other data theoretical data and actual data
sources from the field
User satisfaction survey Customer viewpoint Subjectivity of opinions
Ensuring data accuracy
Collection tools Ensuring data accuracy
à Determine a representative sample for each type of service, usage, condi-
tions of use, etc.
Drive testing à Guarantee that measurement tools function correctly
à Define a test protocol according to usage, conditions of use, etc.
à Collect raw data from operators’ networks
Data network à Use standard formulas for calculating KPIs
Crowdsourcing à Involve all players to enable massive data collection
à Use other data sources (drive testing, crowdsourcing…) to cement cover-
Radio planning tool age maps’ accuracy
à Use calibrated prediction models
User satisfaction survey à Determine a representative sample
20 Fratel - Measuring mobile network performance: coverage, quality of service and maps - January 2020CHAPTER 2. Coverage and QoS data, what for and for whom? CHAPTER 2 COVERAGE AND QOS DATA, WHAT FOR AND FOR WHOM?
CHAPTER 2. Coverage and QoS data, what for and for whom?

     It is essential for regulators to perform coverage and
     quality of service tests, which fall under the important
     issues and challenges of connectivity:

     þ Improving mobile coverage nationwide (to ensure
       an increasingly large percentage of the population
       has access to services, including in those locations
       that operators do not “naturally” cover, such as roads
       and less dense populated areas);

     þ Improving quality of service for citizens and busi-
       nesses alike: this can be achieved through rollout
       obligations (e.g. written into licences), but also
       through the information provided to users, enabling
       them to make informed choices and so steering the
       market and rewarding operators’ investments.

     Measuring coverage and QoS can therefore satisfy a va-
     riety of objectives: monitoring rollout obligations, trans-
     parency, investment choices… These objectives guide or
     can justify the use of different methods, which is why it
     is advisable to have a clear idea of those objectives to be
     able to define exactly what type of testing will make it
     possible to obtain reliable information on the networks’
     true status.
                                                                            to ensure that users have access to at least a minimum,
     2.1 To monitor operators’                                              satisfactory quality of service.

     compliance with their                                                  Of the Fratel members who answered the question-
                                                                            naire, the vast majority also impose quality of ser-
     obligations                                                            vice obligations on operators. This results from the
     The first, and most natural, lever to impose on opera-                 fact that broadband and superfast broadband net-
     tors – to deploy their services and improve their mobile               works, which are able to deliver a minimum speed
     coverage – is that of obligations attached to frequency                and good quality of service for voice and data ser-
     licences. Through these obligations, the regulator seeks               vices, are severely underdeveloped in some countries.

        More and more countries are adapting their approach to regulation by adopting
        data-driven regulation. The idea is to be able to leverage the power of information
        to steer the market in the right direction. In practice, this involves collecting more
        detailed information from market stakeholders, and diversifying data sources. This
        in turn amplifies the regulator’s capacity to take action, notably when seeking to
        supervise and monitor obligations, create informed users, better steer the market
        and reward investments, but also to obtain a more accurate diagnosis of the
        situation across the country, and to track investments.

        Regulators are adapting their collection and use of data depending on their
        regulatory objectives. This process must not be confused with mere transparency.
        It is a veritable regulatory tool. Regulators must be involved to define priorities
        and underscore certain parameters in particular, standardise certain notions and,
        if appropriate, centralise information.

22   Fratel - Measuring mobile network performance: coverage, quality of service and maps - January 2020
You can also read