Mechanical Imaging of a Volcano Plumbing System From GNSS Unsupervised Modeling - horizon ird
←
→
Page content transcription
If your browser does not render page correctly, please read the page content below
RESEARCH LETTER                            Mechanical Imaging of a Volcano Plumbing System From
10.1029/2020GL089419
                                           GNSS Unsupervised Modeling
Key Points:
• Unsupervised GNSS modeling               François Beauducel1,2        , Aline Peltier1,3    , Antoine Villié4     , and Wiwit Suryanto5
  offers fast detection and volume
  estimate of migrating magma              1 Institutde physique du globe de Paris, Université de Paris, CNRS, Paris, France, 2 Université Grenoble Alpes,
• Deformation source modeling
                                           Université Savoie Mont Blanc, CNRS, IRD, IFSTTAR, ISTerre, Grenoble, France, 3 Observatoire Volcanologique du Piton
  draws a mechanical tomography of
  the volcano internal substructures       de la Fournaise, IPGP, La Réunion, France, 4 Laboratoire de biométrie et biologie évolutive, CNRS UMR, Villeurbanne,
• Full model space Bayesian                France, 5 Geophysics Research Group, Universitas Gadjah Mada, Yogyakarta, Indonesia
  inversion serves as a robust
  real-time monitoring tool
                                           Abstract Identification of internal structures in an active volcano is mandatory to quantify the
Supporting Information:
                                           physical processes preceding eruptions. We propose a fully unsupervised Bayesian inversion method that
• Supporting Information S1                uses the point compound dislocation model as a complex source of deformation, to dynamically identify
• Movie SI                                 the substructures activated during magma migration. We applied this method at Piton de la Fournaise.
                                           Using 7-day moving trends of Global Navigation Satellite System (GNSS) data preceding the June 2014
Correspondence to:                         eruption, we compute a total of 15 inversion models of 2.5 million forward problems each, without a priori
F. Beauducel,                              information. Obtained source shapes (dikes, prolate ellipsoids, or pipes) show magma migration from
beauducel@ipgp.fr
                                           7–8 km depth to the surface, drawing a mechanical “tomography” of the magma pathway. Our results also
                                           suggest source geometries compatible with observed eruptive fissures and seismicity distribution. In case
Citation:                                  of finite magma volume involved in final dike injection, source volume estimates from this method allow
Beauducel, F., Peltier, A., Villie, A.,
& Suryanto, W. (2020). Mechanical
                                           forecasting volumes of erupted lava.
imaging of a volcano plumbing system
from GNSS unsupervised                     Plain Language Summary Imaging the interior of an active volcano and estimating volumes
modeling. Geophysical Research             of magma present at depth are major challenges of eruption anticipation. In this work we propose an
Letters, 47, e2020GL089419. https://
doi.org/10.1029/2020GL089419               effective method of data processing that combines a mathematical model of the potential source at depth
                                           and standard ground deformation measurements at the surface in a fully automated process that has been
                                           implemented as a real-time monitoring tool to anticipate eruptions at Piton de la Fournaise volcano. The
Received 19 JUN 2020
Accepted 16 AUG 2020
                                           method is sensitive to magma migration, highlighting the magma pathway, like a scanner that displays
Accepted article online 21 AUG 2020        a 3-D image of the volcano plumbing system. In specific circumstances, this method can be used also to
                                           forecast volumes of erupted lava.

                                           1. Introduction
                                           Active volcano edifices can deform due to fluid migration and storage into their so-called plumbing
                                           system, an interconnected network of internal volumetric substructures like reservoirs, conduits, or
                                           sills/dikes (Tibaldi, 2015). Indeed, fluid dynamics into the plumbing system involves mechanical constraints
                                           (pressure, volume, or stress variations) that are applied to the internal boundaries of the medium, induc-
                                           ing deformation that usually reach the free ground surface. As a result, monitoring volcano deformation
                                           is commonly used to detect the subtle warning signals of a volcanic eruption linked to the pressurization
                                           of magma body or magma transfers at depth (see Dzurisin, 2003 for a review and Segall, 2010 for method
                                           limitations). Furthermore, inversion of the geodetic data with mechanical models has natural capability to
                                           locate the pressure source in depth and to quantify its characteristics from surface observations, notably its
                                           volume variation that can be an estimate of magma volume in depth (see, for instance, Anderson et al., 2010;
                                           Beauducel et al., 2004; Cayol & Cornet, 1998; Peltier et al., 2016; Toutain et al., 1992). Any quantitative
                                           volcano model needs boundary conditions, in particular those common to the magma fluid dynamics and
                                           the volcano mechanical behavior, that is, the plumbing system geometry. Imaging these structures using
©2020. The Authors.
This is an open access article under the   various tomography methods has the main goal of describing, in a more quantitative way than geological
terms of the Creative Commons              approaches, the internal structures, which might be used in other geophysical or geochemical dynamic mod-
Attribution License, which permits         eling as a priori information. In this context, the characterization of the magma feeding system (location,
use, distribution and reproduction in
any medium, provided the original          volume, shape, etc.) with short-term and reliable quantitative parameters is also an important prerequisite
work is properly cited.                    for understanding and anticipating any eruptive activity.

BEAUDUCEL ET AL.                                                                                                                                         1 of 9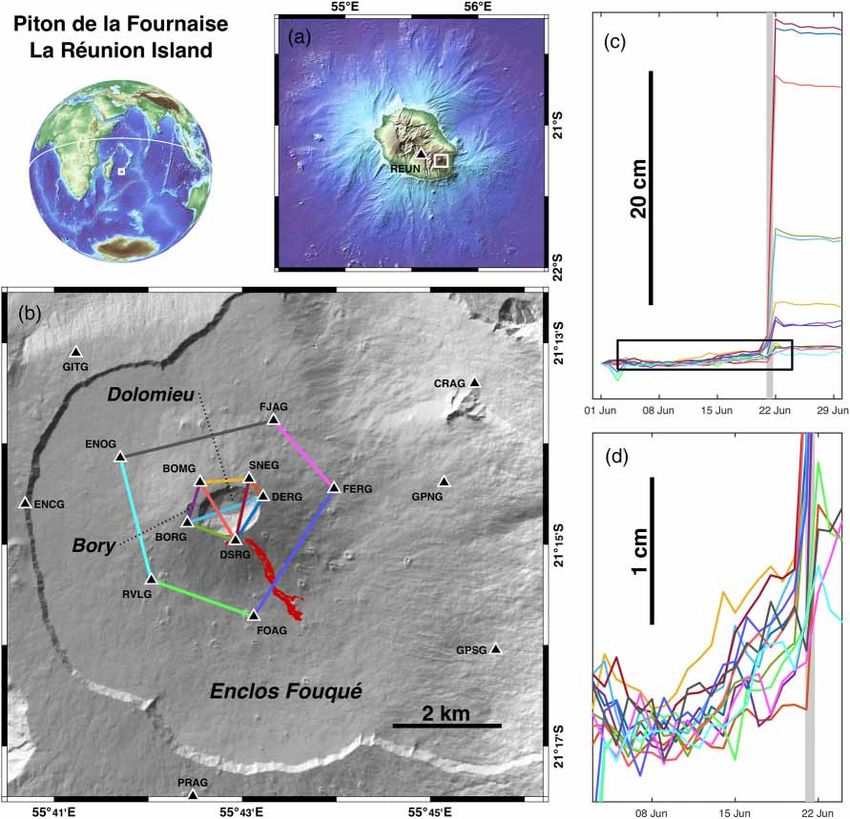
Geophysical Research Letters                                                         10.1029/2020GL089419

Figure 1. (a) Location map of La Réunion Island and reference station; (b) Zoom on the most active part of Piton de la Fournaise and summit craters. GNSS
permanent stations (black triangles), June 2014 lava flows (solid red patch), and selected baselines (color solid lines) are shown; (c) baseline variations
(i.e., distance changes between pairs of stations) on the preeruptive, coeruptive, and posteruptive periods (same colors as in b); (d) zoom on the preeruptive
precursory baseline variations. Gray area indicates eruption time. Topographic data from ETOPO1, SRTM, SHOM, and RGEALTI IGN 2016.

                                        In this work, we follow the magma circulation and/or accumulation in depth by locating and quantifying
                                        pressurization sources in space and time using unsupervised deformation source modeling from Global
                                        Navigation Satellite System (GNSS) observations at Piton de la Fournaise (PdF, La Réunion Island, Indian
                                        Ocean, Figure 1a). We introduce here the innovative term of mechanical tomography, since the method uses
                                        magma ascent as an active source that progressively illuminates the complex magma plumbing system and
                                        finally gives an image of the internal substructure geometries that have been activated during the PdF unrest.
                                        PdF is a 2,632 m high active basaltic volcano, often in eruption with an average of two eruptions per year since
                                        the creation of the Observatoire Volcanologique du Piton de la Fournaise (OVPF/IPGP) in 1979. Recent erup-
                                        tions mainly occured inside an uninhabited caldera, called Enclos Fouqué, where a terminal cone topped
                                        by two craters (Bory and Dolomieu), gradually built up (Figure 1b).
                                        The location and the shape of the shallow magma reservoirs below the volcano are still debated even if
                                        recent geodetic, seismic, and geochemical studies converge toward a conceptual model of a plumbing system
                                        constituted of several reservoirs, variably connected and distributed from 10 km depth to the near-surface
                                        (Battaglia et al., 2005; Boudoire et al., 2019; Di Muro et al., 2014; Peltier et al., 2009). Passive S and P wave

BEAUDUCEL ET AL.                                                                                                                                           2 of 9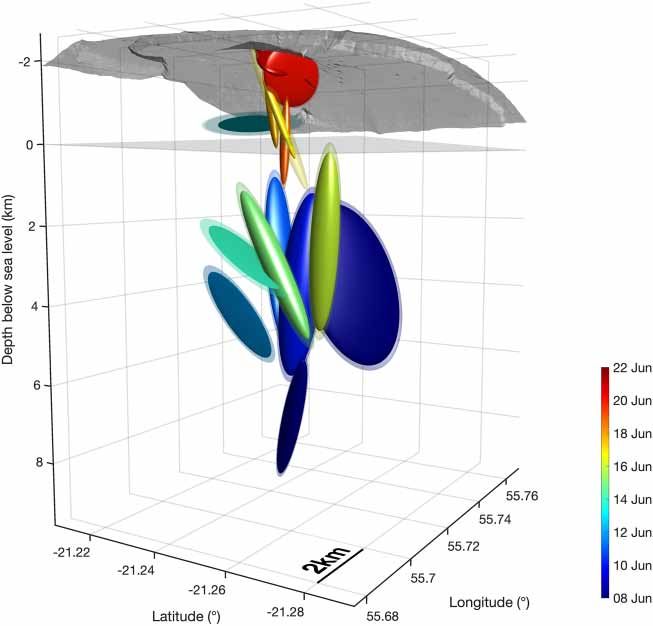
Geophysical Research Letters                                                   10.1029/2020GL089419

                   tomographies made on PdF, using ambient seismic noise and P wave first arrival times for earthquakes,
                   respectively, show (1) a high S wave velocity zone from 0.7 to 1.6 km above sea level, a.s.l. below the terminal
                   cone interpreted as a preferential path for magma injections (Brenguier et al., 2007) and (2) a high-velocity
                   plug at sea level, under the summit craters, interpreted as an intrusive, solidified dike-and-sill complex
                   with little fluid magma storage (Prôno et al., 2009). Two low P wave velocity anomalies, which may high-
                   light magma reservoirs, are found from 0 to 1 km a.s.l. and from 1 to 2 km b.s.l. (Prôno et al., 2009). At
                   greater depth, spatiotemporal distribution of the seismicity may evidence the presence of a deeper reservoir
                   at around 7.5 km depth below sea level (b.s.l.) (Battaglia et al., 2005; Peltier et al., 2009).
                   The long-term preeruptive edifice inflation is often of very low amplitude at PdF (often less than 5 cm in
                   one month; e.g., in Peltier et al., 2016, 2018). On 9 June 2014 (all dates and times UTC), after an unusu-
                   ally long period of 41 months of dormancy and slow deflation, PdF showed signs of unrest with the start
                   of a slow edifice inflation and an increase of the shallow (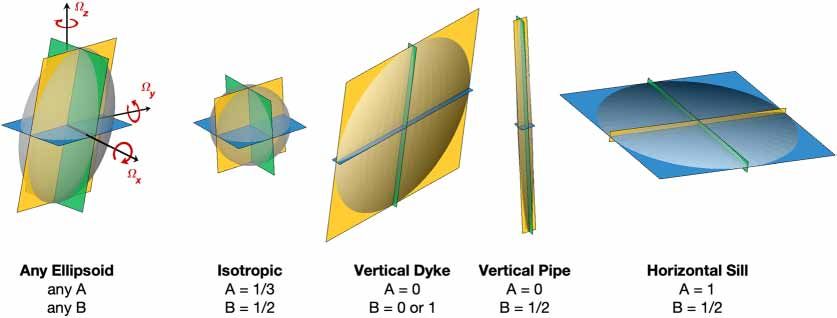
Geophysical Research Letters                                                      10.1029/2020GL089419

                   Figure 2. pCDM dislocation plans and rotation angles definition. Example of source shapes and the associated A and B
                   values. Surface of each point dislocation is enlarged to be proportional to its associated volume variation.

                                                                            dVZ
                                                                       A=       ,                                                  (2)
                                                                            ΔV

                                                                           dVY
                                                                   B=             ,                                                (3)
                                                                        dVX + dVY

                   where ΔV is the total volume variation of the source, A is the horizontal over total volume variation ratio,
                   and B is the vertical volume variation ratio.
                   The pCDM is able to approximate any shape of magma bodies, as dikes, sills, oblate, prolate, and other tri-
                   axial ellipsoidal shapes (see some examples with corresponding A and B values in Figure 2), and is only
                   relevant at far-field observation points because of the point source approximation. Even if simple, this
                   model is particularly well adapted for real-time monitoring as it gives a first-order estimation of the volume
                   and shape of the source(s) at the origin of the surface displacements, yet is still easy to implement in an
                   inverse problem.
                   We also rewrote the original pCDM code in a fully vectorized way (Matlab/GNU Octave and C languages) in
                   order to make it compatible with fast inversion with millions of forward problems, and allow formulations
                   to approximate topographic effects (varying-depth method proposed by Williams and Wadge (1998), that is,
                   adjusting the source depth at each observation point using station elevation), and express the source depths
                   relative to sea level.
                   2.3. Inverse Problem
                   In order to obtain a description as objective as possible of the volcano internal structures responsible for
                   the surface displacements, we minimize the a priori information and explore the entire space of the nine
                   model parameters using the GNSS trends as observation data. As a first result of this unsupervised inversion
                   method, we represent the model space probability as a function of source location, to display all solutions
                   that are consistent with observations (Tarantola, 2006). Identification of a single volume zone with higher
                   probabilities confirms the existence of a cluster of good models, a mandatory condition to possibly select
                   one best model.
                   Since exhaustive grid exploration of the full model space is not reasonable with nine parameters, we use a
                   Monte Carlo Bayesian parallel algorithm with five iterations, each using 500,000 forward problems randomly
                   chosen in the model space with possible reduction of search interval between iterations. Each iteration per-
                   forms uniform sampling except for horizontal position for which we use a normally distributed sampling
                   centered at the summit with a 5-km standard deviation radius. This a priori information improves the inver-
                   sion performance as we are expecting source in the neighborhood of the summit area but does not exclude
                   any possible distant nor deep source location. Misfits are calculated using the L1 norm between observed
                   and modeled data. For each iteration, if the marginal distribution has a single significant maximum proba-
                   bility mode, the process selects a smaller range for this parameter with higher probability to constrain the

BEAUDUCEL ET AL.                                                                                                                 4 of 9
Geophysical Research Letters 10.1029/2020GL089419
best models for the next iteration. A posteriori uncertainties of the best model solution are then given by
the interval of variation over each parameter that keeps 68% (1 standard deviation) of the highest model
probabilities for all the iterations, a total of 2.5 million forward models.
Since the method uses a single source as forward problem, only the dominant source, that is, the one that
induces the maximum amplitude displacements at surface, will be identified by the inverse problem. As
a consequence, the main source of deformation might hide other simultaneous active sources of lower
amplitude, eventually with opposite sign of volume variation.
3. Results
First signs of inflation at PdF appeared on 9 June 2014 (Figures 1c and 1d), and accelerated after 13 June,
with a summit extension well visible on the DSRG-SNEG baseline (see dark red line in Figure 1d). The
amplitude of the ground deformation preceding the 20 June 2014 eruption remained particularly low, that
is, less than 1 cm of horizontal cumulative displacements and about 2 cm maximum of vertical cumulative
displacements recorded on the summit stations in 11 days. These low intensity of surface observations makes
this eruption a good case study for developing high-sensitivity modeling methods.
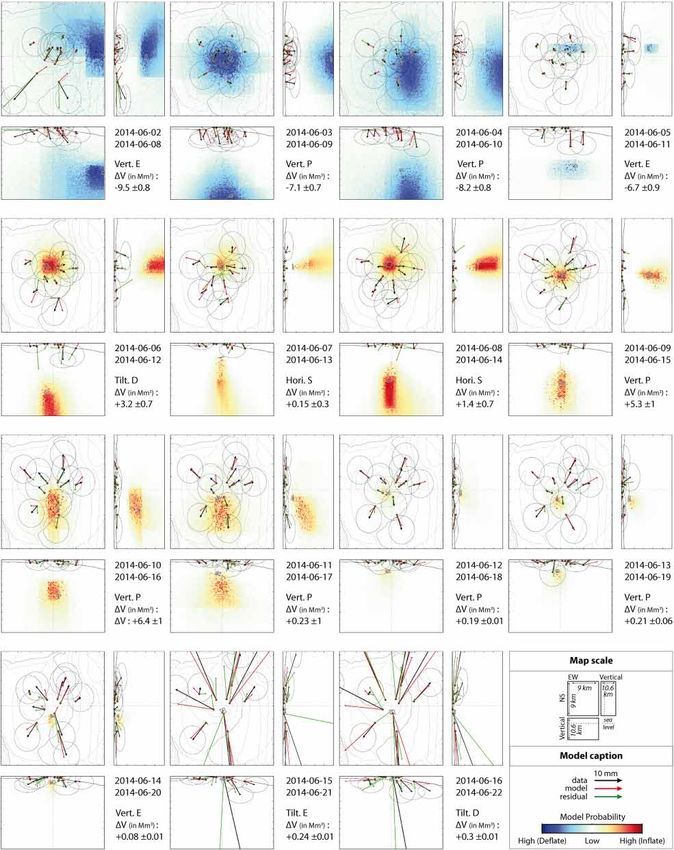
Results of the inversion modeling for 15 periods (12 before and 3 after the eruption) of 7 day sliding sample
window provide the position and the shape of the pressure source through time. Figure 3 shows results of
each inversion like a full description of the model space probabilities as marginal distributions in horizontal
and vertical projections (see also Table S1 in the supporting information). Three distinct preintrusion phases
(Phases 1–3) before the final dike propagation to the surface (Phase 4) can be distinguished.
(1) For the windows spanning 2–8, 3–9, 4–10 and 5–11 June, no well-constrained source can be found but
probable deep deflation diffuse sources seem to be present below the terminal cone.
(2) Inflation sources appeared and became more consistent from the 6–12 June period with a narrower
range of models and a best inflation source located at 4.5 km b.s.l., i.e. about 7 km below the summit,
with a tilted dike shape. The inflation pressure source, the shape of which evolves from a dike to a
pipe, remained deep (0 to 3 km b.s.l.) until 16 June.
(3) From the 11–17 June to the 13–19 June periods, when the deformation rate accelerated, the inflation
source was shallower, located between 0.7 and 1 km a.s.l. (i.e., between 1.8 and 1.5 km below the sum-
mit). The last pressure source modeled before the eruption, for the period spanning 13 to 19 June,
displayed a volume variation of +210,000 m3 .
(4) On 20 June, the 1 hr and 16 min seismic crisis associated with rapid ground deformation(Figure 1c)
marked the final magma dike propagation to the surface that fed the eruption. The shape of the dike
appeared in our models only from the 16–22 June sliding window. For the two previous periods (14–20
June and 15–21 June), the best models were ellipsoid sources, probably because of the influence of
two sources (the preeruptive source and the final dike) associated with the integrating effect of the
7-day trend calculation. Volume variations for the two last coeruptive periods (15–21) and (16–22)
were relatively constant, with values of +230,000 m3 and +300,000 m3 , respectively.
4. Discussion
Even withGeophysical Research Letters 10.1029/2020GL089419 Figure 3. Temporal evolution of the daily pCDM source solution from Bayesian inversion of 7-day displacement trends from 8 to 22 June 2014, in map and vertical cross-section views. Time interval of each model is given in the figure. Color map indicates the maximum probability level combined with the volume variation sign (yellow-orange-red for inflation, green-cyan-blue for deflation). Black, red, and green arrows are observed displacements, modeled displacements and residual, respectively. Ellipses are errors. Best model source location and shape are indicated as gray plans, and their source approximate shape (E: Ellipsoid, S: Sill, P: Pipe, D: Dike) and volume variation (M m3 ) are indicated. BEAUDUCEL ET AL. 6 of 9
Geophysical Research Letters                                                        10.1029/2020GL089419

                   Figure 4. Synthetic and virtual 3-D view of the different best models identified during the June 2014 preeruptive
                   unrest at Piton de la Fournaise. Colors stand for the most recent date of each time window. Size of each source
                   is proportional to its associated volume variation. Transparent plan at depth = 0 simulates the sea level.

                   4). On Phase 2, our results suggest increasingly shallow sources of overpressure from 12 June 2014 (Figure
                   4). It started from 7 to 8 km b.s.l. (at the lower limit of our model space) where a reservoir has already been
                   inferred from seismicity in 1998 (Battaglia et al., 2005), up to 1.5 km a.s.l., where the shallower reservoir
                   is suspected to lie (1.3 to 1.9 km depth below the summit Peltier et al., 2016). Most of the pressure sources
                   below sea level are vertically elongated and seems to highlight the volcano deep conduit connecting the two
                   reservoirs, forming a continuum more or less filled by fluids (Figures 3 and 4). Rather than tracking the
                   details of magma migration, which would require a higher time sampling frequency, we imaged the PdF
                   plumbing system (from about 10 km depth to the surface; Figure 4). The synthetic 3-D view of the different
                   sources identified during the June 2014 preeruptive unrest shows a gap at sea level, at the same level where
                   Prôno et al. (2009) describe a high-velocity plug interpreted as a solidified complex with little fluid storage,
                   and where Battaglia et al. (2005) describe a discontinuity in the upward migration of the seismicity preceding
                   the 1998 eruption. Following the 1998 eruption, most of the deep recharges were not accompanied by deep
                   seismicity, the majority of the earthquakes being located above sea level (Duputel et al., 2019; Lengliné et
                   al., 2016). This suggests a generally deep open conduit, which fed the 34 eruptions between 1998 and 2014
                   (Roult et al., 2012). Our results illustrate the value of geodetic monitoring when the shallow system is already
                   open, and seismic activity absent. The first models (Phase 1) show deep deflation sources before the magma
                   migration starts (Figures 3, 4). This volume loss might correspond to the emptying of a deeper reservoir(s)
                   before the magma starts to “drill” and follows a path to shallower levels (Phase 2; Figure 4). For Gurioli et al.
                   (2018), the products emitted during the eruption came from a shallow, differentiated magma source, already
                   in place since 2009 that has been re-activated by fast volatile ex-solution and crystal-melt separation. The
                   migrating sources we modeled display significant volume variation that probably involve more than only gas
                   and highlight new magma upward migration up to 1.5 km depth. Source locations during Phase 3 suggests
                   that the fracturing that the final dike (Phase 4) started from about 1.5 km depth below the southern border
                   of the Dolomieu crater (Figures 3 and 4). The two seismic crises, on 13 and 17 June, with earthquakes above
                   sea level, show already shallow pressure source(s) at that time.

BEAUDUCEL ET AL.                                                                                                                       7 of 9
Geophysical Research Letters 10.1029/2020GL089419
Our estimated source volume variations are relatively constant during Phases 3 and 4, that is, around 0.25 M
m3 (Figure 3) despite the displacement increasing over 1 order of magnitude between preeruptive and
syneruptive periods. This volume consistency indicates only a limited volume of magma involved in the final
phase of magma migration. However, if we had used an isotropic source, this process could not have been
properly modeled as for a given depth, the volume variation must be proportional to surface displacements.
Using pCDM, the source shape has the capability to be adjusted while keeping a constant volume variation
and maintaining a shallow depth. In addition, the final volume variation is of the same order of magnitude
as the one obtained using an isotropic source for the whole coeruptive period (130,000 to 190,000 m3 Peltier
et al., 2016), and close to the real erupted volume of 0.4 ± 0.2 M m3 , that is, a DRE volume of 0.17–0.28
assuming a porosity range of 30–58% (Di Muro et al., 2014).
In spite of the elastic and homogeneous assumptions for the models, the volume variation obtained from
deformation and erupted volume are consistent for short-lived eruptions not sustained by additional dike
refilling. We demonstrate with our modeling the need of looking at shorter time periods to evidence migra-
tion processes and complex internal shallow structures. GNSS daily solutions are certainly a limitation in
this context, and higher frequency may help in identification of finer structures.
5. Conclusion
The low-amplitude surface displacements preceding the 20 June 2014 eruption at PdF makes this erup-
tion a good case study for developing and validating high-sensitivity modeling methods. Our work provides
new insights into the refilling of the shallow magma reservoir the days preceding the eruption. The pCDM
method we used allows the tracking of magma from depth to the upper reservoir, and the final dike prop-
agation to the surface, by discriminating both the shape, location and volume of the successive modeled
sources. The rewriting of the original pCDM code in a fully vectorized way allows for fast inversion and easy
implementation to provide rapid first-order modeling results and assist crisis management. Similar to the
results obtained at Mount Etna by Cannavò et al. (2015), our method is fast and fully unsupervised, with-
out a priori information on the source parameters except the choice of the pCDM itself. In view of these
promising results, we implemented this method operationally as an extension of the GNSS module in the
WebObs system (Beauducel et al., 2020), an integrated web-based system for data monitoring and network
management implemented in 15 observatories worldwide. The module was initially developed with a sim-
ple isotropic point source (Beauducel et al., 2014, 2019), and we added the possibility of setting a pCDM
source and associated parameters for real-time modeling. This has been especially useful during recent crisis
managements at La Soufrière de Guadeloupe (Moretti et al., 2020) and PdF.
Data Availability Statement
GNSS raw data are available at https://volobsis.ipgp.fr, processed data by contacting OVPF-IPGP. WebObs
Acknowledgments system is an open-source project available at this site (https://github.com/IPGP/webobs).
This work is a tribute to F. B.'s late
thesis supervisor François H. Cornet.
Authors warmly thank Mehdi References
Nikkhoo for sharing his revolutionary Anderson, K., Lisowski, M., & Segall, P. (2010). Cyclic ground tilt associated with the 2004–2008 eruption of Mount St. Helens. Journal of
analytical model. Many thanks to the Geophysical Research, 115, B11201. https://doi.org/10.1029/2009JB007102
University of Gajah Mada, the IRD in Battaglia, J., Ferrazzini, V., Staudacher, T., Aki, K., & Cheminée, J.-L. (2005). Pre-eruptive migration of earthquakes at the Piton de la
Jakarta, and the Indonesian Ministry Fournaise volcano (Réunion Island). Geophysical Journal International, 161(2), 549–558.
RistekDikti for having supported the Beauducel, F., De Natale, G., Obrizzo, F., & Pingue, F. (2004). 3-D modelling of Campi Flegrei ground deformations: An example of
project. We thank the OVPF staff for trade-off between source and structure. Pure and Applied Geophysics, 161(7), 1329–1344.
high quality data collection. This work Beauducel, F., Lafon, D., Béguin, X., Saurel, J.-M., Bosson, A., Mallarino, D., et al. (2020). WebObs: The volcano observatories missing
has been supported by a Grant from link between research and real-time monitoring. Frontiers in Earth Science, 8, 48. https://doi.org/10.3389/feart.2020.00048
Labex OSUG@2020 (Investissements Beauducel, F., Nandaka, M. A., Syahbana, D. K., Suryanto, W., Nurnaning, A., Iguchi, M., et al. (2019). Real-time magma flux
d'avenir ANR10 LABX56) and quantization from GNSS as a tool for crisis management. In VOBP4, Mexico City, November 2019.
EUROVOLC project that received Beauducel, F., Nurnaning, A., Iguchi, M., Fahmi, A. A., Nandaka, M. A., Sumarti, S., et al. (2014). Real-time source deformation
funding from the European Union's
modeling through GNSS permanent stations at Merapi volcano (Indonesia). In AGU Fall Meeting Abstracts.
Horizon 2020 research and innovation
Boudoire, G., Brugier, Y.-A., Di Muro, A., Wörner, G., Arienzo, I., Metrich, M., et al. (2019). Eruptive activity on the western flank of
programme under Grant Agreement
Piton de la Fournaise (La Réunion Island, Indian Ocean): Insights on magma transfer, storage and evolution at an oceanic volcanic
731070. This is IPGP contribution
island. Journal of Petrology, 60(9), 1717–1752.
4159. Many thanks to an anonymous
Boudoire, G., Di Muro, A., Liuzzo, M., Ferrazzini, V., Peltier, A., Gurrieri, S., et al. (2017). New perspectives on volcano monitoring in a
reviewer and to Nico Fournier for
tropical environment: Continuous measurements of soil CO2 flux at Piton de la Fournaise (La Réunion Island, France). Geophysical
useful comments and suggestions.
Research Letters, 44, 8244–8253. https://doi.org/10.1002/2017GL074237
BEAUDUCEL ET AL. 8 of 9Geophysical Research Letters 10.1029/2020GL089419
Boudoire, G., Liuzzo, M., Di Muro, A., Ferrazzini, V., Michon, L., Grassa, F., et al. (2017). Investigating the deepest part of a volcano
plumbing system: Evidence for an active magma path below the western flank of Piton de la Fournaise (La Réunion Island). Journal of
Volcanology and Geothermal Research, 341, 193–207.
Brenguier, F., Shapiro, N. M., Campillo, M., Nercessian, A., & Ferrazzini, V. (2007). 3-D surface wave tomography of the Piton de la
Fournaise volcano using seismic noise correlations. Geophysical Research Letters, 34, L02305. https://doi.org/10.1029/2006GL028586
Cannavò, F., Camacho, A. G., González, P. J., Mattia, M., Puglisi, G., & Fernández, J. (2015). Real time tracking of magmatic intrusions by
means of ground deformation modeling during volcanic crises. Scientific Reports, 5, 10970.
Cayol, V., & Cornet, F. H. (1998). Three-dimensional modeling of the 1983–1984 eruption at Piton de la Fournaise Volcano, Réunion
Island. Journal of Geophysical Research, 103(B8), 18,025–18,037.
Desai, S., Bertiger, W., Garcia-Fernandez, M., Haines, B., Murphy, D., Selle, C., et al. (2014). Status and plans at the JPL IGS analysis center.
In Intl. GNSS Service 2014 Workshop Compendium, Ed. IGS Central Bureau, Jet Propul. Lab., Calif. Inst. of Technol. Pasadena, Calif,
pp. 53.
Di Muro, A., Métrich, N., Vergani, D., Rosi, M., Armienti, P., Fougeroux, T., et al. (2014). The shallow plumbing system of Piton de la
Fournaise volcano (La Reunion Island, Indian Ocean) revealed by the major 2007 caldera-forming eruption. Journal of Petrology, 55(7),
1287–1315.
Duputel, Z., Lengliné, O., & Ferrazzini, V. (2019). Constraining spatio-temporal characteristics of magma migration at Piton de la
Fournaise volcano from pre-eruptive seismicity. Geophysical Research Letters, 46, 119–127. https://doi.org/10.1029/2018GL080895
Dzurisin, D. (2003). A comprehensive approach to monitoring volcano deformation as a window on the eruption cycle. Reviews of
Geophysics, 41(1), 1001. https://doi.org/10.1029/2001RG000107
Gurioli, L., Di Muro, A., Vlastélic, I., Moune, S., Thivet, S., Valer, M., et al. (2018). Integrating field, textural, and geochemical monitoring
to track eruption triggers and dynamics: A case study from Piton de la Fournaise. Solid Earth, 9(2), 431.
Lengliné, O., Dputel, Z., & Ferrazzini, V. (2016). Uncovering the hidden signature of a magmatic recharge at Piton de la Fournaise
volcano using small earthquakes. Geophysical Research Letters, 43, 4255–4262. https://doi.org/10.1002/2016GL068383
Moretti, R., Komorowski, J.-C., Ucciani, G., Moune, S., Jessop, D., de Chabalier, J.-B., et al. (2020). The 2018 unrest phase at La Soufrière
of Guadeloupe (French West Indies) andesitic volcano: Scrutiny of a failed but prodromal phreatic eruption. Journal of Volcanology
and Geothermal Research, 393, 106,769. https://doi.org/10.1016/j.jvolgeores.2020.106769
Nikkhoo, M., Walter, T. R., Lundgren, P. R., & Prats-Iraola, P. (2016). Compound dislocation models (CDMs) for volcano deformation
analyses. Geophysical Journal International, 208, 877–894.
Peltier, A., Bachèlery, P., & Staudacher, T. (2009). Magma transport and storage at Piton de La Fournaise (La Réunion) between 1972 and
2007: A review of geophysical and geochemical data. Journal of Volcanology and Geothermal Research, 184(1-2), 93–108.
Peltier, A., Beauducel, F., Villeneuve, N., Ferrazzini, V., Di Muro, A., Aiuppa, A., et al. (2016). Deep fluid transfer evidenced by
surface deformation during the 2014–2015 unrest at Piton de la Fournaise volcano. Journal of Volcanology and Geothermal Research,
321, 140–148.
Peltier, A., Villeneuve, N., Ferrazzini, V., Testud, S., Hassen Ali, T., Boissier, P., & Catherine, P. (2018). Changes in the long-term
geophysical eruptive precursors at Piton de la Fournaise: Implications for the response management. Frontiers in Earth Science, 6, 104.
Prôno, E., Battaglia, J., Monteiller, V., Got, J.-L., & Ferrazzini, V. (2009). P-wave velocity structure of Piton de la Fournaise volcano
deduced from seismic data recorded between 1996 and 1999. Journal of Volcanology and Geothermal Research, 184(1-2), 49–62.
Roult, G., Peltier, A., Taisne, B., Staudacher, T., Ferrazzini, V., Di Muro, A., & OVPF (2012). A new comprehensive classification of the
Piton de la Fournaise activity spanning the 1985–2010 period. Search and analysis of short-term precursors from a broad-band
seismological station. Journal of Volcanology and Geothermal Research, 241, 78–104.
Segall, P. (2010). Earthquake and volcano deformation: Princeton University Press.
Tarantola, A. (2006). Popper, Bayes and the inverse problem. Nature Physics, 2(8), 492–494.
Tibaldi, A. (2015). Structure of volcano plumbing systems: A review of multi-parametric effects. Journal of Volcanology and Geothermal
Research, 298, 85–135.
Toutain, J.-P., Bachelery, P., Blum, P. A., Cheminée, J. L., Delorme, H., Fontaine, L., et al. (1992). Real time monitoring of vertical ground
deformations during eruptions at Piton de la Fournaise. Geophysical Research Letters, 19(6), 553–556.
Williams, C. A., & Wadge, G. (1998). The effects of topography on magma chamber deformation models: application to Mt. Etna and
radar interferometry. Geophysical Research Letters, 25(10), 1549–1552.
BEAUDUCEL ET AL. 9 of 9You can also read