Mechanistic strategies of microbial communities regulating lignocellulose deconstruction in a UK salt marsh
←
→
Page content transcription
If your browser does not render page correctly, please read the page content below
Leadbeater et al. Microbiome      (2021) 9:48
https://doi.org/10.1186/s40168-020-00964-0

 RESEARCH                                                                                                                                            Open Access

Mechanistic strategies of microbial
communities regulating lignocellulose
deconstruction in a UK salt marsh
Daniel R. Leadbeater1* , Nicola C. Oates1, Joseph P. Bennett1, Yi Li1, Adam A. Dowle2, Joe D. Taylor4,
Juliana Sanchez Alponti1, Alexander T. Setchfield1, Anna M. Alessi1, Thorunn Helgason3,
Simon J. McQueen-Mason1* and Neil C. Bruce1*

  Abstract
  Background: Salt marshes are major natural repositories of sequestered organic carbon with high burial rates of
  organic matter, produced by highly productive native flora. Accumulated carbon predominantly exists as
  lignocellulose which is metabolised by communities of functionally diverse microbes. However, the organisms that
  orchestrate this process and the enzymatic mechanisms employed that regulate the accumulation, composition
  and permanence of this carbon stock are not yet known. We applied meta-exo-proteome proteomics and 16S rRNA
  gene profiling to study lignocellulose decomposition in situ within the surface level sediments of a natural
  established UK salt marsh.
  Results: Our studies revealed a community dominated by Gammaproteobacteria, Bacteroidetes and
  Deltaproteobacteria that drive lignocellulose degradation in the salt marsh. We identify 42 families of
  lignocellulolytic bacteria of which the most active secretors of carbohydrate-active enzymes were observed to be
  Prolixibacteracea, Flavobacteriaceae, Cellvibrionaceae, Saccharospirillaceae, Alteromonadaceae, Vibrionaceae and
  Cytophagaceae. These families secreted lignocellulose-active glycoside hydrolase (GH) family enzymes GH3, GH5,
  GH6, GH9, GH10, GH11, GH13 and GH43 that were associated with degrading Spartina biomass. While fungi were
  present, we did not detect a lignocellulolytic contribution from fungi which are major contributors to terrestrial
  lignocellulose deconstruction. Oxidative enzymes such as laccases, peroxidases and lytic polysaccharide
  monooxygenases that are important for lignocellulose degradation in the terrestrial environment were present but
  not abundant, while a notable abundance of putative esterases (such as carbohydrate esterase family 1) associated
  with decoupling lignin from polysaccharides in lignocellulose was observed.
  (Continued on next page)

* Correspondence: daniel.leadbeater@york.ac.uk;
simon.mcqueenmason@york.ac.uk; neil.bruce@york.ac.uk
1
 Centre for Novel Agricultural Products, Department of Biology, University of
York, York YO10 5DD, UK
Full list of author information is available at the end of the article

                                         © The Author(s). 2021 Open Access This article is licensed under a Creative Commons Attribution 4.0 International License,
                                         which permits use, sharing, adaptation, distribution and reproduction in any medium or format, as long as you give
                                         appropriate credit to the original author(s) and the source, provide a link to the Creative Commons licence, and indicate if
                                         changes were made. The images or other third party material in this article are included in the article's Creative Commons
                                         licence, unless indicated otherwise in a credit line to the material. If material is not included in the article's Creative Commons
                                         licence and your intended use is not permitted by statutory regulation or exceeds the permitted use, you will need to obtain
                                         permission directly from the copyright holder. To view a copy of this licence, visit http://creativecommons.org/licenses/by/4.0/.
                                         The Creative Commons Public Domain Dedication waiver (http://creativecommons.org/publicdomain/zero/1.0/) applies to the
                                         data made available in this article, unless otherwise stated in a credit line to the data.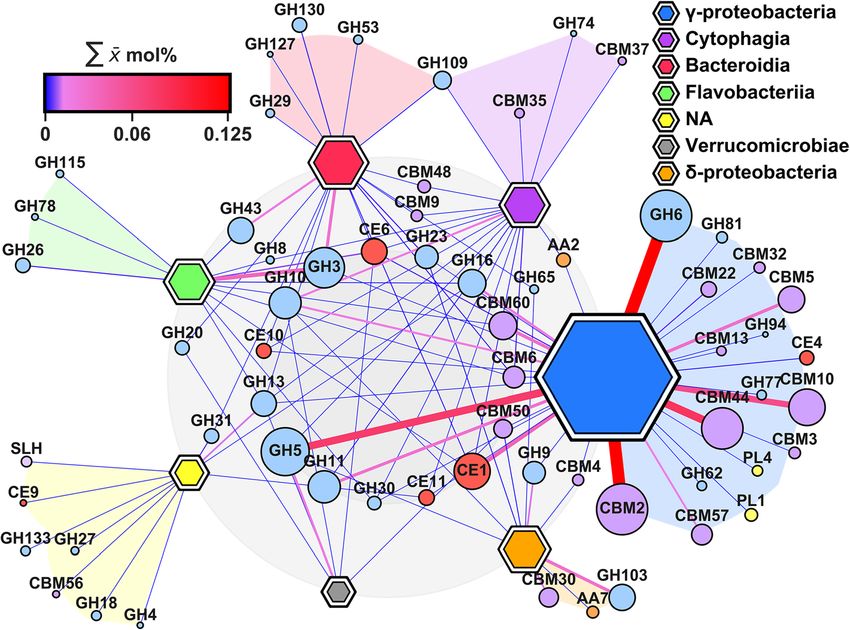
Leadbeater et al. Microbiome      (2021) 9:48                                                                    Page 2 of 16

 (Continued from previous page)
 Conclusions: Here, we identify a diverse cohort of previously undefined bacteria that drive lignocellulose degradation
 in the surface sediments of the salt marsh environment and describe the enzymatic mechanisms they employ to
 facilitate this process. Our results increase the understanding of the microbial and molecular mechanisms that
 underpin carbon sequestration from lignocellulose within salt marsh surface sediments in situ and provide insights into
 the potential enzymatic mechanisms regulating the enrichment of polyphenolics in salt marsh sediments.
 Keywords: Salt marsh, Lignocellulose, CAZyme, Carbon cycling, Carbohydrate esterase, CE1, Proteomics,
 Transcriptomics, Community profiling

Introduction                                                    This polysaccharide complex is interpenetrated and
Salt marshes are highly productive intertidal ecosystems        sealed by lignin, a phenolic heteropolymer, making
that generate an abundance of organic carbon in the             lignocellulose more hydrophobic and difficult to degrade
form of lignocellulose, where net aerial primary product-       enzymatically [18]. The sheer abundance of lignocellu-
ivity often exceeds 1–2 kg C m−2 year−1 [1–3]. This             lose in the terrestrial biosphere, along with its complex-
productivity is intrinsically linked to organic carbon bur-     ity and recalcitrance to digestion has led to the evolution
ial rates, estimated to be 57–245 g C m−2 year−1 [4–6].         of a diverse range of lignocellulolytic enzymes across the
This indicates that salt marshes are among the most             tree of life [19]. Yet very little is known about the factors
effective carbon sequestering ecosystems per unit area          that regulate lignocellulose decomposition in salt
on the planet with a total estimated sequestration capacity     marshes despite large annual inputs into these systems
of 4.8 to 87.2 Tg C year−1 [7] despite occupying only 22,       as microdetritus that is predominantly retained and de-
000–400,000 km2 [6–8]. These processes contribute to an         graded on site [9, 20, 21].
increasing pool of inaccessible carbon as the salt marsh           The dominant flora in salt marsh ecosystems is peren-
accretes. Organic carbon is introduced into the ecosystem       nial such as Spartina species. Dieback of these plants in-
as grass lignocellulose which represents the major compo-       troduces vast quantities of lignocellulosic biomass into
nent of surface to shallow sub-surface level carbon [9].        the marine environment. The first phase of decay occurs
Furthermore, the composition of organic carbon changes          during dieback where terrestrial fungal plant pathogens,
with depth, with an enrichment in persistent lignin deriva-     usually mycelial Ascomycetes, attack the senescent plant
tives while polysaccharides are lost [10, 11]. Deposited        biomass [22, 23]. These fungi target standing senescent
lignin is subject to passive leaching of soluble and often      tissue that resides aboveground in a terrestrial setting
biologically available phenols which diffuse throughout         and act to break open the plant cell walls as a means to
the sedimentary column, adding further recalcitrance to         access the nutritionally rich cell contents leading to the
the remaining phenolics, degradation of which is                resultant infected tissues becoming nitrogen depleted
suppressed in anoxic conditions [12–14]. Traditionally,         and lignocellulose enriched [24–26]. The senescent
primary productivity, surface area, sediment deposition         standing tissue then weakens, and the lignocellulose
and transport rates, leaching and sorption govern carbon        enriched biomass detaches from the root-rhizome
capture in coastal sediments [15]. Mineral protection and       becoming deposited onto the sediment surface where it
preferential retention of recalcitrant organic carbon are       transitions into a predominantly marine environment
major themes governing carbon sequestration [16];               with significantly greater and more variable physico-
however, throughout this natural biogeochemical carbon          chemical pressures than terrestrial zones [27]. Here, it
processing, microbial mechanisms of carbon transform-           redistributes around the salt marsh surface or aggregates
ation are present and likely operate as a system-level          on the strandline where it is subject to a different phase
decomposition process that influences the permanence            of decay.
of lignocellulose and stored carbon in marsh sediments.            Studies have established degradation rates of deposited
Currently, this process is orchestrated by an undefined         lignocellulose in situ at surface levels using litterbag
consortium of organisms prior to entry into stable deeper       methodologies [9, 20, 28–31]; however, very little is
sediments where this material persists for millennia [6, 17].   known about the microbial framework that regulates this
   Lignocellulose is a strong fibre composite material          decomposition or the enzymatic mechanisms employed
which provides mechanical support and the vessels for           to deconstruct the complex lignocellulosic substrate. In
long distance water transport in plants and is highly re-       vitro studies have suggested that bacteria, such as Cyclo-
sistant to degradation. It is a macromolecular complex          bacteriaceae, Desulfobacteraceae, Flavobacteriaceae, Halo-
formed from cellulose microfibrils embedded in a matrix         monadaceae, Oceanospirillales, Pseudomonadaceae and
of branched polysaccharides known as hemicellulose.             Spirochaetaceae, are involved in lignocellulose degradation
Leadbeater et al. Microbiome      (2021) 9:48                                                                            Page 3 of 16

in this environment with fungi becoming competitively                     aboveground Spartina anglica biomass was collected prior
displaced [32–34]. Beyond this, our understanding of the                  to deposition during winter dieback in February–March
functional groups involved in the decomposition process                   2015 on an adjacent intertidal mud flat (Cherry Cobb
and the biocatalytic strategies they employ to achieve this               sands, Humber estuary, Hull, UK). The biomass was
are poorly understood. In vitro studies are divorced from                 washed free of sediment, dried at 65 °C for 48 h and size
environmental factors and the findings require cautious in-               fractionated with a Retsch Cutting Mill SM 300 at 2300
terpretation, as results cannot be directly extrapolated into             rpm. The final biomass fraction consisted of 80% of > 1.12
the context of ecosystem processes. Additionally, the func-               mm fraction and 20% < 1.12 mm to > 500 μm fraction.
tion of an organism cannot be determined by its presence                  Nylon 66 monofilament woven bags (“litterbag”) (18.5 cm ×
or the presence of a gene as this only deduces a potential                18.5 cm) of aperture size 200 μm were filled with 50 g of
propensity to function.                                                   biomass and sealed with 100% polyester thread.
   Direct monitoring of ecological processes in situ has                    Bags were placed in a 3 × 3 conformation in five
the potential to capture functional, molecular and phylo-                 stainless steel cages (711.2 mm × 711.2 mm × 63.5 mm)
genetic information at their environmental interface. To                  with 25-cm legs that were interspersed by 75 m along a
identify the microbial community that regulates the ini-                  300-m parallel elevation transect, defined by plant
tial decomposition of introduced lignocellulose at the                    zonation patterns (dominance of Spartina anglica,
surface level, we applied meta-exo-proteome proteomics,                   Puccinellia maritima and Salicornia europaea). Prior to
ribosomal 16S rRNA gene phylogenetic profiling and                        deployment, the under canopy was removed and the
lignocellulose composition analysis to Spartina anglica                   cages placed with the bags interfacing with the sedi-
biomass in litterbags in situ along a 300-m transect                      ment to facilitate crosstalk to mimic surface-interfacing
within an established salt marsh (Welwick, UK) for 16                     detritus and mapped to position with GPS coordinates
weeks (Fig. 1, Additional file 1: Figure S1). We identify                 (Additional file 1: Table S1).
lignocellulolytic enzymes from the meta-exo-proteome,                       Sampling was performed by removing a single litterbag
ascertain the taxonomic origin to identify functional                     from each cage. During deployment, the uppermost 1–5
groups and determine the mechanistic strategies they                      mm of sediment surrounding the cages were sampled to
employ to depolymerize lignocellulose.                                    act as a non-lignocellulose enriched sediment day 0 out-
                                                                          group control. Sampling was randomised a priori and
Materials and methods                                                     occurred weekly for the first 6 weeks and thereafter at
Experimental design                                                       week eight, ten and 16 for a total of 46 samples (includ-
The field experiment was conducted in Welwick salt marsh,                 ing the day 0 outgroup). Sampling began at the point of
Hull, Humber estuary, UK, 53° 38′ 55″ N, 0° 01′ 19″ E                     low tide and was completed within 2 h. Sampled bags
from 16 July 15 to 6 November 15 (Additional file 1: Figure               were kept at 4 °C during transport and processing began
S1). To mimic natural lignocellulose cycling, senescent                   within 4 h of harvest.

 Fig. 1 Schematic representation of the integrated omics approach undertaken in this study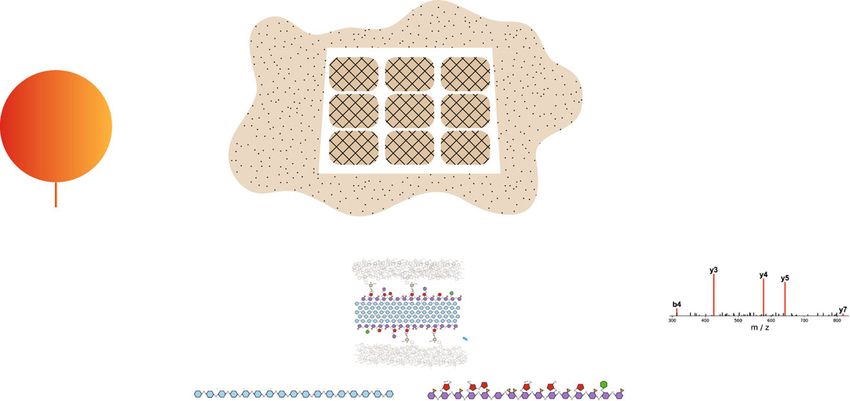
Leadbeater et al. Microbiome   (2021) 9:48                                                                  Page 4 of 16

DNA and RNA extraction                                       residual biotin was removed with two washes with 20
Each biological replicate at each time point (week one–      mL ice cold 0.5X PBS pH 8 with centrifugation steps for
six, eight, ten and 16) were treated independently.          5 min at 4500×g.
Harvested biomass was equilibrated twice with 40 mL             Proteins were extracted from the biomass with 10 mL
ice cold 0.5x PBS pH 8.15 and centrifuged for 10 min at      2% (w/v) SDS pre-heated to 60 °C and incubated for 1 h.
4500×g. Five 0.5 g biomass aliquots per litterbag (per       The supernatant was extracted, and the proteins were
cage; 25 total per week) were taken forward for DNA          precipitated with five volumes of pre-chilled (− 20 °C)
and RNA extraction. The five 0.5 g biomass aliquots          100% acetone and incubated at − 20 °C for 16 h. Precipi-
were added to screw cap tubes (2 mL) containing 0.5 g        tated proteins were pelleted by centrifuging at 4500 rpm
0.5 mM glass beads (Sigma G9268) and 0.5 g 0.1 mM            for 20 min and the residual acetone was discarded. The
glass beads (Sigma G8893). Cetyl trimethylammonium           pellets were air dried and resuspended in 1 mL 0.1%
bromide buffer (0.5 mL) containing 10% CTAB (m/v) in         SDS in 1x PBS, filtered through 0.22 μm syringe driven
0.7 M NaCl, 240 mM potassium phosphate pH 8 and              filter units and loaded onto 1 mL HiTrap Streptavidin
0.1% β-mercaptoethanol and 0.4 mL phenol/chloroform/         HP columns (GE Healthcare #17-5112-01) and incu-
isoamyl alcohol (25:24:1) pH 8 were added. The samples       bated for 1 h at 4 °C. The proteins were eluted with 1
were homogenised in a TissueLyser II (Qiagen) for 2 ×        mL 50 mM dithiothreitol (DTT) in 1x PBS, the column
2.5 min at 30/s. The tubes were then centrifuged at 4 °C     was incubated for a further 1 h and eluted again, this
at 16,500×g for 15 min. The aqueous phase was trans-         was performed three times and the first two 1 mL frac-
ferred to a new tube and an equal volume of chloroform       tions were pooled.
to isoamyl alcohol (24:1) was added and centrifuged as          The protein fractions were desalted and buffer ex-
previously and three 7.5 g aliquots of decaying Spartina     changed into H2O using 5 mL Zeba™ Spin 7 k MWCO
biomass per litterbag (one litterbag per each of the five    columns (Thermo 89882) according to the manufac-
cages for a total of 15 aliquots per week; only for weeks    turer’s protocol. To concentrate, the buffer exchanged
one, three, five and ten) were taken forward for protein     protein was frozen in liquid nitrogen, lyophilised using a
extraction following Alessi et al. [35]. The aqueous phase   Heto PowerDry LL3000 Freeze Dryer (Thermo) and re-
was precipitated for 16 h at 4 °C with two volumes of        suspended in 210 μL H2O. All five biological replicates
PEG precipitation solution containing 20% (w/v)              for each time point were pooled in equal concentrations.
PEG8000 (Sigma) in 1.6 M NaCl. The nucleic acid pellet       The proteins were stored for LC-MS/MS analysis by
was collected by centrifugation as above for 30 min at       solubilising in NuPAGE LDS sample buffer (Life Tech-
4 °C. The pellet was washed twice in 75% ethanol. Total      nologies) and incubating at 70 °C for 10 mins prior to a
RNA from weeks one, three, five and ten (the same sam-       short (6 min) run into a 7-cm NuPAGE Novex 10% Bis-
ples used to extract the proteins within the meta-exo-       Tris Gel (Life Technologies) at 200 V. The gels were
proteome) were taken forward for metatranscriptomic          stained with SafeBLUE protein stain (NBS biologicals)
processing.                                                  for 1 h before de-staining with H2O for 1 h. The stained
                                                             gels were sliced into 1-mm2 fragments and stored at
Meta-exo-proteome extraction                                 − 20 °C prior to LC-MS/MS analysis.
Each biological replicate in the protein extraction was
treated independently. Per week, for each of the five        Meta-exo-proteomics, protein identification, functional
cages, three aliquots (only for weeks one, three, five and   annotation and taxonomic origin
ten, the same weeks utilised for metatranscriptome           To generate paired-in-time reference metatranscriptome
extraction to generate complimentary paired-in-time          databases, total extracted nucleic acids from each bio-
databases) were taken forward for protein extraction to      logical replicate were pooled in equal ratios for each
generate meta-exo-proteome libraries. Each 7.5 g aliquot     time point (week one, three, five and ten) and DNA
of harvested biomass was washed twice with 40 mL ice         depleted. Messenger RNA (mRNA) was enriched by
cold 0.5x PBS pH 8.15 and centrifuged for 10 min at          depleting ribosomal RNA (rRNA) using Ribo-Zero™
4500×g. The extracellular and transmembrane proteins         Magnetic Epidemiology rRNA removal kit (RZE1224/
were labelled in triplicate and 2.5 g biomass aliquots for   MRZ11124C; Illumina). RNA-seq libraries were pre-
each of the biological replicates were resuspended in 10     pared using a NEBnext RNA Ultra Library preparation
mM EZ-link-Sulfo-NHS-SS-biotin (Thermo Scientific            kit with NEBnext single 6 bp indexing primers (New
#21331) in 0.5x PBS and incubated at 4 °C for 1 h. The       England BioLabs, Herts, UK) and pooled in equimolar
biomass was centrifuged for 10 min at 4500×g as above,       ratios. The pooled RNA-seq library was spiked with 1%
the supernatant was discarded and the biotinylation re-      PhiX and sequenced on a single lane of an Illumina
action was quenched with 25 mL 50 mM Tris-HCl pH 8           HiSeq 3000 2 × 150 base pair chip. Sequencing resulted
and incubated for 30 min at 4 °C. Excess Tris-HCl and        in 82 966 97, 99 319 32, 95 318 91 and 105 517 252 raw
Leadbeater et al. Microbiome (2021) 9:48 Page 5 of 16 reads for the metatranscriptomics databases for week m/z 150–2000; MS/MS spectra rate, 5 Hz at 2500 cts to 20 one, three, five and ten respectively (383,122,461 reads Hz at 250,000 cts; quadrupole low mass, 300 m/z; cycle in total); statistics for the four individual metatranscrip- time, 1 s; ion spray voltage, 1450 V; collision RF, 1400 Vpp; tomic databases and totals are available in Additional file 1: transfer time, 120 ms; MS spectra rate, 5 Hz; dry gas Table S2. temperature, 150 °C; absolute threshold 200 counts; pre- To leverage the depth of sequencing and capitalise on ferred charge states 2–4; and singly charged ions excluded. the diversity within the temporally interspersed metatran- A single MS/MS spectrum was acquired for each precursor scriptomes maximise protein identification, the metatran- and former target ions were excluded for 0.8 min unless the scriptomic databases for week one, three, five and ten were precursor intensity increased fourfold. concatenated into a single master metatranscriptome. Raw Our approach of shotgun LC-MS/MS-based proteomics reads were searched against Silva_115 database to identify allows in-depth proteomic analysis but is only effective if ribosomal RNA (rRNA) genes using the Bowtie2 software the peptide spectra can be matched to a corresponding package [35, 36]. Orphan reads in the paired reads, rRNA sequence database. Because the salt marsh environment reads and poor-quality sequences were removed with the has been little explored at the molecular level, we used the ngsShoRT software [37]. Dereplicated libraries were assem- metatranscriptome libraries, that were generated at the bled de novo with the Trinity software package [38]. Read same time points (paired-databases in time) as the prote- counts and gene abundance were obtained with the Trinity omic studies, as reference libraries to map peptide spectra utility programs. The de novo assembled metatranscrip- to their originating sequence. We concatenated the four tomic databases contained 29,938,868 contiguous se- metatranscriptomic databases (week one, three, five and quences (contigs). Contigs ≤ 500 bp were filtered, split into ten) into a master database to capitalise on the diversity open reading frames (ORFs) using Emboss GETORF within the temporally interspersed metatranscriptomes (http://www.bioinformatics.nl/cgi-bin/emboss/getorf) that and used this gene expression data to identify meta-exo- were ≥ 300 bp and includes alternative initiation codons proteome proteins from peptide spectra, shedding new and dereplicated resulting in 2,400,360 unique ORFs within light on the communities of microbes in this environment the master metatranscriptome. and their activities. To generate paired-in-time exo-meta-proteome To identify proteins from LC-MS/MS spectra, peptide databases, biological replicates at week one, three, five and spectra generated from the digested meta-exo-proteome ten were pooled and protein identification was performed proteins were mapped back to originating sequences in in triplicate for each pool at each time point (N = 3 for the ORF library generated from the concatenated meta- each of week one, three, five and ten). Tryptic digestion transcriptomic assemblies. Firstly, redundant sequences was performed for in-gel proteins post reduction with in the ORF database were removed by leveraging non- DTE and S-carbamidomethylation with iodoacetamide. redundant sequences in an initial round of high strin- Gel pieces were washed twice with 50% (v:v) aqueous gency searching (p = 0.05) against 21 subsets of ~ 115 acetonitrile containing 25 mM ammonium bicarbonate 000 sequences (252 searches total), followed by the con- and finally washed with acetonitrile and then dried. Modi- catenation of sequence hits into a secondary “true hit” fied porcine trypsin (Promega, Southampton, UK) was database (containing 42,894 sequences) with minimal re- dissolved in 50 mM acetic acid and diluted with 25 mM dundancy, the final search against the true hit database ammonium bicarbonate to 0.02 μg/μL. 25 μL of trypsin so- (p = 0.1) yielded 11,268 unique proteins; individual lution was added and incubated for 10 min before adding peptide spectral matches were filtered to require expect 25 mM ammonium bicarbonate to submerge to gel pieces scores of 0.1 or better. Peptide spectra generated with and incubated further for 16 h at 37 °C. Three washes LC-MS/MS were cross-referenced with ORF sequences were performed with 50% (v:v) aqueous acetonitrile con- using Mascot version 2.5.1 (Matrix Science Ltd.), taining 0.1% TFA (v:v), dried and reconstituted in aqueous through the ProteinScape interface version 2.1 [39]. The 0.1% trifluoroacetic acid (v:v). search criteria for both searches were + 2/+ 3/+ 4 peptide The acquisition of peptide spectra was performed in charge, peptide tolerance ± 10 ppm, modifications, car- triplicate for each time point and was achieved using a bamidomethyl and oxidation. Analysis was performed nanoLC system interfaced with a maXis HD LC-MS/MS using the quantitative exponentially modified protein system and a CaptiveSpray ionisation source (Bruker abundance index (emPAI) [40]. emPAI values for each Daltonics, Coventry, UK). Positive ESI-MS and MS/MS protein were then normalised to generate the molar spectra were acquired using AutoMSMS mode. Instrument percentage. control, data acquisition and processing were performed dbCAN was used to identify carbohydrate-active using Compass 1.7 software (microTOF control, Hystar enzymes (CAZyme) within the meta-exo-proteome and and DataAnalysis, Bruker Daltonics). Instrument settings the metatranscriptomic databases using HHMER3 [41]. were the following: dry gas, 3 L/min; ion acquisition range, The meta-exo-proteome was also searched against the
Leadbeater et al. Microbiome   (2021) 9:48                                                                     Page 6 of 16

NCBI non-redundant protein database (NR_prot; 1:62)             bp using Usearch (version 9, -fastx_truncate) [51]. Ampli-
using BLAST+ (BlastP) version 2.2.31 with an expect             con profiles were dereplicated, purged of singletons,
value threshold of 1e−5 [42]. The resulting best-hit was        assigned abundance and sorted by size using Usearch (ver-
obtained for each protein in the meta-exo-proteome and          sion 7, -derep_fulllength) [51]. Clustering was performed
NCBI Accession and TaxID database was compiled and              using the UPARSE algorithm [52], with concurrent de
the most likely taxonomic origin of these proteins were         novo chimaera detection using Usearch (version 9, -clus-
established using tools within the Environment for Tree         ter_otus) with a 97% identity threshold resulting in 5122
Exploration (ETE) version 3 toolkit [43]. To delineate          non-chimeric operational taxonomic units (OTUs) that
functional members of the microbial community associ-           were taken forward for analysis. Representative sequences
ated with the Spartina biomass, we cross-referenced the         for each OTU were then mapped to original sequences
16S rRNA gene phylogenetic profile with the taxonomic           using Usearch (version 7, -usearch_global). Taxonomy
origin of the meta-exo-proteome proteins.                       was assigned with QIIME [53] (version 1.9, assign_taxono-
                                                                my.py) using SILVA 132 [35] for the 16S rRNA libraries
16S rRNA gene and ITS2 amplicon sequencing and                  and UNITE v7.1 [54]. Rarefaction analysis [53] displayed
analyses                                                        curves that begin to reach asymptotic levels, indicating
Biological replicates were treated independently (N = 5)        sufficient depth for analysis but not complete diversity
for each of the 9 time points (week one–six, eight, ten,        coverage (Additional file 1: Figure S2). The taxonomy of
16 and the day 0 outgroup for a total of 46 data points).       any unassigned OTUs (N = 610), using UNITE in the
Total extracted nucleic acids were RNAse A treated in           ITS2 libraries were further classified using BLASTn
triplicate. The ribosomal 16S rRNA gene V4 region was           against the GenBank non-redundant nucleotide database.
targeted with primers, 515f-Y GTGYCAGCMGCC                      Non-fungal OTUs were discarded and missing
GCGGTAA (5′–3′) [44] and 806R GGACTACNVGGG                      taxonomies of on target OTU sequences were manually
TWTCTAAT (5′–3′) [45]. The internal transcribed re-             curated (N = 393) resulting in a total of 920 fungal OTUs
gion 2 (ITS2) region was targeted with primers, fITS7           which were subsequently analysed. Fungal OTUs were
GTGARTCATCGAATCTTTG (5′–3′) [46] and ITS4ngs                    classified into functional guilds using FUNGuild [55]
TCCTSCGCTTATTGATATGC (5′–3′) [47]. Cluster                      which assigned a functional guild to 419 OTUs from 724
identification was enhanced with a random dodecamer             matches of the original 920, this represented 51.4 ± 2.12%
sequence NNNHNNNWNNN (5′–3′) prepended to the                   mean OTU abundance across all time points and was
forward primer [48].                                            taken forward for analysis. All commands for the analysis
  16S rRNA gene polymerase chain reactions (PCR)                pipeline are available in Additional file 1: Table S3.
were performed in 25 μL volumes containing 200 μM
dNTPs, 0.5 μM 515fY-MN, 0.5 μM 806rMN, 50 ng                    Determining highly productive groups
gDNA, 0.5 U Phusion HF polymerase (#M0530) and 1x               A productivity index was used to elucidate taxonomic
Phusion HF Buffer. Thermocycling conditions included            groups with disproportionately greater CAZyme production
an initial denaturation at 98 °C for 30 s, followed by 28       per unit abundance, given by log10(∑ x mol%/abundance).
cycles of 98 °C for 10 s, 53 °C for 30 s and 72 °C for 15 s     Disproportionately productive groups were determined as
and 72 °C for 10 min. ITS2 PCR were performed as                those with an index > 0.3 in at least 1 observation.
above with thermocycling conditions including an initial
denaturation at 98 °C for 30 s, followed by 34 cycles of        Network associations
98 °C for 10 s, 57 °C for 30 s and 72 °C for 20 s, with final   Network associations between meta-exo-proteome
extension at 72 °C for 5 min. Indexing was performed            CAZyme classes and taxonomic classes were constructed
using the Nextera XT™ library preparation kit (Illumina         by grouping annotated domains (≤ 1e−10) into CAZyme
FC-131-1001). The libraries were pooled in equimolar            classes by average ∑ x mol% across the entire time
concentrations to 4 nM, spiked to 1% PhiX and run on a          course and connecting these nodes to the taxonomic
MiSeq 250 bp × 2 cartridge (MiSeq Reagent Kit v2 (500           classes the domains originated from. Classes are pre-
cycles) MS-102-2003, Illumina).                                 sented by their mean ∑ x mol% output. Taxa < 0.025 ∑ x
  The generated 16S rRNA genes libraries averaged 54,           mol% with ≤ 5 edges (connections) and CAZyme classes
929 sequences. Fastq merging was performed with                 < 1.25 × 10⁻³ ∑ x mol% were filtered for clarity. Plots
Vsearch version 1.11.1 [49]. The generated ITS2 libraries       were generated with NetworkX [56].
averaged 50,843 sequences and were processed with
ITSx [50] to filter non-fungi sequences. The resulting          Biomass composition analysis
fungi only ITS2 libraries averaged 28,972 sequences. The        Biomass was washed free of sediment through 100 μm
primer sequences were trimmed using Cutadapt (version           mesh with free flowing dH2O. Total biomass was measured
1.11.). Sequences were trimmed to global lengths of 250         as the mass balance of lyophilised material. Ash was
Leadbeater et al. Microbiome (2021) 9:48 Page 7 of 16
determined with 1 g of biomass incubated 600 °C for 24 h. proteome CAZyme profile revealed three dominant Eu-
Matrix polysaccharides were measured using triflouracetic clidean clusters of temporally abundant classes which
acid methodology [57]. Cellulose was subsequently deter- contain a diverse collection of activities (Fig. 2c). Glyco-
mined using the Updegraff and Saeman hydrolysis [58, 59]. side hydrolases (GH) were the most abundant class with
Lignin was measured as acetyl bromide soluble lignin [60] 37 families identified. GH3, GH5 and GH6 family en-
using a previously cited extinction coefficient of 17.75 for zymes were abundant; these classes are typically related
grasses [61]. to cellulose degradation, many of which were associated
to carbohydrate-binding domains (CBMs). The CBM
Statistics profile of our data highlighted two abundant Euclidean
One-way ANOVAs and Tukey’s HSD tests were performed clusters (Fig. 2d); the dominant of which contained
using SciPy [62] and Scikit [63], respectively. All data were CBM2 and CBM44 motifs associated with cellulose and
assessed for normality using the Shapiro-Wilk test. Statis- matrix polysaccharide binding and a secondary cluster
tical analyses were performed on non-normalised data. containing CBM10, CBM5 and CBM60 which have been
associated with cellulose, hemicellulose and chitin bind-
Results ing, respectively. Families associated with hemicellulose
Functional assignment of the meta-exo-proteome degradation were abundant, notably GH10, GH11 and
To identify the lignocellulolytic enzymes involved in GH16 typically associated with xylan degradation.
biomass breakdown, we employed a metaproteomic A rapid loss of dry mass was observed with a reduc-
analysis of extracellular proteins (meta-exoproteome), tion of 69% during the 16-week period. The distribution
accomplished by an affinity tagging process using a of CAZyme family proteins coupled with the biomass
membrane-impermeable biotinylation tag [64]. Because composition revealed successional targeting of the major
lignocellulose is an insoluble macromolecule, it generally lignocellulose biopolymers (Fig. 2a, b), that temporally
has to be broken down by extracellular enzymes. Many synchronised with the abundance of CAZyme proteins
of the enzymes involved adhere to the lignocellulose or within the meta-exo-proteome. The largest loss in cellu-
the microbe, and the use of surfactants to extract them lose occurs during the first week, most likely conducted
leads to cell lysis and contamination with intracellular by the highly abundant GH6 and GH5 family enzymes
proteins. The tagging approach avoids the problem of coordinated with CBM2 and CBM44 domains targeting
intracellular contaminants, allowing a focus on extracel- exposed cellulose microfibrils generated as a result of
lular and cell surface proteins. the mechanical fractionation of the Spartina anglica
Annotation of the transcriptome revealed 103 CAZyme biomass, while lignin degradation appears rate limiting
families (≤ 1e−5 and transcripts per million (TPM) ≥ 1) (weeks one and two). During weeks three to five, there
across 44,334 ORFs (excluding glycosyl transferases), the was an increased rate of matrix polysaccharide loss which
total proportion of CAZYmes across all transcriptomic corresponds to an increased abundance of GH11, GH10,
databases was 429.27 ± 62.16 TPM (Additional file 1: Figure GH13 and GH43 family enzymes coupled with a concomi-
S3). Proteomic analysis identified 11,268 proteins within the tant decline in the rate of cellulose hydrolysis, suggesting
meta-exo-proteome, of which 320 (≤ 1e−10) were annotated matrix polysaccharides limited cellulose access. During
as putative carbohydrate-active domains (CAZyme) within weeks 6 to 16, the rate of cellulose deconstruction in-
252 peptide matching ORFs across 81 CAZyme families. creases and a degradative equilibrium was established.
Families present within the metatranscriptomic databases An interesting finding was that carbohydrate esterases
that were absent from the meta-exo-proteomes were largely (CE) were more abundant than many GH family enzymes
families not specific to lignocellulose degradation or families (Fig. 2b), particularly those from family 1 (CE1) that pre-
usually associated with core intracellular activities (AA6, dominantly presented as feruloyl esterases and acetyl xy-
CE14, GH32, GH57, GH73, GH92 and GH108) or CAZyme lan esterases. Auxiliary activities (AA) established largely
families containing enzymes with both intracellular and as encompassing oxidative enzymes, while present within
extracellular localisations (GH1, GH2, CE7) with the excep- the enzymatic profile, were not abundant. We only identi-
tion of a small subset of predominantly pectin-targeting fied two AA families; AA7 (glucooligosaccharide oxidases
CAZymes: CE2, CE7, CE8, CE12, CE15, GH28 and GH105 and chitooligosaccharide oxidases) which were transiently
and AA4 (Additional file 1: Figure S3). Instead, the exo- present during week three and AA2 (containing class II
meta-proteome predominantly consisted of pectin-targeting lignin-modifying peroxidases) that were present at low
CAZYme families CE3, CE4, CE6, PL1, PL4, GH35 and abundances throughout the study.
GH43.
CAZyme homologues (≤ 1e−10) represented only 0.72– Taxonomic affiliation of meta-exo-proteome proteins
0.99 mol% of the total meta-exo-proteome concordant Fungi and archaea were poorly represented in our meta-
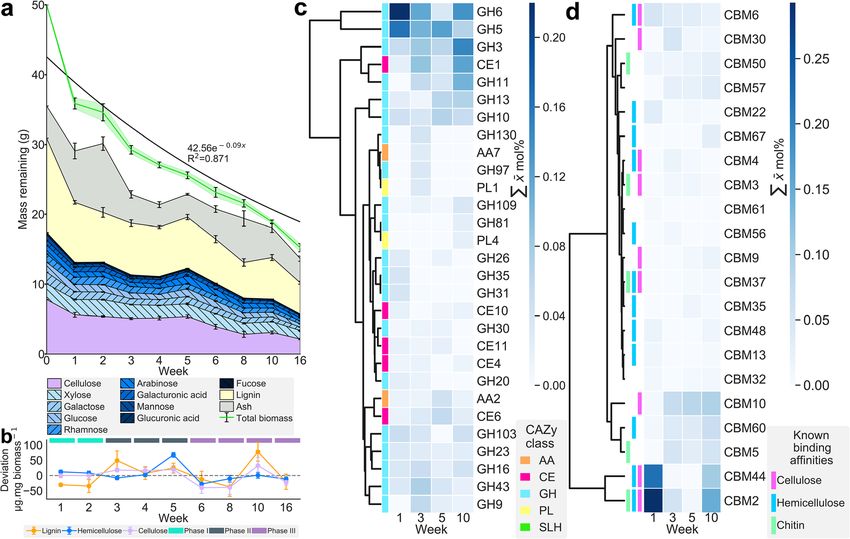
with previous in vitro reports [65]. The meta-exo- proteome annotations and were only responsible forLeadbeater et al. Microbiome (2021) 9:48 Page 8 of 16 Fig. 2 Temporal changes in lignocellulose composition and the distribution of carbohydrate-active enzyme domains within the meta-exo- proteome. a Lignocellulose composition of remaining in situ Spartina anglica biomass. b Rate of compositional change within the lignocellulose displayed as μg mg biomass−1, the dashed line represents 0 change; L, lignin; H, hemicellulose; C, cellulose. c Euclidean clustering of the enzyme class profile (≤ 1e−10), the 30 most abundant classes are displayed; GH, glycoside hydrolase; CE, carbohydrate esterase; AA, auxiliary activity; PL, polysaccharide lyase. d Euclidean clustering of the carbohydrate binding domain (CBM) profile (≤ 1e−10). Error bars (a) represent SE (n = 25). Figure plotted with [66] 0.28–1.46 and 0.04–0.2 mol% of the total meta-exo- (predominantly Lutibacter, Wenyingzhuangia and Flavobac- proteome, respectively. Bacteria produced 99–100 mol% terium), Cellvibrionaceae, Saccharospirillaceae and Reinekea, CAZymes. Indeed, within the CAZyme profile, the only Prolixibacteraceae (predominantly Draconibacterium, Pro- notable proteins not of bacteria/archaea origin showed lixibacter and Sunxiuqinia), Marinilabiliaceae (Saccharicri- homology to Annelida (AA2) and Chlorophyta (AA3) nis), Saccharospirillaceae (Reinekea) and Bacteroidaceae enzymes. This was concordant with the total meta-exo- (Bacteroides) as dominant CAZyme producers (Fig. 3). proteome, of which 66.5–79.5 mol% originated from Groups with disproportionately high CAZyme productivity bacteria/archaea. relative to their abundance were revealed as Bacteroidaceae Proteins that originated from families also identified in the (Bacteroides), Paludibacteraceae (Paludibacter), Flammeo- 16S rRNA gene-derived community profile accounted for virgaceae (Flexithrix), Sphingobacteriaceae, Melioribactera- 75 ± 6.9% CAZyme mol%. The results indicate Proteobac- ceae (Melioribacter), Chromatiaceae, Peptococcaceae and teria and Bacteroidetes are the dominant producers of ligno- Salinivirgaceae (Salinivirga) (Additional file 1: Figure S5). cellulolytic enzymes (Fig. 3a). Gammaproteobacteria and CAZyme productive but poorly resolved genera included Deltaproteobacteria were responsible for 39.03 ± 13.65% Teredinibacter, Sporocytophaga, Aquimarina, Hyunsoon- and 7.48 ± 3.95% of total CAZyme mol%, respectively, while leella, Planococcus, Pseudosphingobacterium, Desulfosporosi- Bacteroidia, Flavobacteriia and Cytophagia were responsible nus, Formosa, Simiduia, Sorangium, Lentimicrobium, for 12.45 ± 6.30%, 9.25 ± 2.55% and 7.45 ± 3.03% of the total Arcticbacter, Desulfobulbus, Saccharophagus and Chitino- CAZyme mol%, respectively. This is concordant with phaga (Additional file 1: Figure S4). the 16S rRNA gene abundance of these two phyla, Fungi were identified within the sediment and ligno- which is maintained at 78.43 ± 4.10%. Investigations cellulosic material but no CAZymes originating from revealed Alteromonadaceae (Alteromonas, Rheinheimera fungi were detected. Significant changes in fungal OTU and Catenovulum), Vibrionaceae (Vibrio), Flavobacteriaceae richness was observed (ANOVA, F8,36 = 14.95, p < 2.29
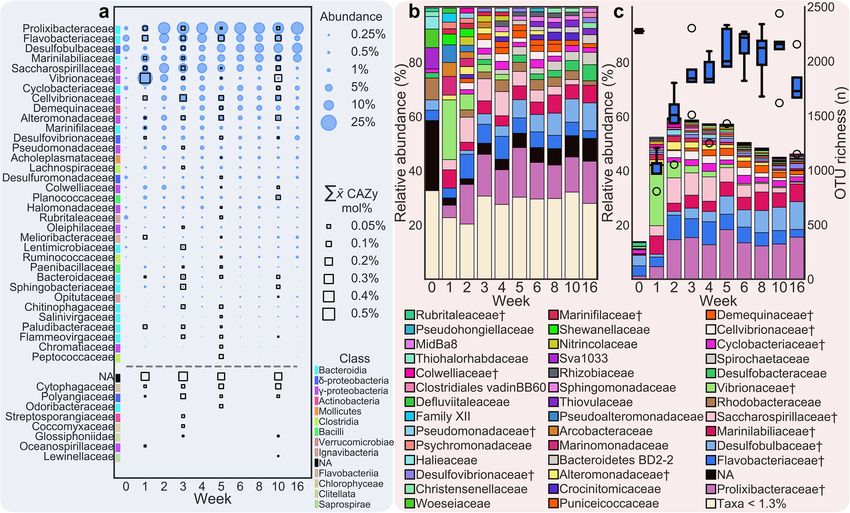
Leadbeater et al. Microbiome      (2021) 9:48                                                                                      Page 9 of 16

 Fig. 3 CAZyme-producing taxa at family level resolution and their respective CAZyme contributions. Microbiome and proteomic data is displayed
 as the mean of n = 5 and n = 3 respectively. a Distribution of CAZyme-producing lineages with respective CAZyme productivity (≤ 1e−10), taxa
 below the dashed line were not identified in the community profile. b Bacteria profiles elucidated from 16S rRNA gene sequence homology,
 each time point is the mean of five biological replicates. c CAZyme productive bacteria profile, the non-CAZyme productive taxa have been
 filtered, boxes display OTU richness, no further filtering was undertaken for these data. NA, not assigned; dagger indicates CAZyme producer.
 Figure plotted with [66]

× 10−9) with a significant increase (ANOVA, F1,8 =                       strategy revealed the dominant guild to be saprotroph,
29.17, p < 0.0006) between week one and the observed                     followed by pathotroph-saprotroph (Additional file 1:
peak during week two from 253 ± 35 to 360 ± 18.54,                       Figure S12), of which the most prevalent trophic modes
respectively, before entering a gradual but continuous                   were undefined saprotroph which enriched gradually
decline to week 16 (N = 180 ± 24.2) (Additional file 1:                  from 32.3% in the day 0 sediment outgroup to 86.1 ±
Figure S11). Fungal taxonomy was poorly resolved with                    3.32% at week 16, endophyte-lichen parasite-plant
558 of 920 OTUs identified to class level. Identified                    pathogen-undefined saprotroph which were consistent
fungi were predominately Ascomycetes (56.38 ± 4.07%)                     between week two and 16 (20.1 ± 1.91%) and animal
with a small contribution from Basidiomycota (5.22 ±                     pathogen-endophyte-lichen parasite-plant-pathogen-soil
1.57%); however, in the day 0 sediment Rozellomycota,                    saprotroph-wood saprotroph which was a large compo-
Chytridiomycota and Zygomycota were observed as very                     nent only during weeks one to three (13.8 ± 1.72%; Add-
minor components.                                                        itional file 1: Figure S11), both of which are poorly
   Saccharomycetales and Pleosporales were consistently                  resolved definitions. Interestingly, modes associated with
abundant within the lignocellulose associated fungal                     the turnover of lignocellulosic substrates such as wood
community throughout the 16 week time course (25.6 ±                     saprotroph and leaf saprotroph were more abundant in
3.23% and 10.85 ± 1.74%, respectively) (Additional file 1:               the day 0 sediment outgroup than in the lignocellulose
Figure S11). Notable components of the early fungal                      associated community.
profile included Hypocreales, Capnodiales and Tremel-                       Filtering out non-CAZyme productive lineages re-
lales (weeks one through to three) before rapidly declin-                vealed a rapid enrichment for CAZyme-producing
ing and seemingly displaced by Microascales which                        families relative to the day 0 sediment outgroup. This
enrich and dominate the profile between week five (1.82                  suggests that within the sediment, a maximum of 13.9%
± 1.2%) and six onwards (10.2 ± 4.45%). Functional clas-                 of the bacteria/archaea microbiome at family level func-
sification of these OTUs in terms of nutrient acquisition                tioned as lignocellulose degraders while OTU richness
Leadbeater et al. Microbiome        (2021) 9:48                                                                                           Page 10 of 16

was highest (2277). During the first week within the bio-                     mechanistic strategy was employed by the major CAZyme-
mass, we observed an enrichment in CAZyme product-                            producing consortia (Fig. 4).
ive lineages of 3.77 ± 0.11 fold to 52.40 ± 1.51% of the                        Gammaproteobacteria maintain unparalleled levels of
total community while OTU richness declined (1020 ±                           CAZyme production across the time course despite a
65), increasing to 59.56 ± 1.66% in week two (Fig. 3b, c).                    reduction in their overall abundance. This is due to an
We observed significant variation in OTU richness over                        enrichment in clades exhibiting high CAZyme produc-
time (ANOVA, F8,36 = 17.59, p < 0.000005), increasing                         tion, e.g. Alteromonadaceae, Saccharospirillaceae and
significantly from week one to three and all time points                      Vibrionaceae. Cellvibrionaceae, Alteromonadaceae and
thereafter (Tukey HSD, p < 0.015). OTU richness con-                          Saccharospirillaceae are not abundant in sediments but
tinued to increase toward day 0 outgroup levels while no                      progressively became major components of the Gamma-
significant decline in the abundance of CAZyme-                               proteobacteria profile in both the community profile and
producing members was observed during the time                                their CAZyme output. Vibrionaceae appear transient
course (ANOVA, F8,36 = 1.78, p > 0.114) suggesting the                        with peak abundance during week one (22.98 ± 3.27%)
colonisation of diverse heterotrophs and secondary                            which precedes a steady decline (5.25 ± 1.04% and 2.70%
metabolizers. Concordantly, the total CAZyme mol%                             ± 0.70% in weeks two and three, respectively), indicating
was not significantly different throughout the time series                    that this clade represent rapid colonisers and opportunistic
(ANOVA, F3,8 = 1.06, p > 0.42).                                               oligotrophs. Vibrionaceae was predominantly comprised of
  We noted a degree of congruence between the enzymatic                       two genera, Vibrio and Photobacterium. Subsequently,
profiles of the most productive groups within Proteobac-                      Vibrionaceae appears to be outcompeted by Alteromonada-
teria and Bacteroidetes (Fig. 4, Additional file 1: Figures                   ceae, Saccharospirillaceae (Reinekea) and Cellvibrionaceae
S4–7). The most abundant CAZyme classes (Fig. 2c, b)                          (predominantly Marinagarivorans), accounting for much of
with the exception of GH6, CBM2, CBM10 and CBM44                              the decline in the Gammaproteobacteria profile in weeks
that were produced exclusively by Gammaproteobacteria,                        one to five. Identifiable Alteromonadaceae genera included
represented a core suite of activities (Fig. 4) and were pro-                 Alteromonas, Glaciecola and Paraglaciecola. Gammaproteo-
duced by multiple divergent lineages, suggesting a common                     bacteria abundance is supplanted by Deltaproteobacteria

 Fig. 4 Network associations among meta-exo-proteome CAZyme classes and taxonomic lineages. Data displayed is the mean of the four time
 points. Node area is proportional to productivity and abundance for taxa and CAZyme class respectively. Edge colour and width is relative to
 output size. Taxa < 0.025 ∑ x mol% with ≤ 5 edges and CAZyme classes < 1.25 × 10⁻³ ∑ x mol% have been filtered. Glycoside hydrolases (GH)
 families; blue nodes, carbohydrate esterases (CE) families; red nodes, auxiliary activities (AA) families; orange nodes, polysaccharide lyases (PL)
 families; yellow nodes, carbohydrate-binding domains (CBM) families; purple nodes. NA, not assigned
Leadbeater et al. Microbiome   (2021) 9:48                                                                       Page 11 of 16

groups; Desulfobulbaceae, Desulfuromonadaceae and                this biopolymer is not actively targeted for metabolism
Desulfovibrionaceae and Bacteroidetes groups; and Pro-           by the microbial community. Salt marsh sediments are
lixibacteraceae (Draconibacterium and Roseimarinus),             known to be significantly enriched in lignin-derived high
Flavobacteriaceae (Lutibacter) and Marinilabiliaceae             molecular weight polyphenols, with these increasing in
(Labilibacter). Families within Firmicutes and Verrucomi-        concentration with depth [10, 11, 30, 70]. Conversely,
crobia were active CAZyme secretors despite low apparent         the more biologically available polysaccharides reduce
abundances, particularly Peptococcaceae, Planococcaceae          with depth as they are known to be preferentially
and Paenibacillaceae and Rubritaleaceae.                         targeted [71–73]. As lignin interpenetrates the core
                                                                 polysaccharides in the lignocellulosic matrix, it must be
Discussion                                                       removed before the internal polysaccharides are access-
We examined the process of surface level lignocellulose          ible for digestion. Oxidative enzymes are the predomin-
decomposition within a natural salt marsh environment            ant mechanism exhibited in terrestrial systems to modify
demonstrating a framework wherein lignocellulose de-             and degrade lignin, yet in our study, only AA2 family
composition can be monitored in situ. Our data suggest           members were present at low abundances. These
a large proportion of the total native microbiome is             enzymes attack lignin moieties to modify the structure
lignocellulose responsive and capable of rapid colonisa-         and it is unlikely they are responsible for cleaving high
tion and restructuring to take advantage of this annual          molecular weight phenolics that are observed in salt
influx of carbon. Our metaproteomic studies revealed an          marsh sediments. These findings suggest that native salt
enrichment for activities that target linkages between lig-      marsh organisms have enzymes responsible for lignin
nin and polysaccharides as well as glycanohydrolases             modification that are not yet known or that they adopt
and a marked sparseness of oxidative enzymes that at-            other mechanisms able to facilitate access to the valuable
tack lignin.                                                     sugars present in lignocellulose.
   It is notable that although the total biomass in our             Instead, we note that the salt marsh meta-exo-proteome
mesh bags was reduced by about 70% over a 16-week                has a high representation of carbohydrate esterases (CE),
period, our results conform to a first order decay model         particularly from family 1 (CE1). CE1 family enzymes
alluded to in previous experiments [28, 67–69]. These            function non-oxidatively to remove cinnamoyl and acetyl
previous studies suggest the majority of particulate de-         esters from xylans, disrupting the lignin-carbohydrate
composition occurs within the first year of entry into the       complex interface between hemicellulose and lignin, and
system and proceeds through three phases: the leaching           hemicellulose and cellulose respectively [18, 74]. Lignin-
of soluble compounds, decomposition and a final refrac-          carbohydrate complex linkages are thought to consist
tory phase characterised by diminished rates of decom-           mainly of aryl ester (from ferulic acid to arabinose in
position [28, 67–69]. Valiela et al. [67] suggest the            grasses like Spartina anglica) and aryl ether bonds,
refractory period is confined to decomposition rates             hydrolysis of which decouples the lignin, exposing the
below 0.4% day−1. In our study, the decomposition rates          surface of the remaining polysaccharides [75]. The CE1
for the refractory period during weeks eight and 16 were         family includes a range of esterases, especially those which
observed to be 0.22 ± 0.087% day−1 and 0.176 ± 0.03%             hydrolyse ester links between arabinoxylans and ferulic
day−1 respectively, suggesting our experiment ran into           and coumaric acid residues. Ferulic acid residues in arabi-
the refractory period.                                           noxylans are particularly important in providing linkages
   We assessed surface level, aerobic lignocellulose decom-      between arabinoxylan chains and between arabinoxylans
position as it has been shown to be significantly more           and lignin, thereby contributing significantly to lignocellu-
efficient than sub-surface decay [30]. Valiela et al. [30] ex-   lose recalcitrance [18, 76, 77]. CE1 also contains xylan
plored the relative composition of Spartina alterniflora         acetylesterases that remove acetyl groups from arabinoxy-
for 24 months beginning in winter. While the study find-         lan, having major impacts on their three dimensional con-
ings are not directly comparable to our own due to differ-       formation and ability to bind cellulose [78]. Previous
ing location, start date and species of biomass, which           compositional analysis of decomposed lignocellulose in
significantly affects decomposition [69], there is an un-        salt marshes have revealed trans-ferulic acid was respon-
deniable synchrony between the profiles of lignocellulose        sible for 57–82% of the total lignin loss which agrees with
degradation in both studies. Both studies demonstrated an        the mechanism identified in our study [79]. This indicates
initial increase in cellulose and hemicellulose, sequentially    that the linkages holding lignin to the polysaccharides of
followed by lignin degradation, then hemicellulose degrad-       lignocellulose may be major targets to allow GHs access
ation. The hemicellulose degradation then coincides with         to their substrates. We contend that this mechanism is
cellulose degradation while lignin increases.                    favourable within salt marshes in contrast to terrestrial
   The relative enrichment in lignin, accepted as the most       systems due to the liquid medium facilitating desorption
recalcitrant component of lignocellulose [18], suggests          of dissociated lignin macromolecules into the surrounding
Leadbeater et al. Microbiome (2021) 9:48 Page 12 of 16 waters, circumventing the requirement for total decon- We also identified an additional 38 families that were not struction. This mechanism could explain the enrichment previously known to actively secrete lignocellulose-active of persistent lignin-rich particles known to accumulate in enzymes. The 42 CAZyme-producing families reported salt marsh sediments through the cleavage of high mo- here underpin long-term carbon sequestration using a lecular weight phenolics. These phenolics are then likely mechanism that appears to favour the degradation of subject to oxidative modification by the low abundance complex polysaccharides by selectively avoiding lignin AA2 family enzymes causing them to slowly become degradation. This process not only expands the pool of biologically available. stored carbon but also reduces complex carbohydrates to Previous studies suggest lignocellulose degradation biologically available molecules within the extracellular within sediments is driven by bacteria, which is space for the wider microbial community. supported by our data [32, 34], yet fungi are known to The CAZyme-producing Gammaproteobacteria de- populate salt marsh sediments but their function, scribed here appeared to be early colonisers of lignocellu- community ecology and interactions remain elusive [80]. lose that undergo taxonomic restructuring to favour We did identify a handful of fungal families with potential heterotrophic lineages. Gammaproteobacteria are displaced historical connections to lignocellulose, predominantly by CAZyme-producing groups belonging to Bacteroidetes Pleosporaceae, Hypocreaceae, Nectriaceae, Sordariaceae and Deltaproteobacteria clades. The results suggest the and Saccharomycetales [81]. Nutrient acquisition strat- Gammaproteobacteria families are the ecologically domin- egies of the identified fungi revealed the dominant trophic ant surface level lignocellulose degraders. The divergent mode to be saprotroph (acquire nutrients from dead or- families identified within Bacteroidetes and Deltaproteobac- ganic matter) and to a lesser extent pathotroph (acquire teria suggest they are highly active at surface levels, but nutrients by attacking cells) and combinations thereof. likely dominate carbon cycling in the oxygen-depleted cores This suggests most fungi were acquiring nutrients from of biomass aggregates and in shallow to deep sub-surface alternative dead organic matter or were utilising a patho- sediments as they have been identified in abundance within trophic acquisition strategy where lignocellulose is not a deeper sediments. However, their ecological functions were primary target. A notable observation was that wood previously unknown [84]. saprotrophs and leaf saptrotrophs, which would be Well studied examples of marine lignocellulolytic Gam- expected to thrive on the dead Spartina biomass which maproteobacteria include Saccharophagus degradans and included stems, leaves and sheaths, were present in the the closely related Teredinibacter turnerae, belonging to sediment but were not abundant on the lignocellulosic families Alteromonadaceae and Cellvibrionaceae, respect- material. As fungi are orders of magnitude less abundant ively. Both families were abundant within the lignocellu- than bacteria in this system [82, 83] and we did not detect lose responsive microbiome and identified to be highly lignocellulolytic enzymes from these groups within the productive of CAZymes and interestingly, neither family meta-exo-proteome despite fungal enzyme sequences be- was well represented within the day 0 sediment outgroup ing well represented in archive databases, our data would suggesting they function as saprotrophs within the salt suggest their influence on lignocellulose decomposition marsh. S. degradans is a well-characterised free-living het- for material within salt marsh sediments is negligible and erotroph that appears fully capable of deconstructing they likely target alternative sources of organic matter that complex plant cell wall polysaccharides and many other are present or cohabit within the lignocellulosic aggregate. biopolymers [85, 86]. The use of these bacteria as a source Bacterial families that have been implicated with salt of enzyme cocktails for lignocellulose saccharification has marsh lignocellulose degradation based on isotope probe been explored due to the broad complement of CAZymes experiments include Desulfobacteraceae, Spirochaetaceae, [87] and full cellulolytic system [88]. Dominant CAZymes Kangiellaceae [32] and selective enrichments include Fla- within S. degradans culture supernatant include GH3, vobacteriaceae, Cyclobacteriaceae, Pseudomonadaceae GH5, GH6, GH9, GH10 and GH16 many of which are and Halomonadaceae [34]. We did not observe the groups multi-domain with a prevalence of CBM2 and CBM10 reported by Darjany et al. [32] to be active lignocellulose containing proteins as well as CBM6, CBM13 and CBM32 degraders, since the majority of lignocellulose deconstruc- [89], all of which collectively correspond to highly abun- tion occurs within the extracellular matrix the breakdown dant Gammaproteobacteria-associated CAZyme families products are available to all microbes within proximity, identified within our exo-meta-proteomics. therefore the 13C approach employed by Darjany et al. T. turnerae is a facultative intracellular endosymbiont [32] possibly identified benefactors of breakdown products found in wood-boring bivalves, it is cellulolytic with rather than organisms actively degrading lignocellulose. demonstrated cellulose degrading capability and more We did identify all major groups reported by Cortes- recently it has been found to harbour a complex array of Tolalpa et al. [34] in our in situ study which confirm these xylan degrading enzymes and lytic polysaccharide mono- groups to be active secretors of lignocellulolytic enzymes. oxygenases [90, 91], yet it possesses a relatively small
You can also read