Responses to Reviewer 1 - ACP
←
→
Page content transcription
If your browser does not render page correctly, please read the page content below
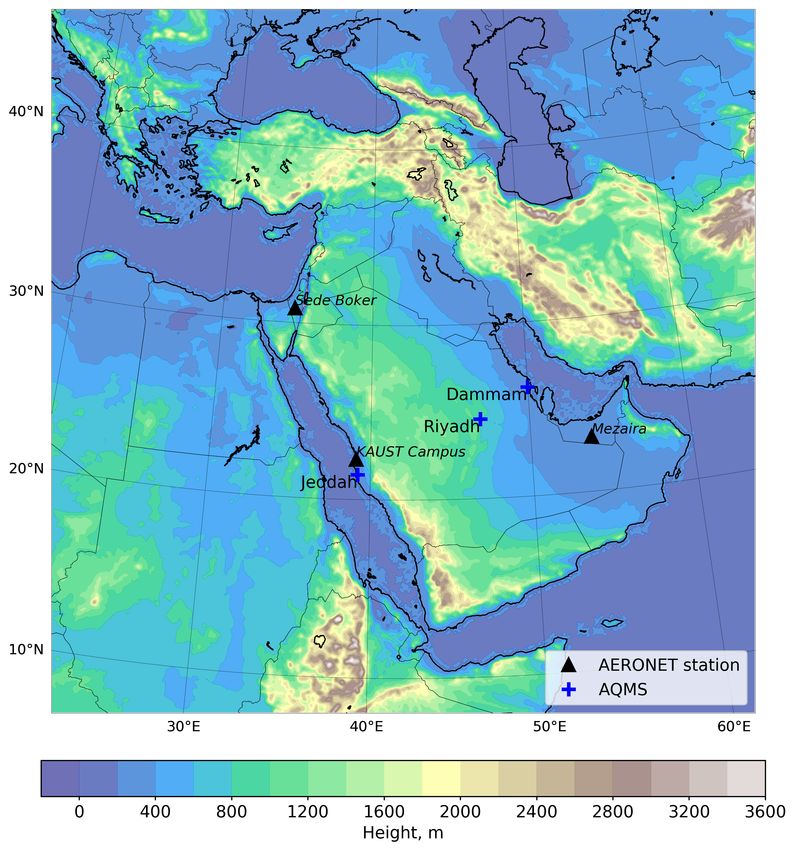
Responses to Reviewer 1 This paper shows the dust and non-dust aerosol components over the Middle East that are available from two reanalysis products, MERRA-2 and CAMS, and WRF-Chem model simulations. It first compares the 10-m wind speed among the products, then compares AOD and size distributions with remove-sensing data (such as MODIS MAIAC and AERONET) and PM2.5/PM10 concentrations with ground-based measurements. With the results from WRF-Chem simulations and reanalysis products, the aerosol composition of PM2.5 and PM10 is presented and days of PM above the reulatory standard are estimated. I found this paper is interesting in the sense that an evaluation of model and reanalysis products is specifically performed for the Middle East region with, albeit limited, remote sensing and ground-based measurements, and the seasonal and annual levels of PM are presented. I however have quite some comments regarding the presentation and understanding of the products used in the paper, and recommend substantial revision before accepting for publication on ACP. I believe that the revision is not difficult to deal with although it could be extensive. We thank the reviewer for the valuable comments. Despite poor air quality, the Middle East has very sparse air quality observations. So it is essential to thoroughly test the modeling tools. This is the first attempt to reconcile observation, models, and reanalysis products in this region. All references supporting our response are placed at the end of the text. The reviewer's questions are in black. Our answers are in blue. For the presentation style in general: - Abstract should contain only one paragraph with acronyms spelled out (e.g., ME). - Introduction section is too long - should be more concise and more relevant to the point of the study. It is not a literature review. - Conclusion section is also too long and unfocused. It has 14 paragraphs! It should be consolidated with key points summarized and highlighted, not list everything you have done. We agree and have revised the abstract, introduction, and conclusions sections accordingly. Aerosol composition: there are no data to evaluate the models. The surface measurement data are for PM, not chemical species. Besides, the models do not include nitrate and ammonium, and it seems they don’t have the chemical mechanisms for producing secondary organic aerosols. Therefore, the chemical composition from the model omits some important components. The problem should be acknowledged at least. Is there any reference for the aerosol composition in the region? In-situ air quality observations in the Middle east are scarce. It is one of the known problems for air quality research in this area. The things are simplified a bit by the fact that in the ME dust dominates aerosol pollution. E.g., Calipso records dust in 95% of profiles (Osipov et al., 2015). The effect of nitrates, ammonia, and organics on AOD and PMs is insignificant in comparison with dust therefore the employed chemical scheme (GOCART-RACM) is adequate. To support this conclusion, we have conducted a laboratory analysis of the chemical composition of soil and dust deposition samples that show a little presence of organics and ammonium (Prakash et al. 2016; Engelbrecht et al., 2017). According to (Engelbrecht et al.,
2017) in 2015 the annual average weight percentages of soluble ions of ammonium (NH4) and sulfate (SO4) in deposition samples taken at four sites at the KAUST campus are 0.05% and 2.513%, respectively. It means that available ammonium may neutralize at maximum 5% of sulfate mass. The actual contribution of ammonium sulfate should be lower, as some ammonium may also be bound as ammonium nitrate, ammonium phosphate, or ammonium chloride. We have added this explanation to the revised text (see Sec 4.1, last paragraph). Reanalysis products: It should be pointed out that the reanalysis products from MERRA-2 and CAMS-OA are the reanalysis of AOD, not the mass concentrations of individual aerosol species. The mass of individual aerosol specie is adjusted mostly proportionally according to the differences between the AOD from native model simulation and after the assimilation of satellite data. Also, in general, a better understanding of the reanalysis products and other products is needed. We are aware of the reanalysis machinery and mentioned in the original text on p. 4, line 88: “They improve the aerosol total column loadings through the assimilation of observed AOD but are not capable of assimilating the aerosol vertical structure and chemical composition.” The representatives of both MERRA-2 and CAMS development teams are co-authors on this paper. Comparisons with data: The comparison with AERONET AOD is not an independent evaluation of WRF-Chem and MERRA-2, because the WRF-Chem is “tuned” to match AERONET AOD and MERRA-2 assimilates AERONET AOD. This evaluation should be properly addressed. This is partially correct. All satellite retrievals use AERONET observations for calibration. MERRA-2 assimilates AERONET AOD, but CAMS-OA does not. In WRF-Chem, we tuned to the annual average AOD to fit AERONET observations. We did not tune the temporal correlations between the model and AERONET data, just the mean bias. In this sense, the correlation coefficient, which is about (0.62-0.85), between WRF-Chem and AERONET AOD provides an independent evaluation of the WTF-Chem performance (see Table 4). We clarified this issue in the text (Sec. 5.2.2, last paragraph). Also, for the AOD comparisons with both AERONET and satellite data, it is not clear if the comparisons were done under the same spatial and temporal conditions (e.g., models are sampled under clear-sky only condition or all-sky, if model and data are temporally matched). The model, reanalysis, and observations are temporarily matched. It was mentioned in the original text (p. 17, line 364): “Because AERONET conducts observations only during the daylight time, we interpolated WRF-Chem, MERRA-2, CAMS-OA AODs to the AERONET measurements times and then conducted time averaging to make simulated and observed AODs consistent.” To me, a major conclusion is that the PM2.5 concentrations over the Middle East (at least at the places the study was examined) almost never below the WHO standard because of the dominance of dust in PM2.5 which cannot or very hard to mitigate. Even if all anthropogenic emissions are shut down, the air quality in the Middle East will not improve. What is the implication for that? How to improve the air quality in the Middle East under such circumstance? This problem should be discussed. WHO provides the guidelines, not air quality standards, that are subject to the national regulations. Yes, one of the important implications of this study is that anthropogenic pollutants in the cities are coming on top of the high aerosol background maintained by natural dust aerosols. This puts stricter requirements on anthropogenic pollution control. The effect of
natural pollution could be alleviated by using specific architectural planning, increasing in-city vegetation cover, and providing air quality forecasts to alarm the population about hazardous air quality. Our work is well in line with these ideas. The text is extended to include this discussion in page 32, in the conclusion section. Specific comments: Page 1, line 4: Spell out “ME”. Fixed Page 2, line 26: “mass budget” – it should be “emission budget”. Fixed Page 2, line 55-56: AVHRR was not designed to measure column aerosol properties. It was designed to observe clouds, surface temperature, and vegetation but later was expanded to retrieve aerosols over the ocean. This sentence was removed due to the reorganization of the introduction section. Page 3, line 57: Change “CALIOPE” to “CALIOP”. Fixed Page 4, line 92: “we improve the latest. . .emission. . .” does not sound appropriate. You just use the new SO2 emission data set. What is the spatial resolution of the new SO2 emission data set from Liu et al. 2018? Does it match the WRF-Chem spatial resolution? Do you have to do “downscaling” or interpolation? It is not precisely correct. We added ship emissions to OMI-HTAP and implemented (and improved in comparison what was there) this dataset in WRF-Chem. We modified the text to make it sound more appropriate (Sec. 4.1, 2nd paragraph). We also added a reference to our recently published paper, where this emission dataset has been used. The dataset is built initially on a 0.100x 0.100 grid, and we conservatively interpolated the emissions on WRF-Chem 10 km x 10 km grid. Page 6, line 123: Which wavelength is your chosen reference wavelength? What the wavelengths pair you used to calculate the Angstrom Exponent? Or did you use the Angstrom Exponent provided by AERONET? We now mention (Sec. 2.1, after formula 1) in the text that we use the Angstrom exponent from AERONET that is provided for the 440-675 nm waveband. Page 7, line 167-168: “MERRA-2 assimilates AOD at 550 nm from the AVHRR over the oceans”: This was done before the MODIS observations. MERRA-2 assimilates the MODIS AOD over the oceans since 2000. This is correct. As explained in Table 2 from (Randles et al., 2017), since 2000 MERRA-2 assimilates MODIS and MISR data (over land and ocean) on the Terra satellite which has an equatorial overpass at 10:30 am UTC, while AVHRR has mostly orbited with the afternoon equatorial crossing time. Therefore MERRA-2 continued using AVHRR data over the ocean until 2002 when the Aqua satellite was launched. Since Aqua has an orbit with the equator
overpass at 2:30 pm, AVHRR data was no longer needed for coverage. This information was added to the revised paper (see Sec. 3.1). Page 7, line 169: “specially processed MODIS observations. . .”: What product is that? Any references for such “non-standard” product? Randles et al. (2017) in section 3 (subsection d) gives details on the aerosol observing system used in MERRA-2 for assimilation, including bias correction (see Sec. 3.1). Page 7, line 184: “CAMS-OA assimilates MODIS observations”: Be more specific on what MODIS product(s) it assimilates. CAMS-OA assimilates MODIS AQUA and TERRA AODs. It uses observations from Collection 5 since 20090901, and Deep Blue since 20150902. The clarification is added to the revised text (Sec. 3.2, last 2 sentences). Page 8, line 200: “wavelengths larger than 450 km”??? We nudge only long waves. The text is corrected to read: “We only nudge waves with wavelengths longer than 450 km.” (Sec 4, 2nd paragraph). Page 9, section 4.1: SO2 is oxidized to form sulfate aerosol. It is described that gas phase SO2+OH reaction is done with the RACM, but it is not clear how the heterogeneous reactions are treated. Such description should be added. Oxidation of SO2 into sulfate is calculated within the GOCART aerosol module. Calculation of OH and other chemical reactions is done within RACM. There are no heterogeneous reactions in the RACM chemical mechanism, only gas-phase chemistry. The reference to (Stockwell et al., 1997) is in the original text. We clarified this point (Sec 4.1, 1st paragraph). Page 9, line 234: “the first bin appears to be very poorly populated”: Why? The small particles should be transported by the winds more easily than the larger particles. Explain. This discussion is related to sea salt. The sea salt droplets are relatively large and there is little mass accumulated in the first bin, therefore it is relatively unimportant. The text was corrected in a few places to clarify this issue. Page 10, line 260-261: What was the error that you are correcting? Simply saying it was corrected because it was incorrectly calculated does not help the readers/users. We have corrected three essential drawbacks in the code. These corrections have been tested and implemented in the official WRF-Chem release v4.1.3 (released on Nov 25, 2019). In the text, we provided a brief description of each of them (see Sec. 4.2). We also submitted a paper to GMD, where the effect of those errors has been quantified. Firstly, we show that the diagnostic output of PM2.5 surface concentration was underestimated by 7% and PM10 was overestimated by 5%. Secondly, we demonstrate that the contribution of sub-micron dust particles was underestimated in the calculation of optical properties and thus, AOD was consequently underestimated by 25-30%. Thirdly, we show that an inconsistency in the process of gravitational settling led to the overestimation of the dust column loadings by 4-6%, PM10 surface concentrations by 2-4%, and the rate of dust gravitational settling by 5-10%.
Page 10, section 4.2: I don’t think the bug-fix needs to be described in a devoted section. It can
be summarized in a few sentences in the model description.

Sorry, we prefer to present this information in a separate section.

Page 12, Figure 3 caption: change “for” to “from”.

Fixed

Page 11-13, section 5.1: Why not compare soil moisture and precipitation, since you mentioned
on page 11 that dust emission and deposition are sensitive to the soil moisture and
precipitation.

The ME, and especially the Arabian Peninsula, where primary dust sources are concentrated,
are arid regions. Winds are the primary driver of dust generation there. The precipitation is
sporadic, and soil moisture is always low. A comparison of soil moisture and precipitation could
be essential in other regions of the world.

Page 14, line 321: What is “the lower atmospheric layer”? i.e., what is the altitude range the
dust is emitted into? Or is it emitted into the lowest atmospheric layer? Please clarify

In the model, dust is emitted in the lowest model layer, but here we discuss the physical process in the
real atmosphere. Saltation injects dust particles at about 0.1 m height (Martin and Kok, 2017). Dust is
mixed up by turbulence in the near-surface atmospheric layer. It is a well-known process, and we do
not mean giving here extra details.

Page 14, line 324-325: “But because. . .” this sentence has been said in the WRF-Chem
description section. It does not belong here anyway.

We agree. This sentence is removed.

Page 14, line 328-329: “WRF-Chem underestimated. . .” What is the evidence for that? Is there
any reference or from your own simulation describing that problem? This contradicts the
findings by Kok et al. that global models overestimate the fine mode aerosols but
underestimate the coarse mode aerosols.

Please see Figure 4 and explanations therein. Kok (2011) found that the models overestimate
the emission of a fine dust mode, and Adebiyi and Kok. (2020) suggested that the models
underestimate the mass of the coarse (with radius r > 2.5 um) dust mode in the atmosphere
almost four times, because of too fast removal processes. The argument is not entirely valid for
the dust source regions like the Middle East where deposition, which Adebiyi and Kok. (2020)
blame for too-quick removal of coarse dust from the atmosphere, does not have enough time to
do this. Adebiyi and Kok. (2020) also analyzed dust size distribution in the near-surface layer
where in-situ measurements are available.

Here we compare the column integrated dust volume size distribution from the model with the
column integrated aerosol volume size distribution from AERONET and find that WRF-Chem
underestimates the volume of fine particles with 0.1 um < r < 1 um and overestimate the
volume of particles with 1 um < r < 2 um. We have to increase emissions in the first bin and
decrease emissions in the second bin to correct this deficiency. The text is expanded to clarify
this issue (Sec. 5.2.1).
Strictly speaking, our new sp settings (see the modified text in Sec. 5.2.1, last sentence of the 2nd paragraph) are in line with (Adebiyi and Kok., 2020), as in comparison with the default sp set we decreased the dust mass influx fraction into two finest bins 1 and 2 (0.1 um < r < 1.8 um) from 0.3175 to 0.25 (see explanation to the reviewer’s comment to Page 14, line 331, below), slightly increase the mass flux fraction from 0.2275 to 0.25 for the intermediate bin 3 (1.8 um < r < 3 um), and increased dust mass flux fraction into two coarsest bins 4 and 5 (3 um < r < 10 um) from 0.455 to 0.5. We have added the new Appendix 3 to the paper to explain these points. Page 14, line 330: How do you know that the total emitted dust mass is overestimated, since there is absolutely no measurements of dust emission? We here do not mean to compare the simulated dust emissions with the absolute value of real dust emissions that are not measured. The measured physical quantity is AOD that in the model is controlled by emissions. If the model overestimates AOD, this is associated with overestimating dust emission (assuming we do not touch the dust removal processes). If the model excessively emits large particles, it generates higher dust mass flux than if it would generate emitting more fine particles, because finer particles produce a larger AOD per unit mass. We changed the wording to clarify this issue. (Sec. 5.2.1, 2nd paragraph) Page 14, line 331, adjusted sp fraction: The first size bin represents clay and the rest four bins represents silt. The 0.1, 0.25, 0.25, 0.25, 0.25 fractions is based on the assumption that 10% of clay will be emitted but 100% of silt is subject to be emitted to the atmosphere based on the early work in the 1990s from Tegan. Even though these numbers are arbitrary, but the sum of adjusted silt fractions (0.15, 0.17, 0.38, 0.1) is only 0.8. Please explain why you do not account for the rest of 0.2 fraction in the silt group. The GOCART dust emission formula (2) calculates dust mass flux into the atmosphere within five dust bins. In this formula the factor C controls the total mass flux, and the sp coefficients split the total mass flux into five different size fractions. Following this logic, we have to assume that the sum of sp equals 1 as we stated in the text. In the revised paper, we reiterated the sensitivity of the results to the choice of sp and slightly readjusted the sp values. Now we use the set of sp =(0.15; 0.1; 0.25; 0.4; 0.1). It means that 15% of the total dust mass flux is coming as clay and 85% as silt. In the original formulation the sum of sp equals to 1.1. It is not crucially important, as the total flux is multiplied by the factor C that is tuned to fit the observed optical depth. So we can normalize the original sp coefficients by dividing them to 1.1 and multiplying constant C to 1.1. It will not change any results in (2) but gives the sp set of (0.09, 0.2275, 0.2275, 0.2275, 0.2275) that is normalized to 1 consistently with our approach. We have added the new Appendix 3 to the paper to discuss these points. Page 16-18, Section 5.2.2: As I mentioned at the beginning, the comparison with AERONET AOD is not an independent evaluation of WRF-Chem and MERRA-2, because the WRF-Chem is “tuned” to match AERONET AOD and MERRA-2 assimilates AERONET AOD. It is not exactly correct, at least for the model. The model is tuned to match the average value of AOD at AERONET sites using a spatially uniform time-independent factor C, which controls total dust emission. So we tuned the time-averaged AOD bias concerning available AERONET observations, not the correlation coefficient. Therefore, the high correlation of (0.62-0.85) between simulated and AERONET AOD is an independent proof of the model performance. To clarify this issue, we have expanded the text (Sec. 5.2.2, last paragraph).
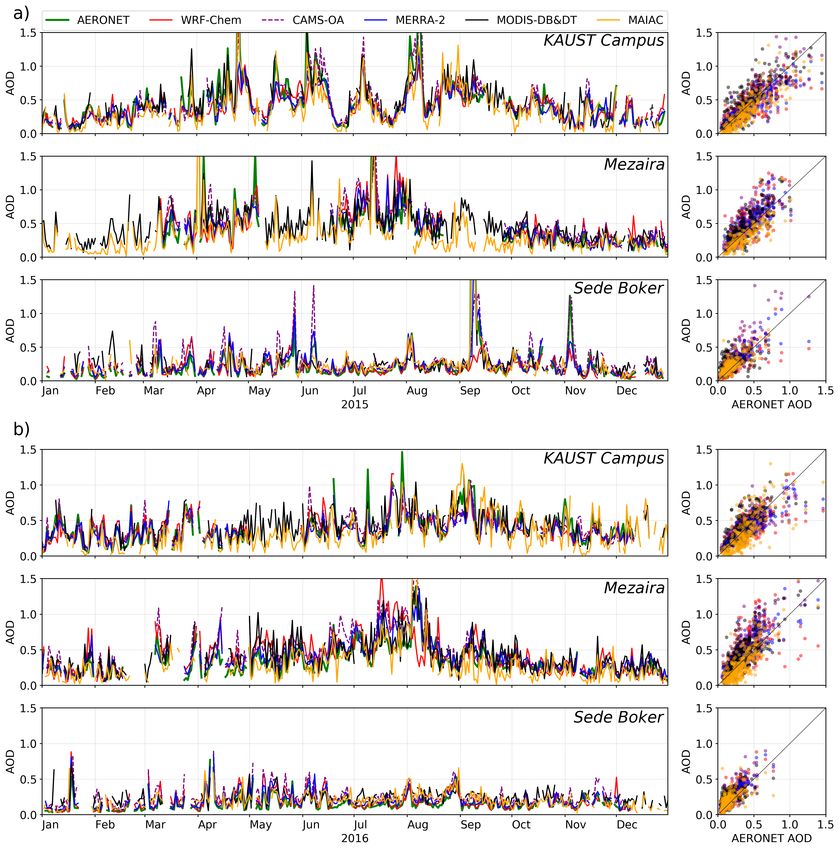
Page 17, Figure 6: There are several very large spikes of AOD from the WRF-Chem
simulations in Mesaira and Sede Boker in 2016. What causes these spikes?
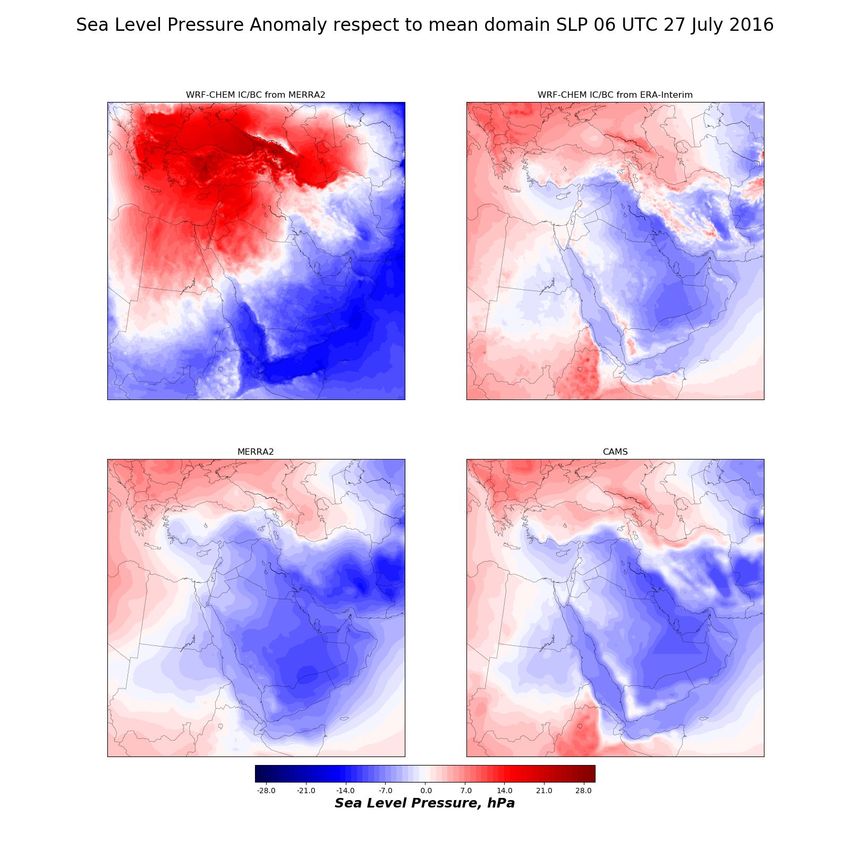
Thanks for catching these spurious AOD spikes. We have analyzed the meteorological fields
from our run for July 2016. We found that on the 27th of July 2016, a high-pressure system in
the Eastern Mediterranean moving south-eastward formed high-pressure gradients reaching 3
hPa/100km. This system forced a strong gradient wind with speed exceeding 15 m/s and
associated dust generation. MERRA-2 and CAMS, as well as synoptic charts based on in-situ
observations, suggest that WRF-chem overestimates the sea level pressure gradient (see
Figure A below). The preliminary analysis indicates that the boundary conditions calculated
using MERRA-2 fields generated the spurious meteorological system. We re-calculated the
entire July of 2016 with the boundary conditions from ERA-Interim reanalysis (see Figure A, top
right panel). In the new run, the sea level pressure looks similar to observations, and spurious
AOD spikes disappeared (see Figure B). We have incorporated the new July-2016 results in
our analysis and corrected the figures and tables in the paper accordingly.
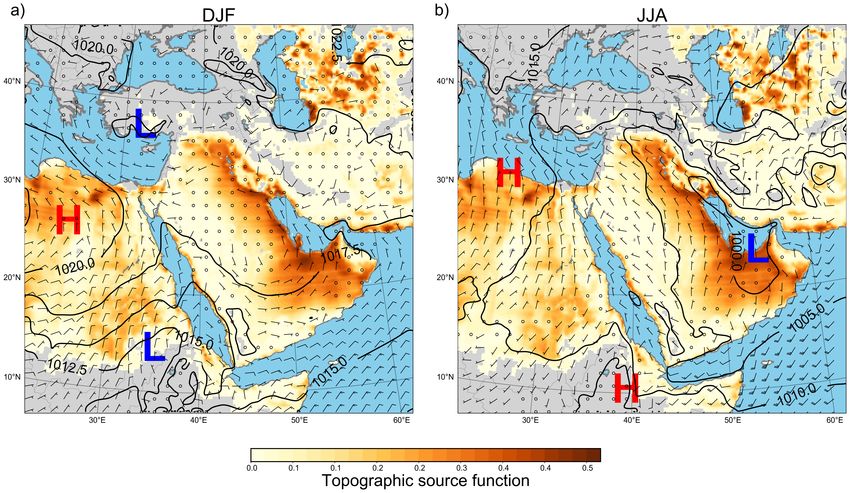
Figure A. Sea Level Pressure
anomaly from MERRA-2,
CAMS-OA, and two
WRF-CHEM runs with
MERRA-2 and ERA-Interim
boundary conditions.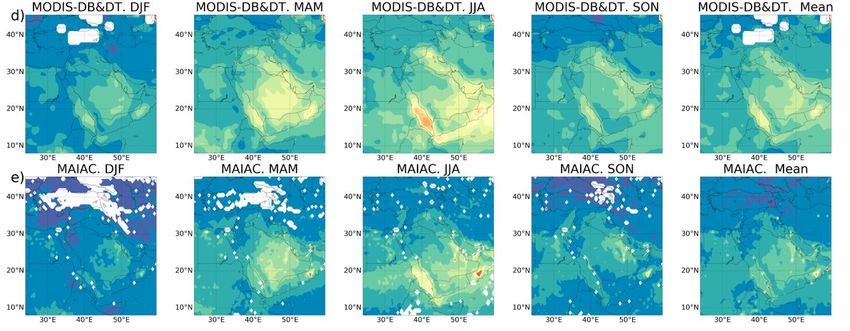
Figure B. Simulated
and Observed
AERONET AODs at
the KAUST site for
July 2016.
Page 19, Figure 7: How are the models sampled when compared to satellite data? Are they
temporally matched (i.e., model results are concurrent with the satellite data, or model results
are averaged for the clear sky only during the season)?
In the revised paper, we sampled WRF-Chem, MERRA-2, CAMS-OA during a day-light time (6
am-2 pm UTC or 9 am-5 pm local time) (Sec. 5.2.2, 1st paragraph). The results are not visibly
different from our previous estimates when we applied 24-hour sampling.
Page 20, line 388-389: “. . .in good agreement with. . .”: What is your criteria for “good
agreement”? In general, such subjective statement should be avoided. Instead, you could say
something more quantitative, such as “with xx%” or “correlation coefficient within xx-yy”.
We agree and have corrected the sentence to account for the reviewer’s comment. Now it
reads, as “Based on the comparison of WRF-Chem AOD with the AOD from MODIS and
AERONET observations, we conclude that spatial and temporal WRF-Chem’s AOD distribution
is in good agreement with the available satellite and ground-based observations, i.e. annual
mean correlation coefficient R exceeds 0.6 (see Tab. 5) and correlation with AERONET is
0.43-0.85 (see Tab. 4).” (Sec. 5.2.3, last sentence).
Page 20, line 406: “. . .good agreement. . .” again! See my comments above.
This sentence was corrected. See the previous comment.
Page 21, line 420: sulfate ion: So for PM2.5 you only consider the mass of sulfate ion, not
neutralized sulfate that exists in the atmosphere, such as ammonium sulfate? The mass of
ammonium sulfate is 37% more than just sulfate ion.
We understand that ammonium sulfate has a bigger mass than sulfate ion. But in our region of
interest, there is little ammonia to neutralize a significant amount of sulfate. Therefore, we
assume that most of the ME anthropogenic aerosol is sulfate.
We repeat here our response to the major concern:
To support this conclusion, we have conducted laboratory analysis of the chemical composition
of soil and dust deposition samples that show a little presence of organics and ammonium
(Prakash et al. 2016; Engelbrecht et al., 2017). According to (Engelbrecht et al., 2017) in 2015
the annual average weight percentages of soluble ions of ammonium (NH4) and sulfate (SO4)
in deposition samples taken at four sites at the KAUST campus are 0.05% and 2.513%,
respectively. It means that available ammonium may neutralize at maximum 5% of sulfate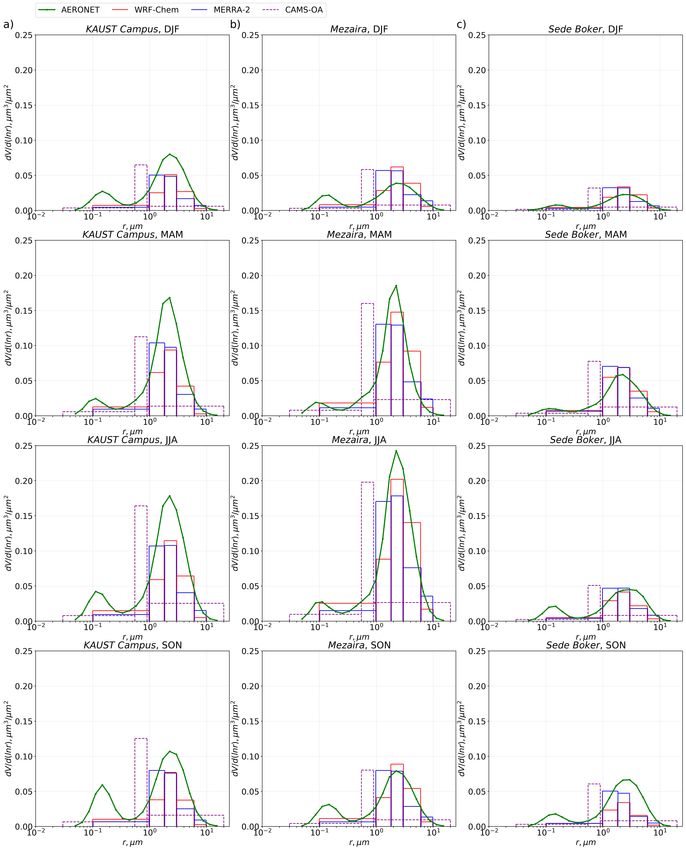
mass. The actual contribution of ammonium sulfate should be lower, as some ammonium may
also be bound as ammonium nitrate, ammonium phosphate, or ammonium chloride.
Page 21, line 422: again, what is the reason that “the first sea salt bin is poorly populated”?
This is related to sea salt size distribution. The sea salt is a relatively coarse aerosol with very
poor fine fraction therefore the fine model bin is poorly populated. We have modified the
analysis and accounted for the contribution of the first sea salt bin in PM for MERRA-2 in the
revised paper. The results did not visibly change.
Page 21, line 426-429, PM calculations: It should be noted that all models do not include nitrate
and ammonium when calculating the PM mass. Associated error/uncertainty should be
estimated.
Yes, for consistency, we show the contribution of only SO4 for all models.
Page 24, 3rd line from the bottom: “As we have shown, WRF-Chem provides reliable
estimates. . .”: What is the criteria for "reliable"? From Fig. 8, WRF-Chem underestimates
PM2.5 at Jeddah and Riyadh by a factor of 2 and overestimates PM2.5 at Dammam. Its
performance for total PM2.5 is inferior to CAMS. In addition, its chemical composition of PM
have not been evaluated at all.
In this study, we evaluate the performance of the WRF-Chem and the best available
assimilation products over the Arabian Peninsula using observed PM concentrations. This
region has a poorer observation coverage in comparison with Europe or the US. Therefore
model estimates are valuable to plan further analysis and mitigation measures.
The situation in the Middle East is simplified by the dominance of dust in the PM. WRF-Chem
does a good job in comparison with MODIS and AERONET AOD observations, as well as
predicts well the distribution of SO2, which is the only sulfate precursor, see (Ukhov et al.,
2020).
The calculations of surface aerosol concentration within a city is challenging for the 10x10-km2
resolution model in comparison with the point observations. E.g., we do not account for in-city
dust generation, although there could be a significant amount of resuspended dust. So the
larger discrepancies in PM concentrations within the city are expected.
Page 27, Figure 10: The labels and legends on this figure are way too small to be legible.
Fixed
Page 28, line 516-517: Is this a “drift of sulfate”? What is the emission patter of SO2?
As it is stated in the paper, Figure 10f shows SO4 concentration. The OMI-HTAP SO2 combined
emissions are presented in (Ukhov et al., 2020).
Page 28, line 517-521: I don’t understand what the relevancy is to refer the sulfate
concentration over the US.
We added this sentence for comparison of sulfate concentrations over the US and the ME.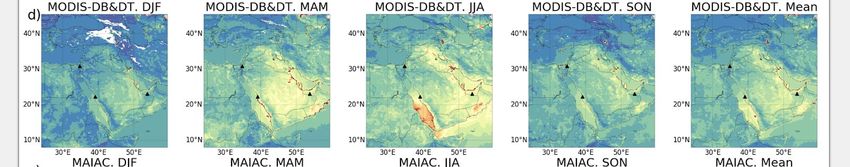
Page 28, line 523, MERRA-2 underestimates the SO2 emission: Do you know if indeed sulfate is too low or SO2 emission is too low in MERRA-2? Several issues here to challenge such statement. First, sulfate mass in MERRA-2 is not necessarily corresponding to SO2 emission because the aerosol masses (including sulfate) are adjusted after the AOD simulation, which has nothing to do with SO2 emission. Second, van Donkelaar’s work “retrieved” PM2.5 based on the satellite AOD and the GEOS-Chem model such that the sulfate (and other aerosols) concentration is adjusted based on the adjustment of model AOD to satellite total AOD. As a result, the sulfate from van Donkelaar’s work is not necessarily representative of the “true” sulfate concentrations. We clarified the text and added a reference on our recently published paper (Ukhov et. al., 2020), where we compare different SO2 emission dataset including EDGAR-4.2 used in MERRA-2. Ukhov et. al. (2020) shown that EDGAR-4.2 underestimates SO2 emissions over the Arabian Peninsula in comparison with the new OMI-HTAP SO2 emission dataset. Page 28, line 538-539: Again, I don’t understand what the relevancy of the US-EPA standard being applied here. The Saudi Arabia’s standard should be used. And in line 539, now you use the WHO guidelines as reference. This is confusing. We can not avoid the comparison of air quality in the Middle East with air quality in the US and Europe. For this purpose, we specifically discussed all PM air quality limits in Table 1, and apply them when appropriate. We specifically discuss WHO guidelines, European, US, and Saudi Arabian air pollution limits to comprehensively evaluate PM pollution in the ME, and quantify its sources. Page 30, line 554 and 556-557: I would not emphasize “for the first time” to elevate the significance of the paper. Simply state what you’ve done and found is more appropriate. We agree, the wording “for the first time” is removed from the text. Page 30, line 564: “The air pollution in the major Middle Eastern cities is evaluated” sounds overstatement. The evaluation is rather limited to only three cities and only with PM2.5 and PM10, not all major cities and not all pollutants. This sentence is replaced by “We evaluated the AOD and PM air pollution over the Arabian Peninsula and in the ME major cities.” (Sec. 6, 4th sentence) Page 30, line 576: “ improve calculation of sulfate aerosol”: there is no approve that sulfate simulation is improved because there is no data to evaluate it. The reviewer technically is correct. Strictly speaking, we did calculations with the improved SO2 emissions (see Ukhov et al., 2020) that affected sulfate concentrations. The text is revised to clarify this point. Page 31, line 582-583: CAMS-OA deficiency has been corrected: Then why don’t you use the latest version that is available in 2019? What is the point to evaluate the results from an obsolete model version? The paper evaluates the operational CAMS product. So for any given time, only the forecast and analyses of the current operational version is available. Further, rerunning the CAMS system (with data assimilation at the full resolution) is quite expensive. So it can not be easily redone. The re-analysis has a frozen model version for the whole period. So we always
evaluate the best product at the time. E.g., CAMS-OA had an important upgrade of the horizontal resolution of the operational system from T255 (80km) to T511 (40 km) on 21.6.2016. The CAMS-OA product is still in use and is distributed by ECMWF, so an independent evaluation of the existing product is useful. The evaluation period of 2015-2016 does not cover the time when the latest changes in CAMS-OA were introduced, so the evaluation of the newest version can not be done in the current study. Page 31, line 589: “quite well” – again! Please avoid using such subjective statement. We agree. The text is corrected. References used in the response: Adebiyi AA, Kok JF. Climate models miss most of the coarse dust in the atmosphere. Science Advances. 2020 Apr 1;6(15):eaaz9507. Engelbrecht J, Stenchikov GL, Prakash PJ, Lersch T, Anisimov A, Shevchenko I. Physical and chemical properties of deposited airborne particulates over the Arabian Red Sea coastal plain. Kok, J. F. (2011). A scaling theory for the size distribution of emitted dust aerosols suggests climate models underestimate the size of the global dust cycle. Proceedings of the National Academy of Sciences, 108(3), 1016-1021. Martin, R. L., & Kok, J. F. (2017). Wind-invariant saltation heights imply linear scaling of aeolian saltation flux with shear stress. Science advances, 3( 6), e1602569. Osipov S, Stenchikov GL, Brindley H, Banks J. Diurnal cycle of the dust instantaneous direct radiative forcing over the Arabian Peninsula. Prakash PJ, Stenchikov GL, Tao W, Yapici T, Warsama BH, Engelbrecht J. Arabian Red Sea coastal soils as potential mineral dust sources. Randles CA, Da Silva AM, Buchard V, Colarco PR, Darmenov A, Govindaraju R, Smirnov A, Holben B, Ferrare R, Hair J, Shinozuka Y. The MERRA-2 aerosol reanalysis, 1980 onward. Part I: System description and data assimilation evaluation. Journal of Climate. 2017 Sep;30(17):6823-50. Stockwell WR, Kirchner F, Kuhn M, Seefeld S. A new mechanism for regional atmospheric chemistry modeling. Journal of Geophysical Research: Atmospheres. 1997 Nov 27;102(D22):25847-79. Ukhov A, Mostamandi S, Krotkov N, Flemming J, da Silva A, Li C, Fioletov V, McLinden C, Anisimov A, Alshehri Y, Stenchikov G. Study of SO2 pollution in the Middle East using MERRA-2, CAMS data assimilation products, and high-resolution WRF-Chem simulations. Journal of Geophysical Research: Atmospheres. 2020 Mar 6:e2019JD031993.
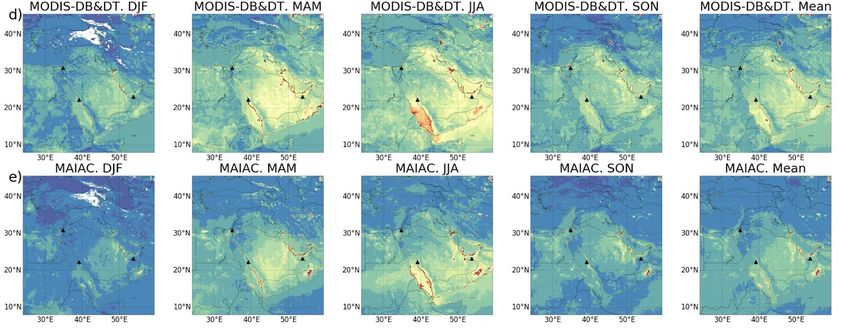
Responses to Reviewer 2 General comments The manuscript by Ukhov et. al., presents a detailed comparison of WRF-Chem, MERRA-2 and CAMS aerosol data with respect to the two MODIS data products, AERONET and ground-based network of PM measurements. The paper is well written and extensive sets of data are considered for comparison which represents aerosol optical depth, PM10, PM2.5 and their spatial and temporal patterns. In addition to the comparison, the composition of aerosol among dust, sulfate, sea salt and other constituents have been discussed. The impact on aerosol air pollution has also been investigated. This study could have been completed by also including some comparison for vertical profiles of aerosol extinction or various components of aerosol (e.g. dust, sulfate), with the measurements (if available) or at least among the model and assimilated products. I have a few major and several minor concerns with the manuscript, which upon being addressed, I recommend publication in ACP. We thank the reviewer for the valuable comments. We agree that comparing vertical aerosol distribution in the models and in observation is very useful. But it is not a small side issue. To address it, we have established a micropulse lidar (MPL) site at the KAUST campus and observed the aerosol vertical profile since 2014. There is no way currently to separate in observations the vertical profile of dust from that of sulfate and other aerosols. We are not sure we have enough space in this paper to address the important issue of the aerosol vertical profile properly; therefore, we refrain from doing this here. This work is mostly the subject of another paper submitted to ACP recently. All references used to support our responses to the reviewer's comments are presented at the end of the text. The reviewer's questions are in black. Our answers are in blue. Major issues: 1. The manuscript primarily focuses on the various aerosol product and WRF- Chem code has been modified to calculate these parameters. In section 4.2, authors mention that the code modification will be published in a forthcoming publication. Since the data produced for use in this publication is simulated with modified model code, yet not peer-reviewed, I can only recommend publication after the technical publication. The model modifications have been reviewed, tested, and implemented in the v4.1.3 official version of the WRF-Chem code (released on Nov 25, 2019). The forthcoming paper in GMD is about the quantitative evaluation of the effects of those changes on simulations. The GMD paper is independent of the current study, and, we believe, should not delay the publication of the present manuscript. 2. For sections 2.2, 5.2.2 and 5.2.3 authors use the MODIS combined deep blue (DB) and dark target (DT) product. It a level 3 gridded product at a much coarse spatial resolution of 1◦ × 1◦. DB has poorer performance over water, while DT has limitation over land. In my opinion, authors should use separate DB and DT, level 2 gridded products, which are available at much finer (10km × 10km) resolution (comparable to WRF-Chem and MAIAC). Moreover, level 2 product also allows the possibility of applying a quality assurance criterion, which has shown improvement in the comparison previously (for e.g. Liu, N., et al. (2019)). Following the reviewer's recommendation, we calculated the 10x10 km2 MODIS DB&DT level 2 AOD product. The AOD fields with 10x10 km2 and 100x100 km2 resolution are shown below. We see that qualitatively the AOD structure is similar at both resolutions, but 10x10 km2 fields have much more fine details. In the revised manuscript, we now use the 10x10 km2 resolution MODIS DB&DT product, and all tables in the revised paper are corrected accordingly.
Figure A. 10 x 10 km2 MODIS AOD Figure B. 100 x 100 km2 MODIS AOD 2. For comparison with MODIS data products, the model data should be sampled around satellite overpass or at most averaged ± 1h around satellite overpass. Further, in order to avoid sampling bias, only those days should be considered for calculating seasonal means when both measurements (AERONET/Satellite) and model (or assimilation) data are available. Because we analyze the seasonal mean AOD fields over the entire ME, we have to use multiple overpasses to compile a map for the whole domain. Therefore AOD's from WRF-Chem, MERRA-2, CAMS-OA are sampled at the day-light time (6 am-2 pm UTC or 9 am-5 pm local time). We added this explanation in the text (Sec. 5.2.3, 1st paragraph). There is no missing data in the model and the reanalysis outputs, and only a little in the MODIS products, therefore all available observations and model outputs were used for calculating seasonal means. The undefined pixels detected in observations are synchronously excluded from the statistical analysis in all datasets. 4. The introduction is very long in general and can be curtailed by only keeping the content most important to the study. Some (not all) suggestions: - Lines 55-60- MISR, AVHRR and CALIOPE are not relevant to this study. Some restructuring is also needed. For example, the description of the work to be presented in the text fits better towards the end of the introduction. In line 75, authors mention about evaluation to be presented in the subsequent section but this is followed by further literature review. Line 93 again starts with the highlight of work to be presented in this work. We revised the text to remove the redundancies 5. The conclusion needs to be curtailed. Redundancy in the conclusion can be reduced. Some examples (not all): Lines 558-559 and lines 571-543; Lines 560- 561 and 574-575. Numbers should be provided in conclusion rather than only qualitatively stating “overestimate” / “contribute” etc. We revised the conclusion and made it more concise.
Detailed Comments: 1. Abstract: Please use abbreviations only after providing their full form at the first use (e.g. ME). Abstract does not do justice to the manuscript. Some more key finding should be added. Added full form for ME (Middle East). More key findings were added. 2. Line 6: WRF-CHEM code was modified but this is not described in detail in this manuscript. Authors wish to publish it as separate manuscript and hence this does not fit to abstract. We agree and have removed this sentence from the abstract. 3. Line 15: rich – reach Fixed 4. Lines 15-16: Contribution of both organic matter and black carbon are negligible. Is is important to mention this comparison? The PM speciation is vital to plan air quality mitigation measures. There are few observations available, so model results that provide spatially resolved information are valuable for understanding the effect of different types of aerosols on air quality in the ME. 5. Line 35: Essential – Important/crucial Fixed 6. Line 46: PM10 and PM2.5 are defined with respect to “aerodynamic diameter”. Yes 7. Lines 61-63: Is it justified to compare the 21 days’ mean with air quality regulation standards for 1 year. Please note that some of the measured mean PM10 concentrations are smaller than 24 hours’ limit. Due to the modification of the introduction, this part was removed from the text. 8. Lines 79-85 : What are the conclusions of these comparisons? The text was rephrased to: “These data assimilation products adequately reproduce AOD and PM concentrations at different regions of the world (Provençal et al., 2017; Buchard et al., 2017; Cesnulyte et al., 2014; Cuevas et al., 2014).” 9. Lines 89-92: Given that mineral dust contributes 75-95% of the PM, how much discrepancy is caused by outdated emission inventories in MERRA-2 and CAMS-OA? The anthropogenic emissions certainly make an essential contribution in the air pollution in the cities and this information is important for air quality control in urban centers. To clarify this issue we have added the following sentence (p.4 line 85): “E.g.,SO2 emissions used in MERRA-2 and CAMS-OA differ by 45-50% in some ME regions (Ukhov et al., 2020)”. In the 2nd paragraph of the Sec. 4.1 we also mentioned that 14 previously unaccounted SO2 point sources located in the ME were included in the new OMI-HTAP dataset. 10. Line 113: What are CIMEL and PREDE?
To clarify the text the sentence is updated to read “AERONET comprises more than 1000 observation sites equipped with CIMEL sunphotometers and PREDE skyradiometers manufactured in France by CIMEL and in Japan by PREDE.” 11. Lines 118-120: Authors should also provide a statistical comparison for the case when only cloud screened and quality-assured data are used in the results and discussion. In our analysis now we use “Utilizes AERONET AOD, which is pre- and post-field calibration applied, automatically cloud cleared and manually inspected (Level 2.0 AOD).” The text (Sec 2.1, 1st paragraph) is clarified to read: “We utilized level 2.0 (cloud screened and quality assured) AERONET AOD data.” 12. Line 119, 122: Angstrom – Ångström Fixed 13. Line 139: MAIAC also provides AOD at 470nm. Added 14. Section 2.2: Please mention the Quality assurance filter criteria if applied! We did not use a quality assurance filter. 15. Line 153? quarterly refers to what? “Quarterly” refers to the calibration audit. Sentence has been rephrased to read (Sec 2.3. Last sentence) “...audit is conducted quarterly by Ricardo-AEA Ltd...” . 16. Line 164 (DMS) Fixed 17. Line 173: This line is not clear to me. CAMS-OA is the operational analysis, not reanalysis. The model, its horizontal resolution, and assimilation routine are improving on the way, so we always use the best available product. E.g., the important upgrade of the horizontal resolution of the operational system from T255 (80km) to T511 (40 km) was accomplished on 21.6.2016. 18. Line 179 and later in the text: dustbins – dust-bins. Fixed 19. Line 2019: OH is hydroxyl radical and not “Hydroxide radical”. Fixed 20. Line 219: I had difficulties understating the treatment of PM, BC and OC emissions. Black carbon, organic carbon and dust, these are already included in PM. So if the emission of both PM and its constituents are specified separately, this would end up in doubling of certain constituents of PM. Reviewer meant line 229 not 219. We agree that it sounds confusing, because we followed the emission categories used in the WRF-Chem. It meant that the “PM” emissions comprise the additional aerosol biogenic and fossil components. Now the text reads as (Sec 4.1, 2nd paragraph): “All other constituents (other PM from biogenic and fossil components, black and organic carbon, etc.), ...”
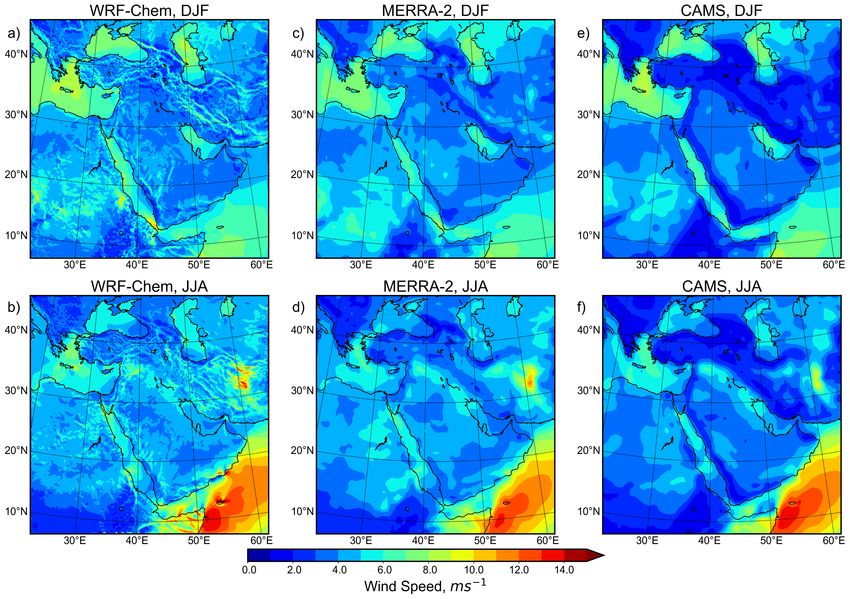
21. Equation 3: Use of S in both LHS and RHS are confusing. I would suggest using Smod or S’ or something different. We agree, this is confusing. We defined S’ as a modified topographic source function. 22. Lines 250-253: How is the value of C=0.5 achieved? The tuning of C with respect to measured AOD should be discussed in more detail. WRF-Chem is tuned to reduce the seasonal mean AOD biases with respect to AERONET observations. The value of C=0.5 obtained in the course of multiple WRF-Chem runs with different values of C gives the best AOD fit. Three references with detailed description of the tuning procedure were provided in the original text (page 10 line 248): (Kalenderski et al., 2013; Jish Prakash et al., 2015; Anisimov et al., 2017). 23. Section 4.2: How are the diagnostic output of PM are different from those calculated in section 5.3? As we mention in the original text, if we would use the default WRF-Chem v3.7.1 code we would overestimate the PM10 and underestimate the PM2.5 surface concentrations. For typical Middle East conditions, diagnostic output of PM2.5 surface concentration could be underestimated by 7% and PM10 surface concentrations could be overestimated by 5%. (See Sec. 4.2) 24. Section 5.1 Lines 271-275 fit better for methods/domain description. Sorry, we prefer to concentrate on the ME climate description in section 5.1. 25. Figure 2: What is the physical significance of the topographic source function? Do the high values represent higher dust emission potential? The topographic source function defines a spatial pattern of emission. The factor C - controls the total amount of emissions. The topographic source function has been built under an assumption that low-land areas accumulate fine-scale material (Ginoux et al., 2001). The areas with the higher values of source function generate higher dust emission flux, see eq. (2). 26. Line 283: Missing “)”. Fixed 27. Lines 305-309: Higher R and lower RMSD for V are not specific only for summers. We agree. The text has been corrected accordingly. 28. Table 3: How are the statistics for Autumn and Spring The dry subtropics have essentially two seasons, warm Winter, and very warm Summer. The intermediate seasons are not so essential. We prefer not to spend much time on their discussion. 29. Table 3,4 and 5: Slope/Bias should also be provided in addition to the R and RMSD. These quantities provide an idea about overestimation/underestimation/trend. Table 4 shows bias for the AOD time series. We added the scatter plots for the AOD time series in Fig. 6. The bias has been added for the spatial distributions of AOD in Table 5. Figure 3 shows that the seasonal mean wind field in WRF-Chem and both reanalyses do not have systematic differences. We believe it is not needed to add bias for the wind in Table 3. 30. Line 315: Aerosol content is also characterized by other quantities apart from AOD.
We talk here about the satellite observed quantities. Of course, one needs aerosol size distribution or
mass extinction coefficient to convert AOD to mass loading.
31. Lines 327-330: It would be nice to see the underestimation/overestimation with default sp fraction and
its magnitude as a figure (at least in appendix).
In the revised paper, we reiterated the sensitivity of the dust size distribution to the choice of sp and
slightly readjusted the sp values. Now we use the set of sp=(0.15; 0.1; 0.25; 0.4; 0.1). Below we compare
the size distributions obtained in the simulations with this updated and the default sp=(0.1;
0.25;
0.25;0.25;0.25) values for summer of 2015. Using the updated sp values improves the size distribution fit
(see Figure below). We have added the new Appendix 3 to the paper to discuss these points.
Figure C. Volume size distribution at KAUST AERONET site averaged for JJA of 2015 from WRF-Chem simulation
with default sp={0.1,0.25,0.25,0.25,0.25} fractions (bottom) and updated sp={0.15; 0.1; 0.25; 0.4; 0.1} (top).
32. Line 345: This line should only be kept if the evaluation of updated CAMS-OA is shown in the
manuscript.
Figure 4 compares the volume size distributions from WRF-Chem, MERRA-2, and CAMS-OA with the
AERONET retrievals. The paper evaluates the operational CAMS product, CAMS-OA. So, for any given
time, only the forecast and analyses of the current operational version are available. Further, rerunning
the CAMS system (with data assimilation at the full resolution) is quite expensive. So it can not be easily
redone. The product is still in use and is distributed by ECMWF, so an independent evaluation of the
existing product is useful. The evaluation period of 2015-2016 does not cover the time when the latest
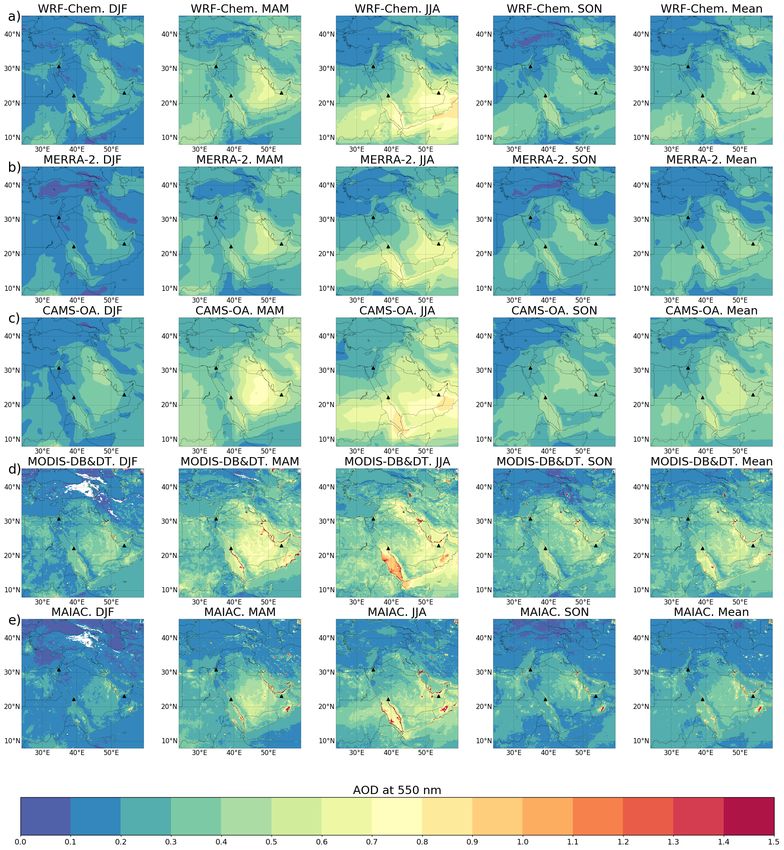
changes in CAMS-OA were introduced, so the comparison can not be made in the current study.33. Figure 6: Please mention that panel A corresponds to 2015 and B correspond to 2016. The caption has been changed to address this issue. 34. Line 366: At a given location, up to 4 measurements are possible on several days due to overlap of two orbits each for TERRA and AQUA. Thanks. The text is corrected. 35. Section 5.2: I was surprised to see that MAIAC underestimates AOD with respect to AERONET. The evaluation of MAIAC by Lyapustin et. al., shows overestimation at all the three AERONET sites shows in this study. Authors should address, why even for a similar dataset, an underestimation is observed in this study by MAIAC. Authors could also refer to the finding of Liu et. al., 2019, where they have found that applying a QA filter significantly reduces the Deep blue (over land) AOD from MODIS over China. There are other evaluation studies (e.g. Liu et al., 2019, Mhawish et. al., 2019), which have found MAIAC to be more accurate than Deep blue and Dark Target. Authors should address, why for their domain this is not the case. According to (A. Lyapustin personal communication, April 2020), MAIAC underestimates AERONET in the ME (at KAUST_Campus and Mezaira sites). So, our results are consistent with this. We do not apply a QA filter in our calculations. 36. Figure 7, I wonder how there are NAN values at around 40 ◦N 40 ◦E in MODIS DB&DT products in the annual mean but there are no NAN values in MAIAC annual mean. If the seasonal NAN values are removed by annual mean, this should hold valid for both the MODIS data products. I would recommend the authors to recheck the calculation of spatial means. Please also indicate the location of three AERONET site in Figure 7. This would help the reader to follow the discussion. There are some undefined pixels in the MAIAC product that we referred to as NANs. This confusing terminology has been corrected in the revision. In Figure 7 in the original manuscript, we interpolated MODIS and MAIAC AODs to the MERRA-2 grid. That caused some discrepancies, e.g., led to an artificial increase in undefined areas. Now model outputs and satellite products are plotted in its original resolution (see Figure 7 in the manuscript and figure below). We have recalculated all statistical characteristics in Table 4 using MAIAC on its original grid. Table 4 shows that MAIAC now compares better with AERONET than MODIS DB&DT in terms of bias and correlation coefficient. Locations of 3 AERONET sites are now shown on the plots, as requested by the reviewer. We also fixed an error in the calculation of spatial means.
Figure D. MODIS 100x100km2 and MAIAC (interpolated on MERRA-2 grid) and error in calculation of seasonal means. Figure E. MODIS 10x10km2 and MAIAC (on its original resolution). Fixed error in calculation of seasonal means. 37. Section 5.3: Please provide references from where the formulas for calculation of PM2.5 and PM10 are adapted. What is the rationale behind the choice of the coefficients used in equation 4 and 5? These formulas are taken from the WRF-Chem source code and Copernicus knowledge base (https://confluence.ecmwf.int/display/CUSF/PM10+and+PM25+global+products). The coefficients in those formulas account for the contributions of dust and sea salt bins to PM2.5 and PM10. Dust and sea salt have different bin sizes in WRF-Chem and CAMS-OA; therefore, those coefficients are different for WF-Chem and CAMS-OA. Both WRF-Chem and MERRA-2 use the GOCART aerosol module with the same bin sizes; therefore, the coefficients for WRF-Chem and MERRA-2 are the same. 38. Sections 5.3, 5.3.3, 5.3.4 and 5.4: Air Quality and Air pollution are very broad terms which also include trace gases in addition to the aerosol. Hence, the subtitles of these sections should be made more specific. The reviewer is generally correct and we changed the titles 5.3, 5.3.3, 5.3.4 (there is now 5.4) to “PM Air Pollution”, “Spatial patterns of PM air-pollution” , “PM air-pollution in the ME major cities”, correspondingly.
We have to mention here that according to the US EPA the air quality index is defined by the leading
pollutant, which in the ME, almost exclusively is PM2.5.

39. Line 443: How does the calculated concentration of 298 μg/m3 compare against the measurements?

It is not possible to compare because there are no observations of total dust concentration, only PM2.5
and PM10 are available from MODON observations. Daily average PM10 surface concentration on 8 July
2016 registered by Jeddah AQMS is 184 μg/m3.

40. Figure 8 and 9: Please provide the uncertainty marks in the histogram which represent the variability
over the mean.

Uncertainty marks are shown now in both figures. PM2.5 and PM10 measurement error is +/- 5%. This
information was added to the text (Sec. 2.3).

41. Lines 496-503 Authors evaluate the PM2.5/PM10 ratio to evaluate the dominance of coarse/fine
particles. A more quantitative evaluation would be PM10-PM2.5, which provides a more exclusive
number for larger particles.

Both PM10-PM2.5 and PM2.5/PM10 are informative. The PM2.5/PM10 ratio is widely accepted in air
pollution literature, e.g., see Gehrig et al., 2003; Parkhurst et al., 1999; Querol et al., 2001. Therefore we
prefer to use this ratio in this study.

42. What are the major non-sulfate constituents in total PM2.5 non-dust aerosol?

In coastal areas it is sea salt and organic matter, over inland only organic matter. BC has a very little
effect (see Table 6).

43. Lines 587-588: In addition to the AOD retrieval uncertainty, there are several other differences e.g.
Spatial resolution, Quality assurance filter which contribute the observed difference.

The discussion is expanded to add more detailed explanation.

44. Line 600: Please use the same convention for the naming of seasons. “Fall” season is nowhere
discussed in the text and appears for the first time in the conclusion.

Changed to autumn.

45. Line 609: Air quality should be replaced with PM air quality.

According to the US EPA the air quality is evaluated based on the concentration of the most significant
leading pollutant, which are PM2.5 and PM10 in the Middle East, so PM air quality and air quality terms
are almost equivalent in the ME.

References:

[1]. Liu, N., et al. (2019), Evaluation and comparison of multiangle implementation of the atmospheric
correction algorithm, Dark Target, and Deep Blue aerosol products over China, Atmos. Chem. Phys.,
19(12), 8243-8268, doi:10.5194/acp-19-8243-2019.

[2]. Mhawish, A., et al. (2019), Comparison and evaluation of MODIS Multiangle Implementation of
Atmospheric Correction (MAIAC) aerosol product over South Asia, Remote Sensing of Environment, 224,
12-28, doi:10.1016/j.rse.2019.01.033.
[3]. Lyapustin, A., et al. (2018), MODIS Collection 6 MAIAC algorithm, Atmos. Meas. Tech., 11(10),
5741-5765, doi:10.5194/amt-11-5741-2018.

References used in the response:

Anisimov A, Axisa D, Kucera PA, Mostamandi S, Stenchikov G. Observations and cloud-resolving
modeling of Haboob dust storms over the Arabian Peninsula. Journal of Geophysical Research:
Atmospheres. 2018 Nov 16;123(21):12-47.

Gehrig R, Buchmann B. Characterising seasonal variations and spatial distribution of ambient PM10 and
PM2. 5 concentrations based on long-term Swiss monitoring data. Atmospheric Environment. 2003 Jun
1;37(19):2571-80.

Ginoux P, Chin M, Tegen I, Prospero JM, Holben B, Dubovik O, Lin SJ. Sources and distributions of dust
aerosols simulated with the GOCART model. Journal of Geophysical Research: Atmospheres. 2001 Sep
16;106(D17):20255-73.

Kalenderski S, Stenchikov G, Zhao C. Modeling a typical winter-time dust event over the Arabian
Peninsula and the Red Sea. Atmospheric Chemistry & Physics Discussions. 2012 Oct 1;12(10).

Querol X, Alastuey A, Rodriguez S, Plana F, Ruiz CR, Cots N, Massagué G, Puig O. PM10 and PM2. 5
source apportionment in the Barcelona Metropolitan area, Catalonia, Spain. Atmospheric Environment.
2001 Dec 1;35(36):6407-19.

Prakash PJ, Stenchikov G, Kalenderski S, Osipov S, Bangalath H. The impact of dust storms on the
Arabian Peninsula and the Red Sea. Atmospheric Chemistry & Physics Discussions. 2014 Dec 2;14(13).

Parkhurst WJ, Tanner RL, Weatherford FP, Valente RJ, Meagher JF. Historic PM2. 5/PM10
concentrations in the southeastern United States—Potential implications of the revised particulate matter
standard. Journal of the Air & Waste Management Association. 1999 Sep 1;49(9):1060-7.

Ukhov A, Mostamandi S, Krotkov N, Flemming J, da Silva A, Li C, Fioletov V, McLinden C, Anisimov A,
Alshehri Y, Stenchikov G. Study of SO2 pollution in the Middle East using MERRA-2, CAMS data
assimilation products, and high-resolution WRF-Chem simulations. Journal of Geophysical Research:
Atmospheres. 2020 Mar 6:e2019JD031993.
Assessment of natural and anthropogenic aerosol air pollution in the
     Middle East using MERRA-2, CAMS data assimilation products,
     and high-resolution WRF-Chem model simulations
     Alexander Ukhov1 , Suleiman Mostamandi1 , Arlindo da Silva2 , Johannes Flemming3 , Yasser Alshehri1 ,
     Illia Shevchenko1 , and Georgiy Stenchikov1
     1
       King Abdullah University of Science and Technology, Thuwal, Saudi Arabia
     2
       NASA Goddard Space Flight Center, Greenbelt, MD, USA
     3
       European Centre for Medium-Range Weather Forecasts, Reading, UK
     Correspondence: Georgiy Stenchikov (georgiy.stenchikov@kaust.edu.sa)

     Abstract. Modern-Era Retrospective analysis for Research and Applications v.2 (MERRA-2), Copernicus Atmosphere Mon-
     itoring Service Operational Analysis (CAMS-OA)data assimilation products, and a high-resolution
                                                                                     :::::::::::::
                                                                                                     regional Weather Re-
     search and Forecasting model (10 resolution) coupled with Chemistry (WRF-Chem) were used to evaluate natural and an-
     thropogenic aerosol :::::::::
                         Particulate ::::::
                                     Matter :::::
                                             (PM) :air pollution in the ME ::::::
                                                                           Middle::::
                                                                                  East:::::
                                                                                       (ME): during 2015-2016. Satellite and
5    ground-based AODTwo Moderate Resolution Imaging Spectrometer (MODIS) retrievals: combined product Deep Blue and
                     :::::::::::::::::::::::::::::::::::::::::::::::::::::::::::::::::::::::::::::::::::::

     Deep Target (MODIS-DB&DT), Multi-Angle Implementation of Atmospheric Correction (MAIAC), and Aerosol Robotic
     :::::::::::::::::::::::::::::::::::::::::::::::::::::::::::::::::::::::::::::::::::::::::::::::::::::

     Network (AERONET) aerosol optical depth (AOD) observations, as well as in situ Particulate Matter (PM ) PM
     ::::::::::::::::::::::::::::::::::::::::::                                                              :::
                                                                                                                 measurements
     for 2016, were used for validation of the WRF-Chem output and both assimilation products.
                                        :::::::::::::::::::::::::::::::::::::::::::::

         MERRA-2  and CAMS-OA assimilate AOD observations. WRF-Chem code was modified to correct the calculation of dust
         :::::::::::::::::::::::::::::::::::::::::::::::

10   gravitational settling and aerosol optical properties. The is a free-running model, but dust emission in WRF-Chem is calibrated
                                                                ::::::::::::::::::::::

     to fit Aerosol Optical Depth (AOD ) :::::
                                         tuned ::
                                               to ::
                                                  fit:::::
                                                      AOD:and aerosol volume size distributions obtained from Aerosol Robotic
     Network (AERONET) observationsAERONET.
                                   :::::::::
                                             MERRA-2 was used to construct WRF-Chem initial and boundary conditions
     both for meteorology and chemical/aerosol species. SO2 SO2 emissions in WRF-Chem are based on the novel NASA SO2
     emission datasetthat reveals unaccounted sources over the ME. OMI-HTAP
                                                                   ::::::::::
                                                                             SO2 emission dataset.
                                                                                 ::::::::::::::

15       The correlation with the AERONET AOD is highest for MERRA-2 (0.72-0.91), MAIAC (0.63-0.96), and CAMS-OA
         :::::::::::::::::::::::::::::::::::::::::::::::::::::::::::::::::::::::::::::::::::::::::::::::::::

     (0.65-0.87), followed by MODIS-DB&DT (0.56-0.84) and WRF-Chem (0.43-0.85). However, CAMS-OA has a relatively high
     :::::::::::::::::::::::::::::::::::::::::::::::::::::::::::::::::::::::::::::::::::::::::::::::::::::

     positive mean bias with respect to AERONET AOD. The spatial distributions of seasonally averaged AODs from WRF-Chem,
     :::::::::::::::::::::::::::::::::::::::::::::::::::::::::::::::::::::::::::::::::::::::::::::::::::::

     assimilation products, and MAIAC are well correlated with MODIS DB&DT AOD product. MAIAC has the highest correlation
     :::::::::::::::::::::::::::::::::::::::::::::::::::::::::::::::::::::::::::::::::::::::::::::::::::::

     (R=0.8) followed by MERRA-2 (R=0.66), CAMS-OA (R=0.65), and WRF-Chem (R=0.61). WRF-Chem, MERRA-2, and
     :::::::::::::::::::::::::::::::::::::::::::::::::::::::::::::::::::::::::::::::::::::::::::::::::::::

20   MAIAC  underestimate, and CAMS-OA overestimates MODIS-DB&DT AOD.
     ::::::::::::::::::::::::::::::::::::::::::::::::::::::::::::::::

         The simulated and observed PM concentrations might differ of a factor of two, because of it is more challenging to the model
         :::::::::::::::::::::::::::::::::::::::::::::::::::::::::::::::::::::::::::::::::::::::::::::::::::

     and the assimilation products to reproduce PM concentration measured within the city. Although aerosol fields in WRF-Chem
     ::::::::::::::::::::::::::::::::::::::::::::::::::::::::::::::::::::::

     and assimilation products are quite entirely
                                         :::::::
                                                  consistent, WRF-Chem, due to its higher spatial resolution and better SO2 SO2

                                                                    1
You can also read