Medtech (Overweight) Aesthetic devices market: Spotlight on innovation
←
→
Page content transcription
If your browser does not render page correctly, please read the page content below
Industry Report | May 24, 2021

  Medtech (Overweight)
  Aesthetic devices market: Spotlight on innovation

  Choong-hyun Kim, CFA choonghyun.kim@miraeasset.com

Analysts who prepared this report are registered as research analysts in Korea but not in any other jurisdiction, including the U.S.
PLEASE SEE ANALYST CERTIFICATIONS AND IMPORTANT DISCLOSURES & DISCLAIMERS IN APPENDIX 1 AT THE END OF REPORT.
Contents

   I.   Key drivers: Vaccination and innovation                    3

   II. Minimally invasive: Energy-based devices leading the way    5

   III. Invasive: Innovations in breast implant market            11

   IV. Domestic market trends                                     17

   V.   Top pick: Classys                                         19

2 | Medtech                                                            Mirae Asset Securities Research

I. Key drivers: Vaccination and innovation
COVID-19 vaccination                               •   Vaccination rates are picking up globally.
status                                             •   In parts of the world where vaccination is well underway, new COVID-19 cases are falling.
                                                   •   The US CDC lifted the mask mandate for vaccinated residents in both indoor and outdoor settings.
                                                   •   Some countries are showing signs of a post-pandemic economic recovery.

 Share of people who have received at least one COVID-19
                                                                                               Cumulative confirmed COVID-19 cases by country (log scale)
 vaccine dose

Source: Our World in Data, Mirae Asset Securities Research                                    Source: Our World in Data, Mirae Asset Securities Research

3 | Medtech                                                                                                                                                Mirae Asset Securities Research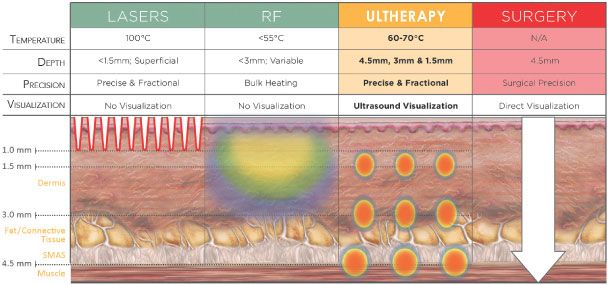
I. Key drivers: Vaccination and innovation
Innovation lifting stocks                            •   Returns from bottom: +907% for Establishment Labs, +527% for InMode, +414% for Cutera, +217% for Lutronic,
                                                         +103% for Classys
to new heights
                                                     •   Earnings have recovered on the reopening of aesthetic and dermatology clinics amid ongoing vaccinations.
                                                     •   2021F revenue growth guidance: +31-36% for InMode, +39-44% for Establishment Labs, +30% for Lutronic
                                                     •   Companies with innovative technologies have seen particularly strong share performances and revenue growth.
                                                     •   Given that some pandemic restrictions still remain in place, we expect top-line growth to accelerate further as the
                                                         post-pandemic recovery gains momentum.
                                                     •   With the aesthetic devices market anticipated to continue robust growth, we think innovative companies merit
                                                         special attention.

 Global energy-based aesthetic device makers: Market cap changes                                Global energy-based aesthetic device makers: Revenue growth

  (8/7/19=100)                                                                                  (%)                     InMode                          Establishment Labs
 350                Classys                         Lutronic                                    130                     Cutera                          Lutronic
                    Establishment Labs              Cutera                                                              Classys
                    InMode
 300                                                                                            110

                                                                                                90
 250                                                                                                                                                Global COVID-19
                                                                                                70                                                      spread
                      Global
 200
                  COVID-19 spread                                                               50

 150                                                                                            30

                                                                                                10
 100
                                                                                                -10
  50
                                                                                                -30

   0                                                                                            -50
       1/20                        7/20                           1/21                                2Q18         4Q18           2Q19       4Q19         2Q20         4Q20     2Q21F

Source Bloomberg, Mirae Asset Securities Research                                              Source: Bloomberg, Mirae Asset Securities Research

4 | Medtech                                                                                                                                              Mirae Asset Securities Research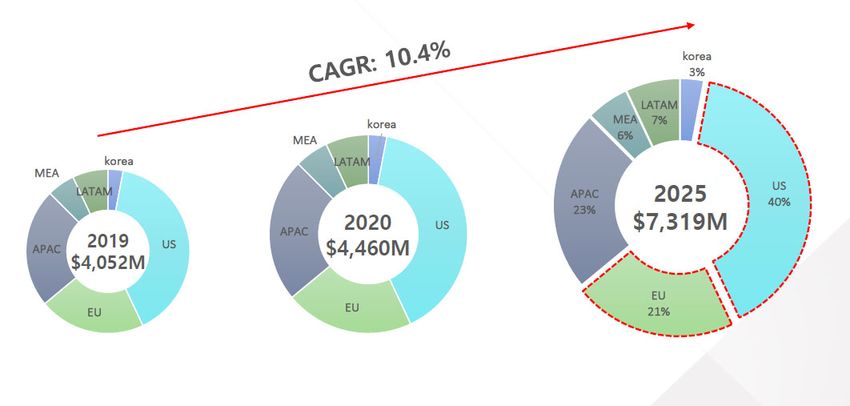
II. Minimally invasive: Energy-based devices leading the way
Global energy-based • Interest in aesthetic treatments is growing in line with rising income levels and standard of living improvements.
aesthetic devices market • In particular, energy-based aesthetic devices—radiofrequency (RF)-based, ultrasound-based, laser-based, etc.—
have increased in popularity, as they enable minimally invasive procedures.
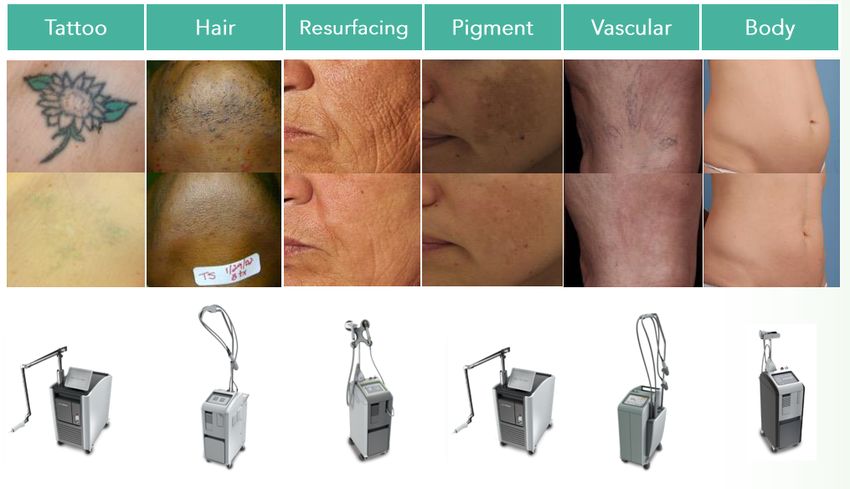
to grow at CAGR of 10% • Energy-based aesthetic devices have the following advantages:
1) Diverse treatment/care options (tattoo removal, hyperpigmentation treatment, body contouring, skin
tightening, blood vessel removal, etc.)
2) Non-surgical, minimally invasive procedures; as effective as surgeries for certain indications
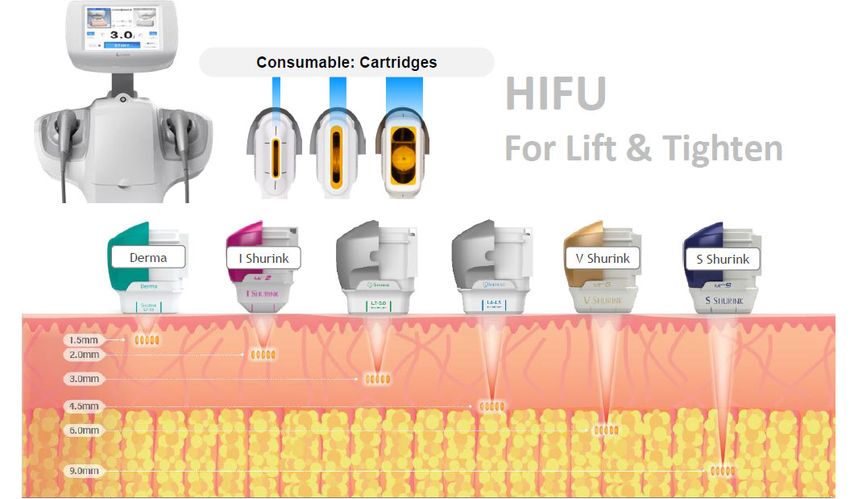
3) Combination therapy (e.g., Ulthera + Thermage, facial contouring injections + Shurink, etc.)
• Between 2021 and 2025, the global energy-based aesthetic devices market is projected to grow from W4-5tr to
US$7.3bn (10% CAGR).
Energy-based aesthetic devices: Applications Global energy-based aesthetic devices: Market size and forecasts
Source: Cutera, Mirae Asset Securities Research Source: Lutronic, Mirae Asset Securities Research
5 | Medtech Mirae Asset Securities Research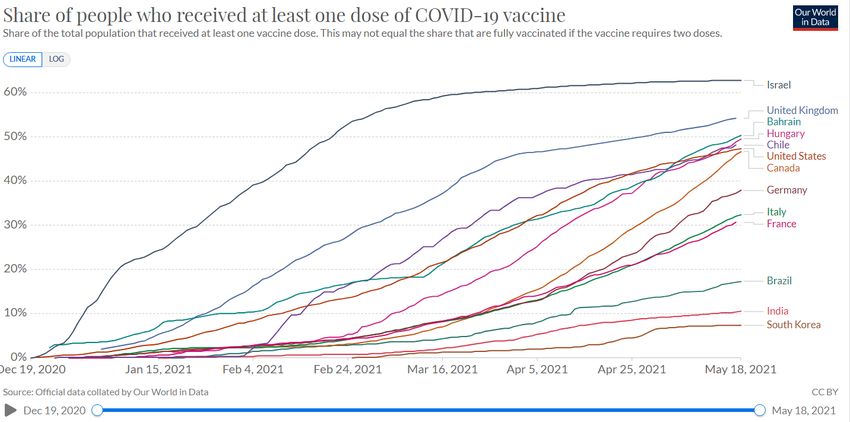
II. Minimally invasive: Energy-based devices leading the way

1980s to mid-2000s:                                   •   The earliest technologies to emerge and gain acceptance were laser devices and intense pulsed light (IPL)
                                                          therapy for peeling, pigmentation treatments, hair removal, photorejuvenation, etc. Market leaders at the time
Laser devices lead                                        were Cynosure, Cutera, Candela, and Lumenis.
market growth                                         •   Laser devices remain the most basic tool in dermatology clinics’ treatment arsenal, with over 40mn such
                                                          procedures performed annually around the globe.
                                                      •   As relevant patents have mostly expired, competition has intensified.
                                                      •   This situation has created opportunities for second-tier competitors, while encouraging incumbents to diversify
                                                          their product portfolios to other energy-based aesthetic devices.

 Revenue comparison of top four players                                                          Low/medium-end device makers catching up with top-tier players

(US$mn)                                                                                         (US$mn)                                                                             (x)
800               Cynosure                                                                      200                       Cutera (L)                                                 4
                  Syneron Candela
                  Lumenis                                                                                                 Lutronic (L)
                                                                                                180
700               Cutera                                                                                                  Cutera/Lutronic (R)
                                                                                                160
600                                                                                                                                                                                 3
                                                                                                140
500
                                                                                                120

400                                                                                             100                                                                                 2

                                                                                                 80
300
                                                                                                 60
200                                                                                                                                                                                 1
                                                                                                 40
100
                                                                                                 20

  0                                                                                                0                                                                                0
         02    03     04     05     06    07     08       09   10   11   12   13   14                    08          10             12          14      16         18          20
Source: Edgar, Mirae Asset Securities Research                                                  Source: Company data, Mirae Asset Securities Research

6 | Medtech                                                                                                                                             Mirae Asset Securities Research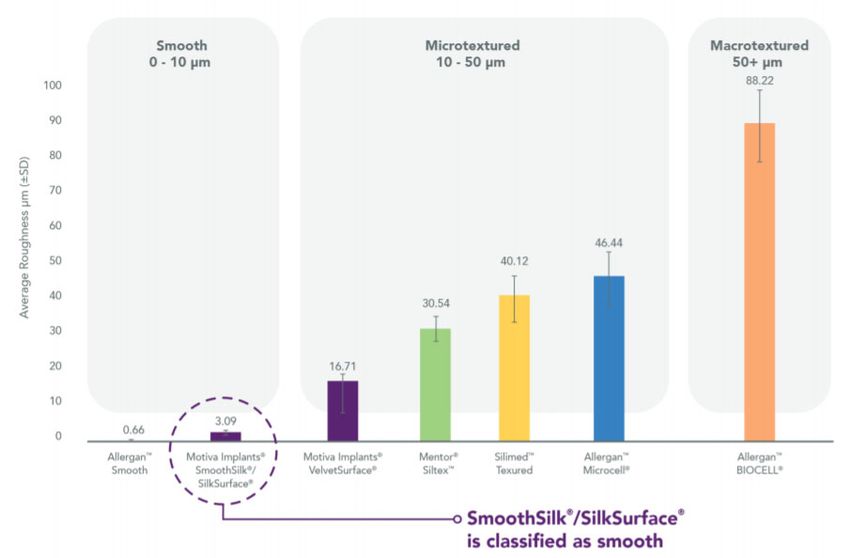
II. Minimally invasive: Energy-based devices leading the way
Mid-2000s onward: • Since the early/mid-2000s, aesthetic devices using a variety of energy types, such as RF (e.g., Solta Medical’s
Thermage), ultrasound, and cryolipolysis, have been developed.
Development of various
• Laser energy can penetrate the skin surface and upper dermis, while RF and ultrasound can reach deeper skin
energy-based aesthetic layers (lower dermis and fascia, respectively).
devices Birth of body • Due to the introduction of these new devices, surgical procedures such as facelifts and liposuction are
increasingly being replaced by non-surgical procedures such as body contouring and skin tightening.
contouring/skin • New entrants Solta Medical, Zeltiq, and Ulthera drove innovation. Premium procedures using their products
tightening market are now are widely performed.
Global financial crisis created opportunities for innovative companies
Energy-based aesthetic devices: Energy types and targeted skin layers
To catch up with incumbents
(US$mn) (x)
800 Big 4 incumbents (L) 10
New players (L)
9
700 Incumbents/new players (R)
8
600
7
500
6
400 5
4
300
3
200
2
100
1
0 0
03 05 07 09 11 13
Source: Merz, Mirae Asset Securities Research Source: Merz, Mirae Asset Securities Research
7 | Medtech Mirae Asset Securities Research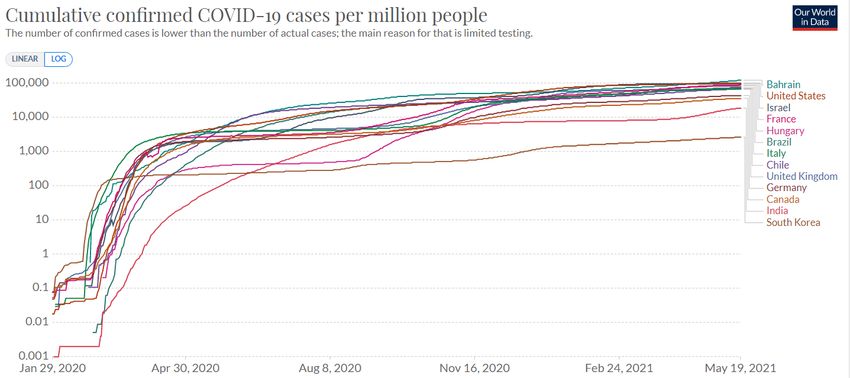
II. Minimally invasive: Energy-based devices leading the way
Comparison of facelift procedures

                                                                                                                                                               High-intensity focused
                                   Surgery                 Hyaluronic acid filler injection              Thread lift                       RF
                                                                                                                                                                 ultrasound (HIFU)

                                                                                                                         RF energy is applied to the         HIFU is applied to the skin's
                                                            Dermal filler is injected into     Dissolvable threads are  skin's deeper layers, causing          deeper layers, causing
                        Skin is surgically removed
Procedure                                                  the lines, folds, and tissues of inserted underneath the skin collagen contraction and             collagen contraction and
                            and repositioned
                                                                       the face                   to lift sagging skin    stimulating new collagen            stimulating new collagen
                                                                                                                                 production                          production

Degree of
                                  Invasive                       Minimally invasive                  Minimally invasive               Non-invasive                  Non-invasive
invasiveness
                                                          Nasolabial folds, tear troughs,           Jawline, cheekbone,
Treatment area                       Face                                                                                              Face, neck                     Face, neck
                                                                 forehead lines                       marionette lines
Interval between
                                   One time                             One year                    Six months to one year     Three months to one year      Three months to one year
procedures

Procedure time                Three-four hours                         30 minutes                        30 minutes                  15-20 minutes                 15-20 minutes

                                                                                                                                 Takes several weeks for        Takes several weeks for
                                                                                                                               tightening results to show;    tightening results to show;
                                                                                               Recovery takes time; does not
                            Recovery takes time;                                                                             relatively frequent treatments relatively frequent treatments
Cons                                                                 Partial lifting            last as long as surgery and       required; possible skin
                      limited target customer base                                                                                                               required; possible skin
                                                                                                       filler injections         damage; pain (numbing     damage; pain (numbing cream
                                                                                                                                 cream may be needed)
                                                                                                                                                                    may be needed)

Price
                                  W2-5mn                            W200-250,000                       W500-600,000                     W1.9mn                        W1-1.2mn
(global brand)

Price
                                  W2-5mn                            W100-140,000                       W100-200,000                  W250-300,000                  W250-300,000
(domestic brand)

Notes: Prices based on 1cc hyaluronic acid filler, four threads, 900 RF shots, and 300 HIFU shots
Source: Industry data, Mirae Asset Securities Research

8 | Medtech                                                                                                                                                Mirae Asset Securities Research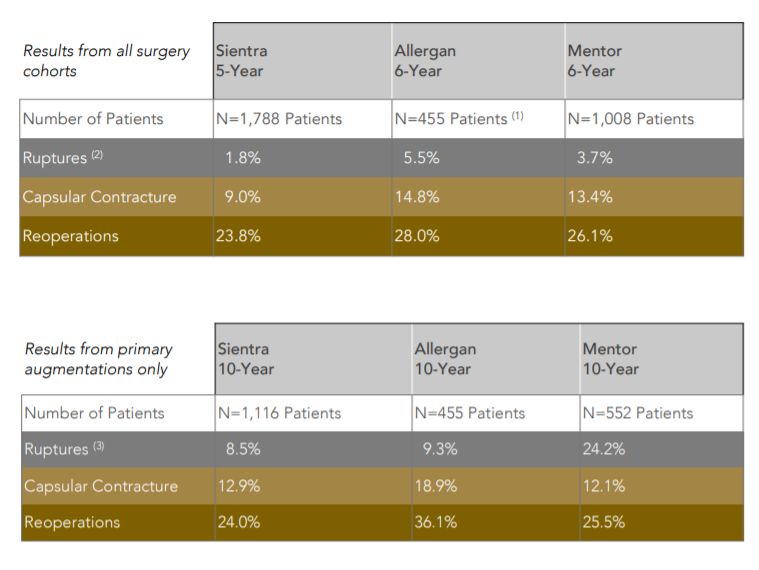
II. Minimally invasive: Energy-based devices leading the way

2013-17: M&A fervor                                    •   In the mid-2010s, as the market experienced structural growth, M&As among energy-based aesthetic device
                                                           makers increased sharply.
sweeps market                                          •   Solta Medical developed the world’s first RF-based anti-wrinkle technology in 2002 and grew at a CAGR of 56% in
                                                           the subsequent decade. The firm was acquired by Valeant Pharmaceuticals in 2013 for US$250mn.
                                                       •   In 2009, Ulthera became the first company to apply HIFU technology to skin lifting. The company grew at 83%
                                                           CAGR over the following years, before being acquired by Merz in 2014 for US$600mn.
                                                       •   Zeltiq developed cryolipolysis technology in 2010. The company grew at a CAGR of 49% over the next seven years,
                                                           and was sold to Allergan in 2017 for US$2.5bn.
                                                       •   In 2017, Hologic acquired medical aesthetic device maker Cynosure for US$1.65bn.

 Zeltiq: Revenue trend (before acquisition by Allergan)                                         Cynosure: Revenue trend (before acquisition by Hologic)

(US$mn)                                                                                          (US$mn)
450                                                                                              500
                                                                                   404.5
                                                                                                 450                                                                                                          433.5
400
                                                                           354.2
                                                                                                 400
350
                                             CAGR: 49%                                           350                                                                                                  339.5
                                                                                                                                                    CAGR: 23%
300
                                                                                                                                                                                              292.4
                                                                   255.4                         300
250
                                                                                                 250                                                                                  226.0
200                                                        174.5
                                                                                                 200
150                                                                                                                                                                           153.5
                                                                                                                                                  139.7
                                                 111.6                                           150                                      124.3
                                                                                                                                                                      110.6
100                                   76.2
                            68.1                                                                 100                               78.4                   72.8 81.8
                                                                                                                            56.3
 50                                                                                                                  41.6
                   25.5                                                                           50     23.0 27.1
          1.6
  0                                                                                                 0
          09        10       11        12         13        14      15      16      17                   02    03    04     05     06      07      08     09   10      11      12      13      14      15      16
Source: Edgar, Mirae Asset Securities Research                                                Source: Edgar, Mirae Asset Securities Research

9 | Medtech                                                                                                                                                            Mirae Asset Securities Research
II. Minimally invasive: Energy-based devices leading the way
Since 2018: • Since the late 2010s, market growth has been driven by companies that generate high gross and OP margins.
Innovative companies • Technological innovation has led to high levels of customer satisfaction, justifying high selling prices and
lowering marketing expenses.
drive market growth • Based on its RF-assisted lipolysis (RFAL) and fractional RF technologies, InMode boasts a high ASP of US$120,000-
130,000 (vs. US$50,000-70,000 for other laser device makers). As such, the company displays a high OP margin of
85% despite its relatively low sales mix of consumables (12%).
• Classys has expanded the mid-end market thanks to the high functional value of its products. Although its ASP is
around half that of Ulthera, Classys has recorded an OP margin of 53%, buoyed by increased consumable sales
(gross margin estimated at 90%) stemming from explosive demand growth.
Classys: Revenue and OP margin trends InMode: Revenue and OP margin trends
(US$bn) (%) (US$mn) (%)
120 Revenue (L) OP margin (R) 60 300 Revenue (L) OP margin (R) 45
279.0
55 40
100 96.6 250
35
50 206.1
81.1
80 76.5 200 30
45
156.4 25
60 40 150
47.5 20
35 100.2
40 34.9 100 15
27.2 30 57.7 10
20 50
25 23.1 5
0 20 0 0
16 17 18 19 20 21F 16 17 18 19 20 21F
Source: Classys, Mirae Asset Securities Research Source: InMode, Mirae Asset Securities Research
10 | Medtech Mirae Asset Securities ResearchIII. Invasive: Innovations in breast implant market
Global breast implant • In the aesthetics market, although minimally invasive procedures are coming into greater focus, more invasive
surgeries are still expanding.
market to grow at 7%
• Globally, the most widely performed cosmetic surgery is breast augmentation, with key markets being the US,
CAGR Brazil, and China.
• In 2019, breast augmentation accounted for the largest share (16%; 1.8mn procedures) of total cosmetic
surgeries performed globally (11.4mn), due in large part to: 1) the absence of a non-invasive substitute; and 2)
rising demand stemming from social media and fashion trends.
• We expect the global breast implant market to grow at a CAGR of 7% to US$3.05bn in 2027.
Global cosmetic surgery statistics Global breast implant market outlook
(‘000 procedures) 2014 2015 2016 2017 2018 2019 (US$bn)
Breast augmentation 1,348 1,489 1,649 1,677 1,863 1,796 3.1
CAGR: +7.2%
3.05
Liposuction 1,373 1,395 1,453 1,574 1,733 1,705 3.1
Double eyelid surgery 1,427 1,265 1,348 1,347 1,100 1,260 3.0
Abdominoplasty 683 759 769 802 889 924 3.0
Rhinoplasty 849 730 787 877 727 822 2.9
Breast lift 499 512 583 658 710 741
2.9
Breast reduction 432 423 466 489 534 600
2.8
Facial fat grafting 966 592 597 603 542 599
2.76
2.8
Buttock augmentation 222 289 332 372 347 479
2.7
Facelift 477 412 427 465 399 448
2.7
Other 1,218 1,969 2,434 2,270 2,163 2,438
2.6
Total 9,018 9,423 10,417 10,669 10,607 11,364 19 27
Source: ISAPS, Mirae Asset Securities Research Source: Fortune Business Insights, Mirae Asset Securities Research
11 | Medtech Mirae Asset Securities ResearchIII. Invasive: Innovations in breast implant market
Global breast augmentation data by country
10 11 13 14 15 16 17 18 19 Share
US 275,038 284,351 313,703 297,297 309,985 331,122 345,236 321,362 269,514 15%
Brazil 173,328 148,962 226,090 185,042 166,430 217,085 235,950 275,283 211,287 12%
Mexico 68,978 72,712 57,691 45,570 61,613 62,206 64,478 70,165 74,637 4%
Russia 22,758 20,572 84,235 67,896 4%
Germany 37,653 36,816 55,160 47,905 53,376 52,209 46,165 65,876 66,972 4%
Italy 66,765 62,055 26,520 23,400 54,128 54,045 64,976 56,073 3%
France 42,504 41,484 40,442 41,924 47,510 53,938 3%
Spain 25,016 25,135 38,820 46,493 48,559 3%
Turkey 19,348 14,680 38,484 45,893 3%
Colombia 45,562 38,779 44,403 39,881 46,702 44,080 45,570 42,774 39,720 2%
Korea 34,025 35,325 23,950 50,553
India 50,600 24,859 29,606 32,920
Japan 49,474 52,220 15,169 20,270 7,751
China 54,700 56,840
Others 297,030 290,461 1,011,198 652,941 705,403 618,529 878,125 1,022,070 861,062 48%
Total 1,262,779 1,205,251 1,773,585 1,348,197 1,488,992 1,649,271 1,677,320 1,862,506 1,795,551 100%
Source: ISAPS, Mirae Asset Securities Research
12 | Medtech Mirae Asset Securities ResearchIII. Invasive: Innovations in breast implant market
Market is highly • The breast implant market began in 1962, when the first breast enlargement surgery using silicone implants was
performed. The market is now highly oligopolistic, with Allergan (AbbVie), Mentor (J&J), GC Aesthetics, and Sientra
oligopolistic due to strict
controlling 85% of the market.
regulations and M&As 1) Medical markets that require invasive surgeries tend to be fairly conservative due to safety issues.
2) Innovation suffered a setback when worries about side effects forced the US FDA to suspend the
manufacturing and sales of silicone implants from 1992 to 2006. Larger companies that survived continued to
acquire smaller firms.
• In terms of filling type, cohesive gel (semi-solid silicone) implants are the most widely used, followed by saline
and liquid silicone.
In 1992, the US FDA banned silicone-filled breast implants Global breast implant M/S
15%
85%
Big 4 Other
Source: Allergan, Mirae Asset Securities Research Source: MarketWatch, Mirae Asset Securities Research
13 | Medtech Mirae Asset Securities ResearchIII. Invasive: Innovations in breast implant market
A new player is taking • Breast implants can be divided into three types (smooth, micro-textured, and macro-textured) based on their
surface treatment.
the oligopolistic breast
• Macro-textured and tear-drop (anatomical) implants were previously the most popular implants in the market.
implant industry by
• However, reoperation rates were around 24-36% due to side effects such as capsular contracture and rupture.
storm (1) • Establishment Labs entered the market in 2011 by receiving the CE mark certification for micro-textured (round-
type) implants.
• As of Oct. 2020, the rate of capsular contracture/implant rupture in the company’s 1.3mn implants placed in the
past decade stands at less than 1%.
Established players’ clinical data (24-36% reoperation rate) Establishment Labs’ clinical data
Internal clinical data External clinical data
Tracking period Oct. 2010-Mar. 2018 Apr. 2013-Apr. 2016
No. of breast
446,773 implants 5,813 patients
plants/patients
Ruptures Less than 0.1% None
Capsular
Less than 0.1% None
contracture
0.76% (8.43% for control
Reoperation None
group)
Source: Establishment Labs, Mirae Asset Securities Research Note: External clinical data published in Aesthetic Surgery Journal in 2017
Source: Establishment Labs, Mirae Asset Securities Research
14 | Medtech Mirae Asset Securities ResearchIII. Invasive: Innovations in breast implant market
A new player is taking • Backed by its innovative breast implant technology, Establishment Labs recorded an astonishing 75% CAGR from
2015 to 2019 (before turning to negative growth in 2020 due to the pandemic).
the oligopolistic breast
• The company is making rapid progress in many regions, capturing the largest market share in Korea (one of the
implant industry by world’s most competitive markets) and holding a 40% market share in Sweden.
storm (2)
Domestic breast implant M/S Establishment Labs revenue
(%) (%) (US$mn) (%)
30 Motiva (L) Allergan + Mentor (R) 90 35 Revenue (L) YoY (R) 140
120
80 80 30
25 25 25 100
23 23 70
25 80
20 60
60
20
50 40
47
15 44 43 20
40 15
0
10 31 30
10 -20
20
5 -40
5
10
-60
0 0 0 0 -80
4Q15 3Q17 4Q17 1Q18 3Q18 1Q17 3Q17 1Q18 3Q18 1Q19 3Q19 1Q20 3Q20 1Q21
Source: Hans BioMed, Mirae Asset Securities Research Source: Establishment Labs, Mirae Asset Securities Research
15 | Medtech Mirae Asset Securities ResearchIII. Invasive: Innovations in breast implant market
Market shift arising from • Since 2018, a number of breast implant associated anaplastic large cell lymphoma (BIA-ALCL) cases were
reported in women with macro-textured breast implants, which are treated to have a rough surface so that they
BIA-ALCL issue
adhere to the breast tissue.
• Allergan (AbbVie) was forced to recall its macro-textured type breast implants and scale back its presence to the
US, Canada, China, and Japan.
• The breast implant market is highly conservative by nature, and the correlation between macro-textured type
implants and BIA-ALCL was enough to change the perceptions of patients and physicians.
• We expect makers of micro-textured/smooth-type implants to gain further market share as a result.
Allergan’s (currently AbbVie) breast implant revenue Three types of breast implants (based on surface treatment)
(US$mn) (%)
140 Breast implants (L) YoY (R) 30
Recall of macro-textured type 20
120 breast implants
10
100 0
-10
80
-20
-30
60
-40
40 -50
-60
20
-70
0 -80
2Q16 4Q16 2Q17 4Q17 2Q18 4Q18 2Q19 4Q19
Source: Allergan, Mirae Asset Securities Research Source: Establishment Labs, Mirae Asset Securities Research
16 | Medtech Mirae Asset Securities ResearchIV. Domestic market trends
Outbound demand: • Initially, domestic energy-based aesthetic device makers generally relied on low prices to compete with global
peers.
Growing exports
• However, after accumulating know-how and clinical data in the domestic market, they started to look for growth
opportunities overseas.
• The COVID-19 outbreak put the brakes on overseas expansion efforts (import restrictions, social distancing
measures, etc.), but exports have steadily recovered since 2Q20.
• Notably, growing exports to the US (over 40% of the global aesthetic device market) should set the stage for a
valuation re-rating for domestic players.
Domestic aesthetic device makers’ export trend
(US$mn) (%)
200 Exports (L) YoY (R) 30
180
20
160
10
140
0
120
100 -10
80
-20
60
-30
40
-40
20
0 -50
1Q15 1Q16 1Q17 1Q18 1Q19 1Q20 1Q21
Note: Based on HS code 901890
Source: TRASS, Mirae Asset Securities Research
17 | Medtech Mirae Asset Securities ResearchIV. Domestic market trends
Inbound demand: • A growing number of people are visiting Korea for medical/aesthetic treatments.
Medical tourism on the • Most of the visitors are from China and Southeast Asian countries.
rise • The most popular procedures are cosmetic surgery and cosmetic dermatology treatments.
• Tourist numbers have plummeted since the COVID-19 outbreak. As travel restrictions ease, however, we think
medical tourism will become one of the key growth drivers for the domestic energy-based aesthetic devices
market.
Share of foreign patients by specialty (2019) No. of foreign patients and YoY growth
('000) (%)
600 No. of patients (L) YoY (R) 60
Internal medicine
Other 23%
23% 50
500
40
400
30
300 20
Plastic surgery 10
OB/GYN 18% 200
8%
0
100
Medical exams -10
11%
Dermatology
17% 0 -20
09 10 11 12 13 14 15 16 17 18 19
Source: KHIDI, Mirae Asset Securities Research Source: KHIDI, Mirae Asset Securities Research
18 | Medtech Mirae Asset Securities ResearchClassys (214150 KQ) Top pick
Going global
Investment points
(Initiate) Buy
• High-margin structure supported by consumables business model: Gross margin has expanded from 69.8% in
2017 to 79.7% in 2020.
Target price (12M, W) 19,000
• Worries over Brazil offset by growing exports elsewhere: Earnings are rapidly improving, led by Japan,
Australia, and Russia.
Current price (5/24/21, W) 14,250 • Stable cash flow: Cash assets have increased from W10.5bn at end-2018 to W66.8bn at end-1Q21. Debt ratio
has also declined to 14.9%.
Expected return 33%
Valuation and recommendation
• We initiate our coverage on Classys with a Buy rating and target price of W19,000.
OP (21F, Wbn) 52 • The stock is currently trading at a 12-month forward P/E of 19.9x, a discount to global peers (22x).
Consensus OP (21F, Wbn) 54 • Risks: 1) COVID-19 resurgence; 2) persistent weakness in exports to Brazil; 3) increasing domestic competition;
EPS growth (21F, %) 12.5 and 4) lack of progress in business diversification
P/E (21F, x) 21.5
Market P/E (21F, x) 11.8
KOSDAQ 948.37
Market cap (Wbn) 922 150
CLASSYS (Dec.) 2018 2019 2020 2021F 2022F 2023F
Shares outstanding (mn) 65 140 KOSDAQ Revenue (Wbn) 47 81 76 97 118 142
Free float (%) 25.9 130 OP (Wbn) 17 42 41 52 63 75
Foreign ownership (%) 7.9 120 OP margin (%) 36.2 51.9 53.9 53.6 53.4 52.8
Beta (12M) 0.49 NP (Wbn) 15 33 38 43 52 62
110
52-week low (W) 11,950 EPS (W) 242 534 590 664 802 958
100
52-week high (W) 17,500 ROE (%) 34.5 48.1 36.1 30.0 27.8 25.8
90
(%) 1M 6M 12M P/E (x) 16.8 26.5 26.1 21.5 17.8 14.9
80
Absolute 2.9 -5.9 -12.6 P/B (x) 5.0 10.4 8.1 5.7 4.4 3.4
70
Relative 11.4 -13.5 -34.7 20.5 20.7 20.9 20.11 21.1 21.3 21.5 Div. yield (%) 0.3 0.3 0.4 0.4 0.4 0.4
Notes: Under consolidated K-IFRS; NP is attributable to owners of the parent
Source: CLASSYS, Mirae Asset Securities Research estimates
19 | Medtech Mirae Asset Securities ResearchClassys (214150 KQ)
Investment point 1: • Classys’s biggest strength is its high-margin consumables-based business model.
High-margin structure • Each of the company’s Shurink cartridges can typically deliver 12,000 shots and must be replaced after 40
uses.
supported by consumables
• We believe COGS ratio is around 30% for devices and 10% for consumables.
business model
• The company has supplied roughly 6,000 devices as of end-2020.
• Growing devices revenue has naturally led to an increase in the revenue mix of consumables (from 26% in
2017 to 49% in 2020).
• In the process, gross margin has expanded from 69.8% in 2017 to 79.7% in 2020.
Revenue breakdown by product (43-47% for consumables) Consumables mix vs. gross margin trend
(%) (%)
Classys Cluederm Consumables Skederm
1% 55 Consumables sales mix (L) 85
2% 3% 3% 2%
Gross margin (R)
50
26%
33% 80
43% 49% 47%
45
11%
75
11% 40
8%
6% 8%
35
70
60% 30
53%
45% 43% 43% 65
25
20 60
17 18 19 20 1Q21 1Q17 3Q17 1Q18 3Q18 1Q19 3Q19 1Q20 3Q20 1Q21
Source: Company data, Mirae Asset Securities Research Source: Company data, Mirae Asset Securities Research
20 | Medtech Mirae Asset Securities ResearchClassys (214150 KQ)
Investment point 2: • On top of Classys’s phenomenal top-line growth in the domestic market, exports have continued to increase
in recent years. Brazil, in particular, has stood out as the most important export market.
Worries over Brazil offset
• For this reason, the resurgence of COVID-19 in Brazil has sparked worries about revenue.
by growing exports
• On the bright side, revenue growth is rapidly improving elsewhere, especially in Japan, Australia, and Russia.
elsewhere The revenue mix of regions outside Korea and Brazil has risen from 39% in 2018 to 54% in 1Q21.
• Rather than excessively worrying over the risk in Brazil, we advise focusing on the company’s expansion in
other export markets.
Brazil revenue trend Ex-Brazil export trend
(Wbn) (%) (Wbn) (%)
4.0 Brazil (L) YoY (R) 350 14.0 Other regions (L) YoY (R) 50
300 40
3.5 12.0
250 30
3.0
10.0 20
200
2.5 10
150
8.0
2.0 100 0
6.0
50 -10
1.5
0 4.0 -20
1.0
-50 -30
2.0
0.5 -40
-100
0.0 -150 0.0 -50
1Q18 3Q18 1Q19 3Q19 1Q20 3Q20 1Q21 1Q18 3Q18 1Q19 3Q19 1Q20 3Q20 1Q21
Source: Company data, Mirae Asset Securities Research Source: Company data, Mirae Asset Securities Research
21 | Medtech Mirae Asset Securities ResearchClassys (214150 KQ)
Investment point 3: • Classys has continued to generate healthy free cash flow thanks to its strong revenue growth and high-
margin business structure.
Stable cash flow
• As a result, cash assets have increased from W10.5bn at end-2018 to W66.8bn at end-1Q21.
• Debt ratio has also declined from 48.3% at end-2018 to 14.9% at end-1Q21, further strengthening the balance
sheet.
• Stable cash flow and the high percentage of cash holdings should allow the company to pursue M&A deals or
invest in R&D.
Cash and equivalents Free cash flow trend
(Wbn) (Wbn)
80 20 FCF
Cash and equivalents 15
70
10
60
5
50
0
40 -5
-10
30
-15
20
-20
10
-25
0 -30
1Q17 3Q17 1Q18 3Q18 1Q19 3Q19 1Q20 3Q20 1Q21 1Q17 3Q17 1Q18 3Q18 1Q19 3Q19 1Q20 3Q20 1Q21
Source: Company data, Mirae Asset Securities Research Source: Company data, Mirae Asset Securities Research
22 | Medtech Mirae Asset Securities ResearchClassys (214150 KQ)
Earnings forecasts • For 2021, we forecast revenue to grow 26.4% YoY to W96.6bn.
• For Korea and Brazil, both of which are still grappling with COVID-19, we see meager growth of 2.4% and 0.1%
YoY, respectively. However, as economies elsewhere reopen on the back of vaccine distribution, we expect
exports (excluding Brazil) to expand 59.2% YoY, driving overall top-line growth.
• While there are concerns over domestic earnings, new product rollouts (Shurink Universe and Volnewmer) later
this year/early next year should have positive effects.
• We forecast operating profit to grow 26.9% YoY to W51.5bn (OP margin of 53.3%).
Earnings forecasts
(Wbn) 1Q20 2Q20 3Q20 4Q20 1Q21 2Q21F 3Q21F 4Q21F 2020 2021F 2022F
Revenue 21.4 14.6 19.6 20.9 21.3 24.1 25.1 26.1 76.5 96.6 118.2
Classys 9.2 5.8 8.2 9.7 9.2 10.0 10.5 11.0 32.9 40.7 50.4
Cluederm 1.4 0.7 1.2 1.1 1.8 2.3 2.4 2.2 4.4 8.7 10.4
Consumables 10.5 7.6 9.9 9.8 10.1 11.3 11.9 12.5 37.7 45.8 55.9
Cosmetics 0.3 0.5 0.3 0.3 0.2 0.4 0.3 0.4 1.4 1.3 1.5
OP 13.4 6.4 11.9 8.9 10.9 12.9 13.5 14.2 40.6 51.5 63.1
Pretax profit 14.7 6.2 11.5 6.9 12.6 12.9 13.6 14.2 39.3 53.3 63.3
NP (owners of parent) 11.4 4.7 8.8 13.2 9.6 10.6 11.1 11.7 38.2 43.0 51.9
OP margin (%) 62.7 43.6 60.6 42.8 51.1 53.5 53.9 54.4 53.1 53.3 53.4
Pretax margin (%) 68.6 42.5 58.6 33.2 58.9 53.6 54.1 54.5 51.4 55.1 53.6
Net margin (%) 21.4 14.6 19.6 20.9 21.3 24.1 25.1 26.1 76.5 96.6 118.2
Source: Company data, Mirae Asset Securities Research estimates
23 | Medtech Mirae Asset Securities ResearchClassys (214150 KQ)
Valuation and risks • We present a target price of W19,000 on Classys. With 33.3% upside potential, we present a Buy rating on the
stock.
• We derived our target price by applying a P/E of 25x—the stock’s peak multiple over the past year—to our 12-
month forward net profit estimate of W46.7bn.
• We view our target valuation as highly achievable, considering: 1) the stock’s historical peak multiple of 28x; and
2) the fact that aesthetic companies with high exposure to consumables have traded at the upper end of the 20x
range or above 30x P/E during their high-growth periods.
• At present, Classys is trading at a 12-month forward P/E of 19.9x, in line with global peers (22x).
• Risks: 1) COVID-19 resurgence; 2) persistent weakness in exports to Brazil; 3) increasing domestic competition;
and 4) lack of progress in business diversification.
Valuation
Value Notes
Target multiple (x) 25 Peak P/E multiple over the past year
NP (Wbn) 46.7 12-month forward EPS
Valuation (Wbn) 1,167
Share count (shares) 64,716,864 As of end-Mar. 2021
Target price (W) 19,000
Current price (W) 14,250
Upside potential (%) 33.3%
Source: TRASS, Mirae Asset Securities Research
24 | Medtech Mirae Asset Securities ResearchClassys (214150 KQ)
Global peer valuation (Wbn)
Market OP margin (%) P/E (x) P/S (x) ROE (%) Revenue (Wbn)
cap 20 21F 22F 20 21F 22F 20 21F 22F 20 21F 22F 20 21F 22F
InMode 2,960 35.3 38.7 38.1 30.4 25.1 23.1 11.2 9.4 7.9 34.9 33.6 26.9 243 314 376
Hugel 2,537 37.0 41.0 42.4 46.6 32.9 26.2 10.9 9.5 7.9 5.8 9.7 11.1 211 268 322
Establishment
1,761 -33.0 -16.2 -9.6 - - - 17.3 13.1 10.4 -33.5 -39.5 -47.0 100 134 169
Labs
Medytox 1,095 -26.3 1.6 18.4 - - - 6.8 7.0 5.8 -11.8 4.3 13.0 141 157 190
Classys 903 53.1 56.8 58.0 24.9 19.5 15.4 11.8 9.0 7.1 36.0 32.3 30.7 76 101 127
L&C Bio 643 22.2 29.7 31.0 59.8 - - 19.6 15.3 11.7 18.6 13.9 16.0 33 42 55
Cutera 589 -15.5 0.3 5.1 - - - 3.1 2.5 2.3 -31.5 1.4 5.5 174 229 254
Lutronic 275 5.4 14.7 27.9 - 15.0 6.5 2.2 1.9 1.6 -14.7 15.6 28.1 116 145 173
Venus Concept 110 -87.0 -20.8 -10.7 - - - 0.9 1.0 0.8 -144.0 - - 92 114 139
Avg. -1.0 16.2 22.3 40.4 23.1 17.8 9.3 7.6 6.2 -15.6 8.9 10.5 132 167 200
Source: Bloomberg, Mirae Asset Securities Research
Foreign and institutional net buying 12-month forward P/E band chart
(Wbn) (W) (W)
140 Share price (R) 20,000 30x 25x
20000
120 Domestic institutions (L) 18,000 18000
100 16,000 16000 20x
Foreign investors (L)
80 14,000 14000
12,000 12000 15x
60
10,000 10000
40
8,000 8000 10x
20 6,000 6000
0 4,000 4000
-20 2,000 2000
-40 0 0
1/17 7/17 1/18 7/18 1/19 7/19 1/20 7/20 1/21 18 19 20 21
Source: Mirae Asset Securities Research Source: Mirae Asset Securities Research
25 | Medtech Mirae Asset Securities ResearchClassys (214150 KQ)
Company overview • Established in 2007, Classys went public on the KOSDAQ in 2017 through a merger with KTB SPAC 2.
• The company’s core product is Shurink, an HIFU facelift device.
• The company has a consumables-based business model that generates high margins and has supplied around
6,000 devices globally as of end-2020. The revenue mix of consumables overtook that of devices in 2020.
• More than 60% of revenue comes from exports, with the biggest export market being Brazil.
Classys’s flagship brand Shurink
Source: Company materials, Mirae Asset Securities Research
26 | Medtech Mirae Asset Securities ResearchClassys (214150 KQ)
Key charts
Revenue breakdown by region Revenue breakdown by product
Korea Brazil Other Classys Cluederm Consumables Skederm
2% 3% 3% 2% 1%
26%
39% 43% 33%
49% 54% 43% 49% 47%
63% 11%
11%
12%
12% 8% 8%
9% 6%
10%
4.8%
60% 53%
42% 49% 45% 45% 43% 43%
32.6% 36%
17 18 19 20 1Q21 17 18 19 20 1Q21
Source: Company data, Mirae Asset Securities Research Source: Company data, Mirae Asset Securities Research
Ownership breakdown
Other
18%
Foreign investors
8%
Jung Sung-jae
51%
Affiliates
23%
Source: Company data, Mirae Asset Securities Research
27 | Medtech Mirae Asset Securities ResearchClassys (214150 KQ) Income statement (summarized) Balance sheet (summarized) Key valuation metrics/ratios (Wbn) 2020 2021F 2022F 2023F (Wbn) 2020 2021F 2022F 2023F 2020 2021F 2022F 2023F Revenue 76 97 118 142 Current assets 83 124 175 237 P/E (x) 26.1 21.5 17.8 14.9 Cost of revenue 16 19 24 28 Cash & equivalents 64 96 142 198 P/CF (x) 22.5 17.1 14.1 11.9 GP 60 78 94 114 AR & other receivables 3 4 5 6 P/B (x) 8.1 5.7 4.4 3.4 SG&A expenses 20 26 31 39 Inventory 10 12 15 18 EV/EBITDA (x) 21.7 15.2 11.7 9.2 OP (adj.) 41 52 63 75 Other current assets 6 12 13 15 EPS (W) 590 664 802 958 OP 41 52 63 75 Non-current assets 55 56 57 57 CFPS (W) 684 834 1,011 1,199 Non-operating profit -2 1 0 1 Investments in associates 0 0 0 0 BPS (W) 1,913 2,516 3,259 4,157 Net financial income 0 0 0 0 PP&E 50 51 51 51 DPS (W) 60 60 60 60 Net income from associates 0 0 0 0 Intangible assets 1 1 1 1 Dividend payout ratio (%) 10.2 9.0 7.5 6.3 Pretax profit 39 53 63 76 Total assets 138 180 232 294 Dividend yield (%) 0.4 0.4 0.4 0.4 Income tax 1 10 11 14 Current liabilities 13 17 20 24 Revenue growth (%) -6.2 27.6 21.6 20.3 Profit from continuing opera 38 43 52 62 AP & other payables 1 1 1 2 EBITDA growth (%) 0.0 25.6 20.4 20.0 Profit from discontinued ope 0 0 0 0 Short-term financial liabil 0 0 0 0 OP growth (%) -2.4 26.8 21.2 19.0 NP 38 43 52 62 Other current liabilities 12 16 19 22 EPS growth (%) 10.5 12.5 20.8 19.5 Attributable to owners 38 43 52 62 Non-current liabilities 0 1 1 1 AR turnover (x) 27.6 28.3 28.3 28.3 Attributable to minority inter 0 0 0 0 Long-term financial liabili 0 0 0 0 Inventory turnover (x) 8.2 8.6 8.6 8.6 Total comprehensive income 38 43 52 62 Other non-current liabiliti 0 1 1 1 AP turnover (x) 54.8 52.5 52.5 52.5 Attributable to owners 38 43 52 62 Total liabilities 14 17 21 25 ROA (%) 30.4 27.0 25.2 23.6 Attributable to minority inter 0 0 0 0 Equity attributable to own 124 163 211 269 ROE (%) 36.1 30.0 27.8 25.8 EBITDA 43 54 65 78 Capital stock 6 6 6 6 ROIC (%) 76.9 77.5 95.1 113.1 FCF 37 37 52 62 Capital surplus 24 24 24 24 Debt-to-equity ratio (%) 11.1 10.6 9.9 9.3 EBITDA margin (%) 56.6 55.7 55.1 54.9 Retained earnings 93 132 180 238 Current ratio (%) 617.2 736.1 865.3 968.7 OP margin (%) 53.9 53.6 53.4 52.8 Minority interests 0 0 0 0 Net debt-to-equity ratio (%) -55.5 -65.0 -72.8 -78.4 Net margin (%) 50.0 44.3 44.1 43.7 Shareholders' equity 124 163 211 269 Interest coverage ratio (x) 240.4 4,496.9 4,813.7 5,185.8 Source: CLASSYS, Mirae Asset Securities Research estimates 28 | Medtech Mirae Asset Securities Research
Important disclosures and disclaimers
 Two-year rating and TP history
 Company                                                                            Date               Rating               TP (W)
                                                                                                                                                     (W)                          CLASSYS
 CLASSYS (214150)                                                               05/24/21                  Buy               19,000                 20,000

                                                                                                                                                   15,000

                                                                                                                                                   10,000

                                                                                                                                                    5,000

                                                                                                                                                        0
                                                                                                                                                        May 19                   May 20              May 21

 Stock ratings                                                                                                    Sector ratings
 Buy                Expected 12-month performance: +20% or greater                                                Overweight         Expected to outperform the market over 12 months
 Trading Buy        Expected 12-month performance: +10% to +20%                                                   Neutral            Expected to perform in line with the market over 12 months
 Hold               Expected 12-month performance: -10% to +10%                                                   Underweight        Expected to underperform the market over 12 months
 Sell               Expected 12-month performance: -10% or worse

    Rating and TP history: Share price (─), TP (▬), Not Rated (■), Buy (▲), Trading Buy (■), Hold (●), Sell (◆)
    * Our investment rating is a guide to the expected return of the stock over the next 12 months.
    * Outside of the official ratings of Mirae Asset Securities Co., Ltd., analysts may call trading opportunities should technical or short-term material developments arise.
    * The TP was determined by the research analyst through valuation methods discussed in this report, in part based on estimates of future earnings.
    * TP achievement may be impeded by risks related to the subject securities and companies, as well as general market and economic conditions.

 Ratings distribution and investment banking services
                                                                      Buy                                     Trading Buy                                   Hold                                  Sell
 Ratings distribution                                                79.00%                                       13.00%                                    7.00%                                 1.00%
 Investment banking services                                         63.16%                                       31.58%                                    5.26%                                 0.00%
 * Based on recommendations in the last 12-months (as of March 31, 2021)

29 | Medtech                                                                                                                                                                          Mirae Asset Securities Research
Disclosures As of the publication date, Mirae Asset Securities Co., Ltd. and/or its affiliates do not have any special interest with the subject company and do not own 1% or more of the subject company's shares outstanding. Analyst certification The research analysts who prepared this report (the “Analysts”) are registered with the Korea Financial Investment Association and are subject to Korean securities regulations. They are neither registered as research analysts in any other jurisdiction nor subject to the laws or regulations thereof. Each Analyst responsible for the preparation of this report certifies that (i) all views expressed in this report accurately reflect the personal views of the Analyst about any and all of the issuers and securities named in this report and (ii) no part of the compensation of the Analyst was, is, or will be directly or indirectly related to the specific recommendations or views contained in this report. Mirae Asset Securities Co., Ltd. (“Mirae Asset Securities”) policy prohibits its Analysts and members of their households from owning securities of any company in the Analyst’s area of coverage, and the Analysts do not serve as an officer, director, or advisory board member of the subject companies. Except as otherwise specified herein, the Analysts have not received any compensation or any other benefits from the subject companies in the past 12 months and have not been promised the same in connection with this report. Like all employees of Mirae Asset Securities, the Analysts receive compensation that is determined by overall firm profitability, which includes revenues from, among other business units, the institutional equities, investment banking, proprietary trading, and private client divisions. At the time of publication of this report, the Analysts do not know or have reason to know of any actual, material conflict of interest of the Analyst or Mirae Asset Securities except as otherwise stated herein. Disclaimers This report was prepared by Mirae Asset Securities, a broker-dealer registered in the Republic of Korea and a member of the Korea Exchange. Information and opinions contained herein have been compiled in good faith and from sources believed to be reliable, but such information has not been independently verified and Mirae Asset Securities makes no guarantee, representation or warranty, express or implied, as to the fairness, accuracy, completeness, or correctness of the information and opinions contained herein or of any translation into English from the Korean language. In case of an English translation of a report prepared in the Korean language, the original Korean language report may have been made available to investors in advance of this report. The intended recipients of this report are sophisticated institutional investors who have substantial knowledge of the local business environment, its common practices, laws, and accounting principles, and no person whose receipt or use of this report would violate any laws or regulations or subject Mirae Asset Securities or any of its affiliates to registration or licensing requirements in any jurisdiction shall receive or make any use hereof. This report is for general information purposes only and is not and shall not be construed as an offer or a solicitation of an offer to effect transactions in any securities or other financial instruments. The report does not constitute investment advice to any person, and such person shall not be treated as a client of Mirae Asset Securities by virtue of receiving this report. This report does not take into account the particular investment objectives, financial situations, or needs of individual clients. The report is not to be relied upon in substitution for the exercise of independent judgment. Information and opinions contained herein are as of the date hereof and are subject to change without notice. The price and value of the investments referred to in this report and the income from them may depreciate or appreciate, and investors may incur losses on investments. Past performance is not a guide to future performance. Future returns are not guaranteed, and a loss of original capital may occur. Mirae Asset Securities, its affiliates, and their directors, officers, employees, and agents do not accept any liability for any loss arising out of the use hereof. Mirae Asset Securities may have issued other reports that are inconsistent with, and reach different conclusions from, the opinions presented in this report. The reports may reflect different assumptions, views, and analytical methods of the analysts who prepared them. Mirae Asset Securities may make investment decisions that are inconsistent with the opinions and views expressed in this research report. Mirae Asset Securities, its affiliates, and their directors, officers, employees, and agents may have long or short positions in any of the subject securities at any time and may make a purchase or sale, or offer to make a purchase or sale, of any such securities or other financial instruments from time to time in the open market or otherwise, in each case either as principals or agents. Mirae Asset Securities and its affiliates may have had, or may be expecting to enter into, business relationships with the subject companies to provide investment banking, market-making, or other financial services as are permitted under applicable laws and regulations. No part of this document may be copied or reproduced in any manner or form or redistributed or published, in whole or in part, without the prior written consent of Mirae Asset Securities. For further information regarding company-specific information as it pertains to the representations and disclosures in this Appendix 1, please contact compliance@miraeasset.us.com or +1 (212) 407-1000. 30 | Medtech Mirae Asset Securities Research
Distribution
 United Kingdom: This report is being distributed by Mirae Asset Securities (UK) Ltd. in the United Kingdom only to (i) investment professionals falling within Article 19(5) of the Financial Services and
 Markets Act 2000 (Financial Promotion) Order 2005 (the “Order”), and (ii) high net worth companies and other persons to whom it may lawfully be communicated, falling within Article 49(2)(A) to (E) of
 the Order (all such persons together being referred to as “Relevant Persons”). This report is directed only at Relevant Persons. Any person who is not a Relevant Person should not act or rely on this
 report or any of its contents.
 United States: Mirae Asset Securities is not a registered broker-dealer in the United States and, therefore, is not subject to U.S. rules regarding the preparation of research reports and the independence
 of research analysts. This report is distributed in the U.S. by Mirae Asset Securities (USA) Inc., a member of FINRA/SIPC, to “major U.S. institutional investors” in reliance on the exemption from
 registration provided by Rule 15a-6(b)(4) under the U.S. Securities Exchange Act of 1934, as amended. All U.S. persons that receive this document by their acceptance hereof represent and warrant that
 they are a major U.S. institutional investor and have not received this report under any express or implied understanding that they will direct commission income to Mirae Asset Securities or its
 affiliates. Any U.S. recipient of this document wishing to effect a transaction in any securities discussed herein should contact and place orders with Mirae Asset Securities (USA) Inc. Mirae Asset
 Securities (USA) Inc. accepts responsibility for the contents of this report in the U.S., subject to the terms hereof, to the extent that it is delivered to a U.S. person other than a major U.S. institutional
 investor. Under no circumstances should any recipient of this research report effect any transaction to buy or sell securities or related financial instruments through Mirae Asset Securities. The
 securities described in this report may not have been registered under the U.S. Securities Act of 1933, as amended, and, in such case, may not be offered or sold in the U.S. or to U.S. persons absent
 registration or an applicable exemption from the registration requirements.
 Hong Kong: This report is distributed in Hong Kong by Mirae Asset Securities (HK) Limited, which is regulated by the Hong Kong Securities and Futures Commission. The contents of this report have not
 been reviewed by any regulatory authority in Hong Kong. This report is for distribution only to professional investors within the meaning of Part I of Schedule 1 to the Securities and Futures Ordinance
 of Hong Kong (Cap. 571, Laws of Hong Kong) and any rules made thereunder and may not be redistributed in whole or in part in Hong Kong to any person.
 India: This report is being distributed by Mirae Asset Capital Markets (India) Private Limited (“MACM”) in India to the customers based in India and is personal information only for those authorised
 recipient(s). MACM is inter alia a Securities and Exchange Board of India (“SEBI”) registered Research Analyst in India and is not registered outside India. MACM and Mirae Asset, Korea are group
 entities. MACM makes no guarantee, representation or warranty, express or implied, as to the fairness, accuracy, completeness or correctness of the information and opinions contained herein. The
 user assumes the entire risk of any use made of this information. This report has been provided for assistance only and is not intended to be and must not alone be taken as the basis for an investment
 decision. Recipient must read the entire Appendix 1 to the report carefully for Important Disclosures & Disclaimers.
 All other jurisdictions: Customers in all other countries who wish to effect a transaction in any securities referenced in this report should contact Mirae Asset Securities or its affiliates only if distribution
 to or use by such customer of this report would not violate applicable laws and regulations and not subject Mirae Asset Securities and its affiliates to any registration or licensing requirement within
 such jurisdiction.

31 | Medtech                                                                                                                                                                  Mirae Asset Securities Research
Mirae Asset Securities International Network
 Mirae Asset Securities Co., Ltd. (Seoul)       Mirae Asset Securities (HK) Ltd.                     Mirae Asset Securities (UK) Ltd.
 One-Asia Equity Sales Team                     Units 8501, 8507-8508, 85/F                          41st Floor, Tower 42
 Mirae Asset Center 1 Building                  International Commerce Centre                        25 Old Broad Street,
 26 Eulji-ro 5-gil, Jung-gu, Seoul 04539        1 Austin Road West                                   London EC2N 1HQ
 Korea                                          Kowloon                                              United Kingdom
                                                Hong Kong
 Tel: 82-2-3774-2124                            Tel: 852-2845-6332                                   Tel: 44-20-7982-8000

 Mirae Asset Securities (USA) Inc.              Mirae Asset Wealth Management (USA) Inc.             Mirae Asset Wealth Management (Brazil) CCTVM
 810 Seventh Avenue, 37th Floor                 555 S. Flower Street, Suite 4410,                    Rua Funchal, 418, 18th Floor, E-Tower Building
 New York, NY 10019                             Los Angeles, California 90071                        Vila Olimpia
 USA                                            USA                                                  Sao Paulo - SP
                                                                                                     04551-060
                                                                                                     Brazil
 Tel: 1-212-407-1000                            Tel: 1-213-262-3807                                  Tel: 55-11-2789-2100

 PT. Mirae Asset Sekuritas Indonesia            Mirae Asset Securities (Singapore) Pte. Ltd.         Mirae Asset Securities (Vietnam) LLC
 Equity Tower Building Lt. 50                   6 Battery Road, #11-01                               7F, Saigon Royal Building
 Sudirman Central Business District             Singapore 049909                                     91 Pasteur St.
 Jl. Jend. Sudirman, Kav. 52-53                 Republic of Singapore                                District 1, Ben Nghe Ward, Ho Chi Minh City
 Jakarta Selatan 12190                                                                               Vietnam
 Indonesia
 Tel: 62-21-515-3281                            Tel: 65-6671-9845                                    Tel: 84-8-3911-0633 (ext.110)
 Mirae Asset Securities Mongolia UTsK LLC       Mirae Asset Investment Advisory (Beijing) Co., Ltd   Beijing Representative Office
 #406, Blue Sky Tower, Peace Avenue 17          2401B, 24th Floor, East Tower, Twin Towers           2401A, 24th Floor, East Tower, Twin Towers
 1 Khoroo, Sukhbaatar District                  B12 Jianguomenwai Avenue, Chaoyang District          B12 Jianguomenwai Avenue, Chaoyang District
 Ulaanbaatar 14240                              Beijing 100022                                       Beijing 100022
 Mongolia                                       China                                                China

 Tel: 976-7011-0806                             Tel: 86-10-6567-9699                                 Tel: 86-10-6567-9699 (ext. 3300)
 Shanghai Representative Office                 Ho Chi Minh Representative Office                    Mirae Asset Capital Markets (India) Private Limited
 38T31, 38F, Shanghai World Financial Center    7F, Saigon Royal Building                            Unit No. 506, 5th Floor, Windsor Bldg.,
 100 Century Avenue, Pudong New Area            91 Pasteur St.                                       Off CST Road, Kalina, Santacruz (East), Mumbai – 400098
 Shanghai 200120                                District 1, Ben Nghe Ward, Ho Chi Minh City          India
 China                                          Vietnam

 Tel: 86-21-5013-6392                           Tel: 84-8-3910-7715                                  Tel: 91-22-62661336

32 | Medtech                                                                                                                     Mirae Asset Securities Research
You can also read