Meet the Virtual Jeju Dol Harubang-The Mixed VR/AR Application for Cultural Immersion in Korea's Main Heritage - MDPI
←
→
Page content transcription
If your browser does not render page correctly, please read the page content below
International Journal of
           Geo-Information

Article
Meet the Virtual Jeju Dol Harubang—The Mixed
VR/AR Application for Cultural Immersion in Korea’s
Main Heritage
Kwanghee Jung 1,† , Vinh T. Nguyen 2,† , Diana Piscarac 3 and Seung-Chul Yoo 3, *
 1    Department of Educational Psychology and Leadership, Texas Tech University, Lubbock, TX 79409, USA;
      kwanghee.Jung@ttu.edu
 2    Department of Computer Science, Texas Tech University, Lubbock, TX 79409, USA; vinh.nguyen@ttu.edu
 3    Division of Communication & Media, Ewha Womans University, Seoul 03760, Korea;
      diana.piscarac@ewhain.net
 *    Correspondence: communication@ewha.ac.kr
 †    These authors contributed equally to this work.

 Received: 30 April 2020; Accepted: 29 May 2020; Published: 2 June 2020

 Abstract: Jeju Island comes second to only Seoul as Korea’s most visited destination, yet most visitors
 do not have the chance to go beyond brief visits and immerse themselves in the island’s history
 and cultural heritage. This project introduces the cultural heritage of Jeju Island to visitors through
 virtual reality/augmented reality (VR/AR) model visualization technology, namely JejuView, which
 provides an intuitive way to experience cultural heritage sites on the island. The proposed VR/AR
 application is designed to introduce a series of heritage spots on Jeju Island through (i) a printed Jeju
 map with embedded QR code markers that enable viewers to experience the locations without being
 present at the site, (ii) a mobile device with WebGL supported browser which allows 3D content to
 be rendered, and (iii) an AR library (A-Frame.io) that enables enthusiasts to recreate similar work.
 To test the effectiveness of the proposed VR/AR application, the authors conducted an experiment
 with 251 participants to test the research model based on the technology acceptance model (TAM)
 and employed generalized structured component analysis (GSCA) for the analysis. Results show that
 when using sensory new media such as VR/AR, consumers are more focused on the hedonic value
 than on the utilitarian value of the information. In conclusion, the proposed VR/AR application
 is complementary to existing studies and provides significant support to researchers, engineers,
 and designers developing VR/AR technologies for use in cultural education and tourism marketing.

 Keywords: virtual reality; augmented reality; a-frame; cultural education and preservation; Jeju
 island; heritage tour; tourism marketing; technology acceptance model; generalized structured
 component analysis

1. Introduction
      The tourism industry plays an important role in promoting local economic development as well
as in disseminating the national cultural values of one country to others around the world. Many
efforts have been made in this line to provide information to tourists using both traditional media,
such as flyers, magazines, newspapers, videos, and podcasts, and new means of communication
(e.g., social media). Recently, with the help of new media technologies, advertising in tourism has gone
beyond giving information; it now serves educational as well as entertainment purposes to attract more
tourists. For example, by using a head-mounted display (HMD), customers are now able to immerse
themselves in a virtual world (or virtual reality [VR]) to experience a place that they have never been
to, or to explore forgotten artifacts. By using a device with an attached camera (e.g., binoculars, tablet,

ISPRS Int. J. Geo-Inf. 2020, 9, 367; doi:10.3390/ijgi9060367                     www.mdpi.com/journal/ijgi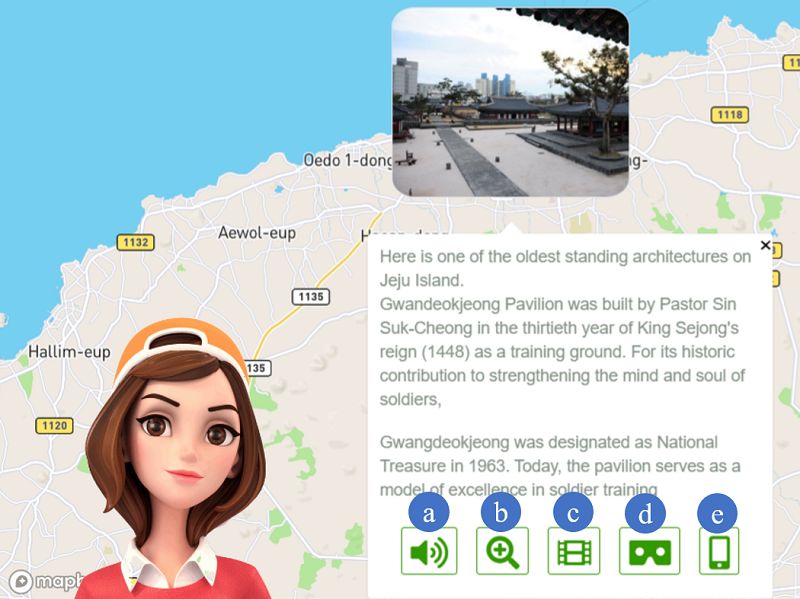
ISPRS Int. J. Geo-Inf. 2020, 9, 367                                                                 2 of 17

smartphone) tourists can recreate lost buildings, see 3D animals running around, travel into the past,
or visualize the sculptural heritage [1]. These combinations of multi-modal platforms pave the way for
new methods to provide a richer experience to customers.
      In recent years, the world has witnessed a series of unexpected catastrophic events such as
earthquakes, tsunamis (in Japan, Thailand), bushfires (in Australia), and snowstorms (in the US),
as well as the spread of disease (e.g., the Ebola virus, Covid-19), making it difficult or even impossible
for tourists to travel [2]. Existing approaches may not be optimal since they require customers to be at
the site in order to use technological devices (e.g., programmed HMDs, binoculars, markers). The need
to disseminate information combined with a desire to discover have pushed us to think of a new way
to alleviate this problem. Furthermore, the new idea should be robust, meaning that it is applicable
even when there is no catastrophe.
      Korea is known as one of the leading countries in telecommunication, entertainment, and tourism.
Jeju Island comes second to only Seoul as Korea’s most visited destination. Due to its isolated location
just off the southern tip of Korea, most visitors do not have the chance to go beyond brief visits and
immerse themselves in the island’s history and cultural heritage. Therefore, taking into account the
changing global context, there is a clear need to have a new means of communication that enable
remote tourists to experience and enjoy the cultural values of Jeju without necessarily being present at
the actual location.
      In response to this need, our research introduces a comprehensive approach that combines
multiple existing methods as well as our newly developed procedure to construct a multimodal
VR/AR application, called JejuView. In our application, visitors are able to navigate to different
places with the help of a virtual avatar assistant, or they can immerse themselves in a virtual world
using only a smartphone and a low-cost VR headset (i.e., Google Cardboard). On the other hand,
the augmented reality (AR) application enables remote tourists to experience Jeju artifacts in the
comfort of their own homes, by watching the virtual Dol Harubang, Jeju’s iconic stone guardian,
introduce various places. The use of VR/AR has shown numerous advantages in many different
domains, from production design, manufacturing [3], infrastructure [4] to fostering decision making
processes [5]. Berg and Vance [3] suggested that VR has reached a level of mature, stable, usable
performance and this suggestion was confirmed in the study of Nguyen et al. [6]

2. Research Aim
     To the best of our knowledge, there is no other study that exploits the use of multi-modal VR/AR
web applications to promote national cultural values, which makes this research a unique contribution.
Our study addresses this gap by introducing a comprehensive web-based VR/AR application that
helps promote cultural identity by enabling remote tourists to experience some typical places on Jeju
Island. Consequently, this paper contributes to current research as it:
•     provides a unique multimodal approach to introduce places and artifacts on Jeju Island;
•     illustrates its approach through an open-source, web-based VR/AR application called JejuView;
      and
•     evaluates the proposed VR/AR application using the technology acceptance model with the
      following hypothesises:

      –      H1:   Perceived visual design will have a positive effect on perceived Task-Technology Fit.
      –      H2:   Perceived visual design will have a positive effect on Perceived Usefulness.
      –      H3:   Perceived Task-Technology Fit will have a positive effect on Perceived Ease-of-Use.
      –      H4:   Perceived Ease-of-Use will have a positive effect on Perceived Usefulness.
      –      H5:   Perceived Usefulness will have a positive effect on Intention to Use.
      –      H6:   Perceived Ease-of-Use will have a positive effect on Intention to Use.
      –      H7:   Perceived Usefulness will have a positive effect on Intention to Visit.
      –      H8:   Perceived Ease-of-Use will have a positive effect on Intention to Visit.

    The paper content is structured as follows: Section 3 outlines existing work that is similar to our
study. Section 4 presents the methods for designing our proposed application, and also describes the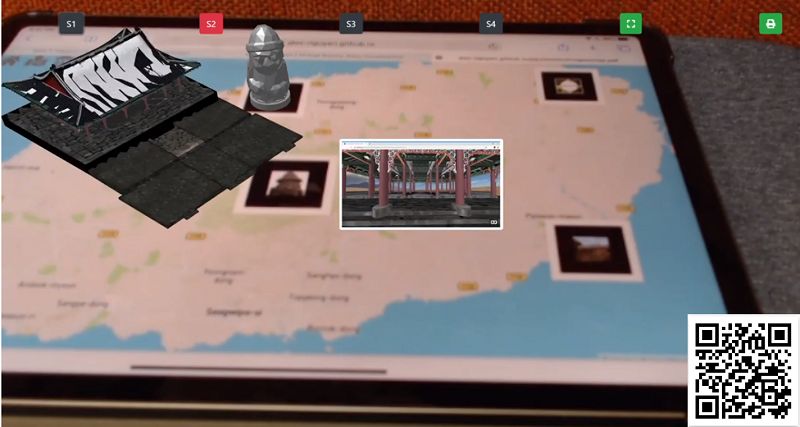
ISPRS Int. J. Geo-Inf. 2020, 9, 367                                                                 3 of 17

VR/AR system architecture in detail. Section 5 evaluates the JejuView application using the technology
acceptance model. Some challenging problems and research implications are discussed in Section 6.
We conclude our work in Section 7.

3. Related Work
      The convenience of using VR/AR technology for heritage locations has been the focus of several
studies. The feasibility of AR adoption was conducted in a study by Chung et al. [7], where visitor
intention was measured in terms of technology readiness (TR), visual appeal, facilitating conditions,
perceived usefulness, perceived ease-of-use, AR attitude, AR usage intention, and intention to visit the
destination. Among these variables, only technology readiness, visual factors of AR, and situational
factors influence visitors to actively utilize AR. The findings showed that perceived usefulness and
ease of use had an impact on the participants’ intention to use AR and to visit the site. An expensive
approach that relies on dedicated AR devices was conducted in References [8,9], where an ancient
civilization’s cultural values were brought to life through a mixed virtual reality recreation of Pompeii.
Heritage artifacts (i.e., clothes, body, skin, face) were simulated and animated on the virtual human
actors superimposed on the physical world. Visitors’ experience was enhanced through a series
of indoor and outdoor activities. Specifically, participants in Reference [10] were equipped with a
head-mounted display designed to impose 3D content, images, and audio onto the physical world.
Users walked around a given area and the corresponding content was triggered through Global
Positioning System (GPS) information. A practical work on the usage of AR technology was presented
in the application of ARCHEOGUIDE [11,12], which facilitated visitors’ exploration and experience of
the artifacts based on their interests. ARCHEOGUIDE was installed in a customized electronic device
and functioned as a tour guide. Upon the visitor’s selection of the place of interest, an introduction
for navigation was generated through the website. The AR technology used a position–orientation
tracking component to superimpose on the ancient buildings.
      Han et al. [13] proposed a 3D model visualization system built on AR technology, which allowed
smartphone users to see 3D models of heritage locations by using video footage of real heritage
locations for both indoor and outdoor use. The research used 3D models of actual stone tombs and
dolmens with the aim to render a 3D visualization system of cultural sites based on outdoor AR
technology. The results of the study showed that outdoor augmented reality technology relying
on outdoor GPS, compass, and gyroscope sensor goes beyond the space limitations of existing
methodology for indoor 3D model visualization and enables users to utilize information without
difficulty for both outdoor and indoor cultural sites.
      Jung et al. [14,15] recently analyzed the application of AR technology for heritage conservation
through the software PalmitoAR, which reenacts a crucial battlefield in the American Civil War,
in Palmito Ranch, Cameron County, Texas. The data collected from 26 users and an algorithm for AR
markers recognition that enabled specific contextual and temporal positioning of 3D models, enabled
PalmitoAR to render a series of historical battles with the help of embedded markers on a printed
map, a mobile device with a WebGL supported browser, and an AR library for future developments of
the application. The results pointed out the positive influence of visual design on the task technology,
which in turn had a positive impact on perceived ease of use, and the latter positively affected the
intention of use and perceived usefulness of the application.
      In terms of VR experience, Jung et al. [16] showed that participants had a positive attitude towards
a tourist visit based on virtual reality technology. The study was conducted with 35 participants who
took a VR tour in the Lake District of England. A more comprehensive study through the lens of VR
on the tourism sector was conducted by Guttentag [17]. The study showed that VR could successfully
be used as a substitution for a real visit due to its benefits such as reduced cost, no language barriers,
bureaucracy, or the need to wait for or change transportation, and a safer ride, regardless of the weather
conditions. Although the advantages overcame the issues encountered, the acceptance of substitutes
was determined by the visitors’ attitude toward authenticity, motivations, and constraints.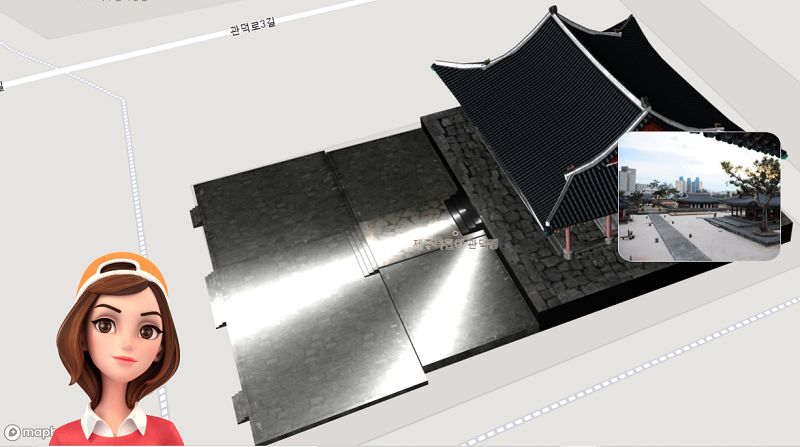
ISPRS Int. J. Geo-Inf. 2020, 9, 367                                                                 4 of 17

     Yung and Catheryn [18] synthesized 46 literature studies on the use of VR/AR in tourism.
Their study showed that if the proposed technology could not be used by potential customers, positive
results could be inappreciable. Furthermore, the lack of theory-based research in VR/AR posed a
limitation to existing work.
     Overall, the review of previous studies showed a positive attitude of visitors toward the adoption
of VR/AR technology. Many applications were made specifically for VR, AR, or a combination of both.
However, the most feasible approaches were dependent on the presence of visitors. Our work differs
from existing studies in that we primarily target remote tourists.

4. Methods

4.1. System Design
      In this section, we describe the methodology and process of developing the VR/AR application
in detail and we encourage readers to refer to the video demo of the VR/AR application available on
YouTube [19].
      JejuView was developed using JavaScript libraries, particularly ThreeJS [20]—a library for
generating and displaying animated 3D contents in a web browser, Mapbox GL JS [21]—a WebGL
JavaScript library used to render interactive maps, A-Frame [22]—a web framework for building
VR experiences through a component, and AR.js [23]-an open-source library built on top of the
ARToolkit and integrated with A-Frame. Unlike other studies that created VR/AR applications for
dedicated devices (e.g., Microsoft Hololens, Oculus Rift, HTC Vive, Google Glasses), we intended
to make the VR/AR experience available to a more diversified public by only using a smart device
(e.g., smartphone, tablet with built-in WebGL support). Our approach not only accommodates a variety
of devices but is also affordable. The use of web-based technology to design VR/AR experiences has
been researched extensively in References [24–27].
      The main objective of JejuView is to design a VR/AR application that introduces visitors to an
advanced exploration of heritage locations on Jeju Island. Several considerations were taken into
account when designing JejuView-(1) retrieving information from a heritage location; (2) displaying a
variety of heritage contents such as text, images, video, virtual artifacts; 3) encouraging immersion in a
virtual reality environment; and 4) experiencing a heritage site integrated in the physical world. To meet
these goals, we followed the visual design suggestion by Munzner [28], in which the requirements of
the application were categorized into tasks, and the visual design was carried out to fulfill these tasks.
The proposed VR/AR application addresses the following high-level tasks:

•     Task 1 (T1). Enable visitors to retrieve information about a given heritage site.
•     Task 2 (T2). Support multiple content formats including text, images, virtual artifacts.
•     Task 3 (T3). Support users to access information in various ways such as lip reading, audio
      listening, or text skimming.
•     Task 4 (T4). Enable visitors to be immersed in a given heritage location.
•     Task 5 (T5). Allow visitors to experience heritage places in a mixed reality environment.

   Building on these tasks, we developed JejuView with two main components—(1) a virtual reality
component and (2) an augmented reality component.

4.1.1. The Virtual Reality Component
      The first step of the JejuView VR application was an overview design as illustrated in Figure 1,
where the four main heritage sites are superimposed as thumbnails onto the 3D interactive map.
Each thumbnail is the representation of the most typical artifact at the site. Mapbox GL JS was used
to render the interactive 3D map. Section A allows users to show/hide 2D or 3D content to prevent
occlusion, Section B introduces a virtual assistant that features animated lip syncing onto the spoken
text, and Section C enables the creator to update heritage site information.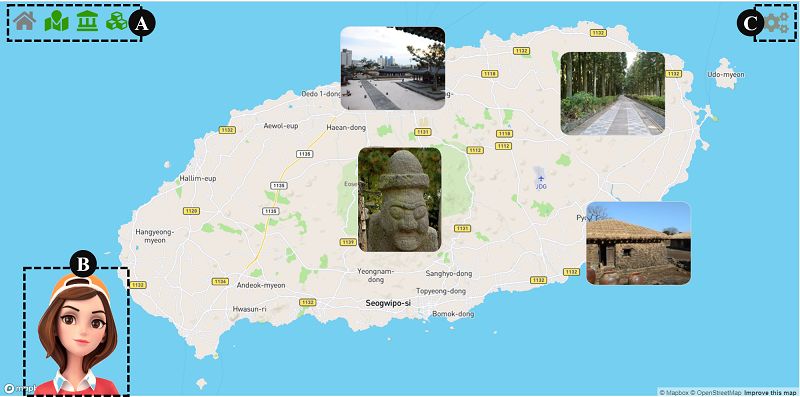
ISPRS Int. J. Geo-Inf. 2020, 9, 367                                                                           5 of 17

      Figure 1. The virtual reality (VR) component—(A) utility section where users can toggle information on
      or off, (B) virtual assistant to support users, (C) configuration section to update heritage information.

      Figure 1 introduces visitors to four destinations: (1) Dol Harubang—Jeju’s stone guardian deity
and cultural symbol; (2) Gwandeokjeong Pavilion—a training ground built during King Sejong’s
reign (1448) as a model of excellence in strengthening the minds and souls of soldiers; (3) Bijarim
Forest—nicknamed the “Forest of a Thousand Years”, a haven for hundreds of bija (nutmeg yew) trees
and the largest forest in the world to be made up of one plant species, also sheltering a 800-year-old,
conjoined nutmeg yew; and (4) Jeju Folk Village—the highlight of the island’s heritage, featuring a
mountain village, a fishing village, a botanical garden, a market place, an old government building,
in addition to a genuine shamanic rite shrine, reflecting the particularities of traditional culture on Jeju
Island in the 19th century.
      Upon selection of the site of interest, information about the heritage shows up on the screen
(Task T1). A short description is provided along with other available content (e.g., video, “See 3D
artifact in VR”, “View 3D artifact in AR” for Task T2), as depicted in Figure 2 when users click on
Gwandeokjeong’s thumbnail.
      In Figure 2, off-site visitors can access information by either reading the description by themselves
or getting the virtual assistant to read the text out loud (by clicking on the sound icon in Figure 2a).
A virtual assistant has been used extensively in many digital advertising campaigns, games, and news
channels to engage user interaction or support people with impairment (i.e., by listening to the
voice or reading lip movement—for Task T3). The virtual assistant (in Figure 1B), named “Rose”,
was retrieved from an open-source repository [29] as an image in graphics interchange format (GIF).
It was customized to align with JejuView, such as removing the white background and scaling.
The audio for reading out text was automatically generated from Web Speech API (text-to-speech).
The duration of the speech, estimated according to the length of the heritage site’s information, was
adjusted to match Rose’s lip movements.
      Figure 3 illustrates a scenario where users can get more information about a given heritage site by
clicking on the zoom icon (Figure 2b). The interactive map takes visitors to the corresponding location.
Available assets (3D model of artifacts, videos, images) will be superimposed on the locations identified
by the creator. In Figure 3, the 3D model of the temple was positioned on its actual place. Users can
rotate, zoom, and pan the interactive map to view the artifact from multiple angles. The model was
created in 3D software (Blender [30] 3D software), then exported as a JSON file, and finally manipulated
in ThreeJS to read and render it.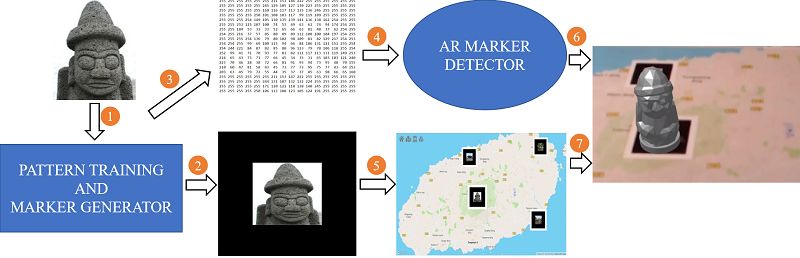
ISPRS Int. J. Geo-Inf. 2020, 9, 367                                                                             6 of 17

      Figure 2. Available information for a given heritage location: (a) read out loud, (b) go to site, (c) watch
      the video, (d) see the artifact in VR, (e) view the artifact in augmented reality (AR).

          Figure 3. The 3D model of the heritage artifact is accurately positioned on the interactive map.

     While the overview design interface facilitates a holistic approach to the application and its
navigation, the detailed view offers information to users, in addition to allowing them to experience
the location. The actual VR begins when visitors want to look inside the artifact. JejuView supports this
ISPRS Int. J. Geo-Inf. 2020, 9, 367 7 of 17
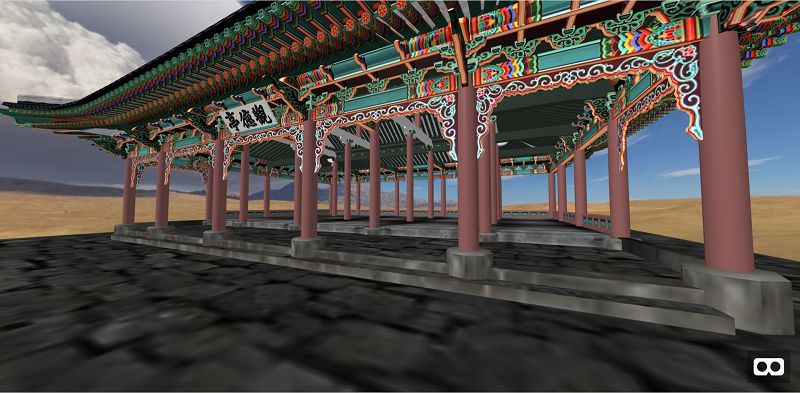
feature by rendering a new scene with the desired artifact. For example, when users click on the VR
icon as in Figure 2d, a new VR environment is generated (as depicted in Figure 4) and visitors are able
to look and move around using a Google Cardboard headset (Task T4).
Figure 4. The VR component allows users to fully engage with the virtual environment and experience
the artifact.
4.1.2. The Augmented Reality Component
Along with the VR feature, the JejuView application is equipped with an AR component that acts
as storytelling platform about Jeju Island (Task T4). The AR component is triggered by following the
AR button in Figure 2e.
Figure 5 shows the main interface of the AR component, which includes six buttons positioned at
the top of the screen (note that the “QR” code located at bottom right is not part of the visual design).
The QR code indicates that users can use their smartphone camera to directly open the link, which is
convenient because users do not have to enter a long URL manually.
Figure 5. The main interface of the AR component.ISPRS Int. J. Geo-Inf. 2020, 9, 367 8 of 17
The “Full Screen” button enables users to display the AR scene in full screen mode. The map
used for triggering 3D content can be downloaded through the “Print Map” button. The “Location
Stage” (denoted as S) 1–4 indicates each heritage location (Tasks T1, T2) which users can play/trigger
individually. For each heritage point, a short description is provided in the caption space at the bottom
of the device’s view port. Normally, once a visualization finishes the next location is automatically
introduced, with a delay time of 3 seconds. By triggering the event of a button, visitors can experience
the corresponding location (Task T1). Available assets or content formats, including images and a
3D model of the artifact, are shown according to the chosen stage. A particular heritage site (stage
button) is activated when the marker associated with that location is found. The button will be
highlighted to indicate the activation and simulation of the current heritage site. Next, we describe
each heritage section:
• Dol Hareubang (S1): “Hello! My name is Dol Hareubang. I am also called Tol Harubang,
or Harubang. I am a large rock statue found on Jeju Island, off the southern tip of South Korea.
I am usually considered to be a god granting both protection and fertility, and placed outside of
gates for protection against demons travelling between worlds. I have become the symbol of Jeju
Island, and replicas of various sizes are sold as tourist souvenirs. Now let me take you to the great
tourist spots of Jeju Island!”
• Gwandeokjeong Pavilion (S2): “Here is one of the oldest standing architectural structures on Jeju
Island. Gwandeokjeong Pavilion was built by Pastor Sin Suk-Cheong as a training ground in the
30th year of King Sejong’s reign (1448). Gwangdeokjeong was designated as a National Treasure
in 1963, for its historic contribution to strengthening the minds and souls of the island’s soldiers.
Today, the pavilion serves as a model of excellence in soldier training.”
• Bijarim Forest (S3): “Bijarim Forest is the ideal spot for a relaxing forest retreat! The dense forest
is home to hundreds of bija (nutmeg yew) trees, and is the largest one-plant-species forest in
the world. Most of the trees in the forest have lived for 500 to 700 years, earning the forest the
nickname “Forest of a Thousand Years”. While taking a stroll through Bijarim Forest, make sure
you visit the 800-year-old conjoined nutmeg yews.”
• Folk Village (S4): “Stretching across 4,500 hectares in Pyoseon-ri, Jeju Folk Village is the island’s
main tourist attraction, where you can explore customs from the old days. At the folk village,
the unique lifestyle and traditional culture of Jeju Island come to life just as they unfolded over
two centuries ago. Take a walk through the mountain village, the fishing village, the botanical
garden, and the marketplace, and further discover the old government quarters and even an
authentic shamanic shrine!”
Each heritage site description was transcribed into audio by a Text-To-Speech (TTS) application
to enhance the user experience. Various methods have been tested to obtain the most natural speech
including Google TTS, iOS, Windows, and IBM TTS. We found that IBM TTS gave the best output in
terms of human-like voice. The audio segments are played inline for each heritage location.
Our application used a marker-based approach to position the Harubang on the printed map.
This method adds an easily detectable image to the system. Once the image was identified, we extracted
its location and superimposed the 3D artifact on it. Figure 6 illustrates the steps required to construct
the pattern and generate a marker. First, a representative image of a certain heritage site was chosen
and fed into the marker training/generator [31]. The generator component provides two outputs: the
marker (Figure 6(2)) and the pattern associated with it (Figure 6(3)). The marker was embedded from
the directory into the printed map (Figure 6(5)), whereas the pattern was used as an input for the AR
pattern/marker detector (Figure 6(4)). Once the marker (Figure 6(7)) was matched with its pattern
(Figure 6(6)), the location was extracted and used to display the 3D artifacts.ISPRS Int. J. Geo-Inf. 2020, 9, 367 9 of 17
Figure 6. The printed map-making process: (1) representative image of a heritage site, (2) generated
marker with augmented region, (3) marker pattern extraction, (4) AR pattern detector, (5) marker
inserted into the map, (6) detector marker position, and (7) superimposed artifact on the printed map.
4.2. Evaluation
The technology acceptance model (TAM) introduced by Davis [32] for assessing an individual’s
acceptance of information technology provided the theoretical instrument to test the JejuView
application, as it has proven useful in both explaining certain aspects of information technologies
and offering insight into the customer attitude toward using these technologies. Previous research
has empirically validated the use of TAM in different fields from mobile technology [33], virtual
communities [34] and the virtual world [35] to healthcare [36] and the consumer decision-making
process [37]. Davis identified the initial two main measures used in TAM as “perceived usefulness”,
which refers to “the degree to which a person believes that using a particular system would enhance
his or her job performance”, and “perceived ease-of-use”, which explains the degree to which an
individual believes that “using a particular system would be free from effort” [38]. Research on the
TAM model has steadily expanded over the years, with special attention given to evaluating the
durability and effectiveness of survey questionnaires.
In addition, we considered the task-technology fit model (TTFM) [39], which matches the
TAM framework in that task-technology will impact the performance outcome. Specifically, task
requirements are matched with information technology features and support. This approach is
reinforced by Dishaw and Strong [40], who broadened the TAM paradigm with TTFM constructs and
suggested that the task-technology fit framework influences the perceived ease-of-use. The resulting
composite model has since been applied in various research [41–43]. Visual design (or visual appeal)
is a crucial factor in designing an application because it increases consumer trust and loyalty [44].
For example, Hartmann et al. [45] argued that “beauty matters and it influences decisions that should
be independent of aesthetics.” Consequently, consideration for visual design has been embraced in
many domains, as in the case of Verhagen et al.’s [46] study, which supports the premise that visual
attractiveness has a positive impact on perceived usefulness.
4.3. Data Collection and Analysis
The research model in Figure 7 integrates the hypotheses into a schema of causal relationships
and provides the onset for our study. We measured the constructs (latent variables) specified in the
oval boxes with a set of items, and the arrows represent the eight hypotheses.
We conducted an online survey using Amazon Mechanical Turk (MTurk) panel with 251
participants in order to test the hypotheses. Respondents received a questionnaire consisting of
a YouTube video link and 25 question items, of which 22 questions about user behavior and three
questions about demographic information. The survey first covered questions about personal attitude
and behavioral intention of using JejuView, which were assessed with a 5-point Likert scale ([1] strongly
disagree, [2] disagree, [3] neutral, [4] agree, [5] strongly agree). The second part required participants
to provide general demographic information such as gender, ethnicity, and English as a first language.ISPRS Int. J. Geo-Inf. 2020, 9, 367 10 of 17
The six constructs used to develop the questionnaires were perceived visual design (VD) (adapted from
Reference [46]), perceived task-technology fit (TTF) [43], perceived usefulness (PU) [38], perceived
ease-of-use (PEU) [38], intention to use (ITU) [38], and intention to visit (ITV) [38]. Table 1 presents a
list of the items used to measure each construct.
Figure 7. Conceptual research model [32]. Oval boxes indicate the constructs and the arrows show the
hypotheses [1–8].
Table 1. Construct and items.
Construct Source
Perceived Visual Design [46]
(VD1) The visual design of the application is appealing.
(VD2) The size of the 3D virtual objects is adequate.
(VD3) The layout structure is appropriate.
Perceived Task Technology Fit [43]
(TTF1) The application is adequate for the described scenario of “Jeju Cultural Tour.”
(TTF2) The application is compatible with the task of controlling virtual objects.
(TTF3) The application fits the task (i.e., experiencing and learning the culture of Jeju) well.
Perceived Usefulness [38]
(PU1) Using this application would improve my understanding of Jeju Island.
(PU2) Using this application, I would accomplish tasks (e.g., learning cultural knowledge) more quickly.
(PU3) Using this application would increase my interest in cultural events.
(PU4) Using this application would enhance my effectiveness on the task (i.e., learning cultural knowledge).
Perceived Ease-Of-Use [38]
(PEU1) Learning to use the VR/AR application would be easy for me.
(PEU2) I would find it easy to get the VR/AR application to do what I want it to do.
(PEU3) My interaction with the VR/AR application would be clear and coherent.
(PEU4) I would find the VR/AR application to be flexible to interact with.
(PEU5) It would be easy for me to become skillful at using the VR/AR application.
(PEU6) I would find the VR/AR application easy to use.
Intention to Use [38]
(ITU1) I intend to use the VR/AR application in the near future.
(ITU2) I intend to check the availability of the VR/AR application in the near future.
Intention to Visit [38]
(ITV1) I will visit Jeju Island after experiencing the VR/AR application.
(ITV2) I intend to visit Jeju Island frequently after experiencing the VR/AR application.
(ITV3) I will continue to visit Jeju Island in the future after experiencing the VR/AR application.
(ITV4) I want to recommend Jeju Island to others after experiencing the VR/AR application.
Out of the 255 subjects who received the questionnaires, 251 participants yielded data usable
responses. The classification and proportion of participants in each category are rendered in Table 2.
57.2% of the participants were male and 42.4% were female. A majority of the participants reportedISPRS Int. J. Geo-Inf. 2020, 9, 367 11 of 17
English as a first language (81.3%) and 18.3% were not. A majority of the participants was Caucasian
(45.8%), 36.3% were Asian, 10.4% were African-American, 2.4% were Hispanic, 2.4% were American
Indian/Alaska Native, and 2.8% reported “other” ethnicity.
In order to test the hypotheses, we used a web-based software for generalized structured
component analysis (GSCA) [47]. Generalized structured component analysis [48,49] is an approach to
component-based structure equation modeling (SEM) that works well with a small sample size and
avoids rigid distributional assumptions (e.g., multivariate normality assumption) [50,51].
Table 2. Demographic information.
Variable Frequency Percentage
Gender Male 143 57.2
Female 106 42.4
Did not say 1 0.4
English as first language Yes 204 81.3
No 46 18.3
Did not say 1 0.4
Ethnic heritage Caucasian/White 115 45.8
Asian 91 36.3
African American/Black 26 10.4
Hispanic/Latino 6 2.4
American Indian or Alaska Native 6 2.4
Other 7 2.8
Total 251 100
5. Results
The individual items and descriptive statistics for the six constructs are shown in Table 3.
All means are above the midpoint of 3, and the standard deviations range from 0.91 to 1.33. Cronbach’s
alpha coefficients [52] in Table 4 demonstrated reasonable internal consistency of the measures,
ranging from 0.776 to 0.927, thereby exceeding the reliability estimates (α = 0.70) recommended
by Nunnally [53].
Table 3. Means and standard deviations of technology acceptance model measures (N = 251).
Construct Item Mean SD
Perceived Task Technology Fit TTF1 4.10 0.91
TTF2 3.74 1.10
TTF3 4.15 0.94
Perceived Visual Design VD1 3.70 1.16
VD2 3.82 1.05
VD3 3.96 1.02
Perceived Usefulness PU1 4.15 0.99
PU2 4.01 0.94
PU3 3.96 1.00
PU4 4.03 0.98
Perceived Ease-of-Use PEU1 3.92 0.96
PEU2 3.83 1.02
PEU3 3.79 0.97
PEU4 3.80 0.94
PEU5 3.90 0.96
PEU6 3.89 0.99
Intention to Use ITU1 3.63 1.08
ITU2 3.62 1.07ISPRS Int. J. Geo-Inf. 2020, 9, 367 12 of 17
Table 3. Cont.
Construct Item Mean SD
Intention to Visit ITV1 3.29 1.24
ITV2 3.24 1.33
ITV3 3.26 1.25
ITV4 3.58 1.22
Table 4. Coefficient alpha.
Construct Item Alpha
Perceived Task Technology Fit (TTF) 3 0.776
Perceived Visual Design (VD) 3 0.821
Perceived Usefulness (PU) 5 0.890
Perceived Ease-Of-Use (PEU) 5 0.921
Intention To Use (ITU) 2 0.860
Intention To Visit (ITV) 4 0.927
The hypothesized model provided FIT (overall goodness of fit index in GSCA) value of 0.669,
indicating that the model accounted for 66.9% of the total variance of the six constructs and their items.
Table 5 presents the loading estimates for the items along with their standard errors (SEs) and 95%
bootstrap percentile confidence intervals (CIs) with the lower bounds (LB) and the upper bounds
(UB), calculated from 100 bootstrap samples. Here, a parameter estimate is assumed to be statistically
significant at 0.05 alpha level if the CI does not include the value of zero. All the loading estimates
were statistically significant, indicating that all those items were good indicators of the constructs.
Table 5. Estimates of loadings.
Estimate SE 95% CI_LB 95% CI_UB
TTF1 0.872 0.021 0.820 0.906
TTF2 0.754 0.047 0.664 0.830
TTF3 0.864 0.023 0.815 0.908
VD1 0.863 0.018 0.825 0.897
VD2 0.845 0.025 0.783 0.888
VD3 0.861 0.028 0.794 0.905
PU1 0.824 0.028 0.761 0.883
PU2 0.890 0.018 0.849 0.919
PU3 0.880 0.021 0.835 0.917
PU4 0.873 0.025 0.817 0.913
PEU1 0.831 0.030 0.768 0.890
PEU2 0.853 0.022 0.813 0.892
PEU3 0.860 0.021 0.819 0.901
PEU4 0.802 0.027 0.746 0.850
PEU5 0.869 0.018 0.831 0.903
PEU6 0.867 0.016 0.828 0.894
ITU1 0.942 0.010 0.917 0.958
ITU2 0.934 0.011 0.913 0.956
ITV1 0.931 0.009 0.911 0.946
ITV2 0.913 0.012 0.884 0.931
ITV3 0.923 0.009 0.905 0.940
ITV4 0.857 0.022 0.801 0.891
The structural model with path coefficients is depicted in Figure 8. Table 6 provides the
estimates of path coefficients along with their standard errors and 95% confidence intervals. Results
showed that Visual Design had statistically significant and positive influences on Task TechnologyISPRS Int. J. Geo-Inf. 2020, 9, 367 13 of 17
Fit (H1 = 0.663, SE = 0.040, 95% CI = 0.591–0.741) and Perceived Usefulness (H2 = 0.485, SE = 0.051,
95% CI = 0.422–0.619). Task Technology Fit had a statistically significant and positive influence on
Perceived Ease-of-Use (H3 = 0.592, SE = 0.059, 95% CI = 0.457–0.687). In turn, Perceived Ease-of-Use
had statistically significant and positive effects on Perceived Usefulness (H4 = 0.422, SE = 0.062, 95%
CI = 0.275–0.520), Intention to Use (H6 = 0.461, SE = 0.098, 95% CI = 0.310–0.675), and Intention to Visit
(H8 = 0.339, SE = 0.096, 95% CI = 0.178–0.552). However, hypotheses H5 (Perceived Usefulness →
Intention to Use) and H7 (Perceived Usefulness → Intention to Visit) were not supported.
Figure 8. Research model with path coefficients.
Table 6. Estimates of path coefficients.
Estimates SE 95% CI_LB 95% CI_UB
VD → TTF 0.663 * 0.040 0.591 0.741
VD → PU 0.485 * 0.051 0.422 0.619
TTF → PEU 0.592 * 0.059 0.457 0.687
PEU → PU 0.422 * 0.062 0.275 0.520
PU → ITU 0.229 0.110 −0.003 0.405
PEU → ITU 0.461 * 0.098 0.310 0.675
PU → ITV 0.158 0.113 −0.088 0.368
PEU → ITV 0.339 * 0.096 0.178 0.552
6. Discussion
Our findings are in line with prior research by van der Heijden, who argued that “perceived
usefulness loses its dominant predictive value in favor of ease-of-use and enjoyment” [54]. Our findings
are also in line with the previous studies in various domains such as VR gaming production [55],
VR museum design [56], AR educational method development [57], and VR tourism design [58].
Specifically, utilitarian information systems are focused on task performance and efficiency and are
intended for productive use, while hedonic information systems offer enjoyment to the user through
animated, multi-media-enabled content that delivers an aesthetically appealing visual experience.
Therefore, the main design objective of hedonic information systems is to encourage long-term use of
the system. However, the decisive impact of ease-of-use rather than perceived usefulness on system
usage is particularly valid for hedonic information systems.
The perceived convenience of using a VR/AR system lowers a user’s access barrier in using
the VR/AR and encourages a user to use the system repeatedly. Recently, Kim and Hall [58]
extended the Hedonic Motivation System Adoption Model (HMSAM) to emphasize the importance
of perceived ease-of-use in a VR system design in the repeated use of a VR tourism app for travelers.
Specifically, in their study, the continued use was greatly influenced by the user’s flow state and
subjective well-being.ISPRS Int. J. Geo-Inf. 2020, 9, 367 14 of 17
During the development of the Jeju VR/AR application, we encountered several technical issues
that should be tackled in future research. First, it is a challenging task to create 3D models for different
artifacts since it requires expertise in graphic design. We tried to look for free models on the Internet to
alleviate this technical issue. Unfortunately, our search was not successful. Thus, we had to design
and generate 3D content manually. Future collaboration with computer graphics specialists would be
warranted to address this issue in creating 3D artifacts dedicated to Jeju Island.
Second, our 3D models had the same level of detail used in both the AR and VR environments.
For the AR application, users may need to see only an overview of the 3D models without exploring
them in detail. On the other hand, a more thorough investigation of the 3D artifacts would be required
for user immersion in the virtual world. Thus the level of detail should be taken into account, balancing
trade-offs in 3D model design (e.g., fidelity and performance).
Third, selecting a representative image to be used as a marker requires time-consuming, trial-and-
error effort. The markers might be easy to detect if they contained distinct features. In some other
AR applications, default marker images such as hiro, kanji, or Arabic letters are often used. However,
putting these markers on the Jeju map would lose the context for each location, where the marker itself
is the representation of that location. Thus, the selected image had to undergo manipulation such as
removing noise, contrast, or even adding a feature. To mitigate this issue, future work could be carried
out by incorporating machine learning techniques to exploit more features on the existing images,
thus enhancing the detection mechanism of our application. Furthermore, the machine learning
techniques would also allow us to create transparency for the markers, meaning that the markers
would not be visually presented on the map. Rather, they would be parts of the map.
7. Conclusions
In this study we developed the VR/AR application JejuView and used the Technology Acceptance
Model to evaluate its effectiveness to advertise the cultural heritage of Jeju Island to potential overseas
visitors. Following the assessment of 251 online participants, Visual Design had a statistically significant
positive effects on Task Technology Fit and Perceived Usefulness. Besides, Task Technology Fit
prompted a positive effect on Perceived Ease-of-Use. Furthermore, Perceived Ease-of-Use showed a
positive effect on Intention to Use and Intention to Visit. However, there was no significant impact
of Perceived Usefulness on either Intention to Use or Intention to Visit. Therefore, it can be said that
when using immersive media such as VR/AR, consumers are more focused on the hedonic value than
the utilitarian value (i.e., usefulness) of the medium.
The primary purpose of this study was to test a new type of tourism promotion VR/AR application
using the TAM. We look forward to conducting usability focused research on future developments
of the VR/AR application proposed in this paper in a more elaborated and commercialized form.
For example, if studies are conducted on the effectiveness for tourists and the cost-effectiveness of
VR/AR applications compared to traditional media forms (e.g., TV or mobile advertising), we can
make the results of this study more practical.
We believe that our VR/AR application’s user demographic information and previous experience
with immersive new media might have had a complex influence on the user’s psychological/behavioral
responses. In future studies, it would make sense to complement research not just on the users’
demographic information, but also on their psychological motivation. For example, if additional
variables such as users’ involvement in tourist attractions, cultural interest in the country they plan
to visit and tourist innovativeness will be further researched, we believe this study could provide
more meaningful results. Specifically, many visitors to Korea are looking for tourist attractions such
as Jeju Island due to their interest in Korean Culture (K-Culture or Hallyu) represented through
K-pop, K-drama, film, and traditional culture. We believe it will be an excellent future research
task to explore how the interest of potential overseas tourists in Hallyu affects their use of tourism
VR/AR applications.ISPRS Int. J. Geo-Inf. 2020, 9, 367 15 of 17
We expect that future VR/AR applications will be more technologically advanced and actively
deployed for cultural education and tourism marketing. Moreover, going beyond technological
development, if deep understanding of the users’ psychological acceptance of technology is added,
VR/AR could grow into a more effective communication tool.
Author Contributions: Conceptualization, Seung-Chul Yoo, Vinh T. Nguyen, and Kwanghee Jung; data curation,
Seung-Chul Yoo, Vinh T. Nguyen, and Kwanghee Jung; formal analysis, Kwanghee Jung and Vinh T. Nguyen;
funding acquisition, Seung-Chul Yoo; investigation, Seung-Chul Yoo, Vinh T. Nguyen, and Kwanghee Jung;
methodology, Seung-Chul Yoo, Vinh T. Nguyen, and Kwanghee Jung; project administration, Seung-Chul Yoo and
Kwanghee Jung; resources, Seung-Chul Yoo, Vinh T. Nguyen, and Kwanghee Jung; software, Vinh T. Nguyen and
Kwanghee Jung; supervision, Seung-Chul Yoo and Kwanghee Jung; validation, Seung-Chul Yoo, Vinh T. Nguyen,
and Kwanghee Jung; visualization, Kwanghee Jung and Vinh T. Nguyen; writing—original draft, Seung-Chul Yoo,
Vinh T. Nguyen, Diana Piscarac, and Kwanghee Jung; writing—review and editing, Seung-Chul Yoo,
Vinh T. Nguyen, Diana Piscarac, and Kwanghee Jung. All authors have read and agreed to the published
version of the manuscript.
Funding: This research received no external funding.
Conflicts of Interest: The authors declare no conflict of interest.
References
1. Saorin, J.L.; Carbonell-Carrera, C.; de la Torre CANTERO, J.; Meier, C.; Aleman, D.D. Three-Dimensional
Interpretation of Sculptural Heritage with Digital and Tangible 3D Printed Replicas. Turk. Online J. Educ.
Technol. TOJET 2017, 16, 161–169.
2. Gössling, S.; Scott, D.; Hall, C.M. Pandemics, tourism and global change: A rapid assessment of COVID-19.
J. Sustain. Tour. 2020, 1–20. [CrossRef]
3. Berg, L.P.; Vance, J.M. Industry use of virtual reality in product design and manufacturing: A survey.
Virtual Real. 2017, 21, 1–17. [CrossRef]
4. Schall, G.; Zollmann, S.; Reitmayr, G. Smart Vidente: Advances in mobile augmented reality for interactive
visualization of underground infrastructure. Pers. Ubiquitous Comput. 2013, 17, 1533–1549. [CrossRef]
5. Du, J.; Zou, Z.; Shi, Y.; Zhao, D. Zero latency: Real-time synchronization of BIM data in virtual reality for
collaborative decision-making. Autom. Constr. 2018, 85, 51–64. [CrossRef]
6. Nguyen, V.T.; Jung, K.; Dang, T. Creating Virtual Reality and Augmented Reality Development in
Classroom: Is it a Hype? In Proceedings of the 2019 IEEE International Conference on Artificial Intelligence
and Virtual Reality (AIVR), San Diego, CA, USA, 9–11 December 2019; pp. 212–2125.
7. Chung, N.; Han, H.; Joun, Y. Tourists’ intention to visit a destination: The role of augmented reality (AR)
application for a heritage site. Comput. Hum. Behav. 2015, 50, 588–599. [CrossRef]
8. Magnenat-Thalmann, N.; Papagiannakis, G. Virtual worlds and augmented reality in cultural heritage
applications. In Recording, Modeling and Visualization of Cultural Heritage, Centro Stefano Franscini, Monte
Verita, Ascona, Switzerland, 22–27 May 2005; CRC Press: Boca Raton, FL, USA, 2005; pp. 419–430.
9. Papagiannakis, G.; Schertenleib, S.; O’Kennedy, B.; Arevalo-Poizat, M.; Magnenat-Thalmann, N.;
Stoddart, A.; Thalmann, D. Mixing virtual and real scenes in the site of ancient Pompeii. Comput. Anim.
Virtual Worlds 2005, 16, 11–24. [CrossRef]
10. Hollerer, T.; Feiner, S.; Pavlik, J. Situated documentaries: Embedding multimedia presentations in the real
world. In Proceedings of the Third International Symposium on Wearable Computers, San Francisco, CA,
USA, 18–19 October 1999; pp. 79–86. [CrossRef]
11. Stricker, D.; D`‘ahne, P.; Seibert, F.; Christou, I.; Almeida, L.; Carlucci, R.; Ioannidis, N. Design and
development issues for archeoguide: An augmented reality based cultural heritage on-site guide.
In Proceedings of the International Conference Augmented Virtual Environments and 3D Imaging,
Mykonos, Greece, 30 May–1 June 2001; pp. 1–5.
12. Vlahakis, V.; Karigiannis, J.; Tsotros, M.; Gounaris, M.; Almeida, L.; Stricker, D.; Gleue, T.; Christou, I.T.;
Carlucci, R.; Ioannidis, N. Archeoguide: First results of an augmented reality, mobile computing system in
cultural heritage sites. In Proceedings of the 2001 Conference on Virtual Reality, Archeology, and Cultural
Heritage, Glyfada, Greece, 28–30 November 2001; Volume 9.
13. Han, J.G.; Park, K.W.; Ban, K.J.; Kim, E.K. Cultural heritage sites visualization system based on outdoor
augmented reality. AASRI Procedia 2013, 4, 64–71. [CrossRef]ISPRS Int. J. Geo-Inf. 2020, 9, 367 16 of 17
14. Jung, K.; Nguyen, V.T.; Yoo, S.C.; Kim, S.; Park, S.; Currie, M. PalmitoAR: The Last Battle of the US Civil
War Reenacted Using Augmented Reality. ISPRS Int. J. Geo-Inf. 2020, 9, 75. [CrossRef]
15. Nguyen, V.T.; Jung, K.; Yoo, S.; Kim, S.; Park, S.; Currie, M. Civil War Battlefield Experience: Historical
Event Simulation using Augmented Reality Technology. In Proceedings of the 2019 IEEE International
Conference on Artificial Intelligence and Virtual Reality (AIVR), San Diego, CA, USA, 9–11 December 2019;
pp. 294–2943.
16. Jung, T.; tom Dieck, M.C.; Moorhouse, N.; tom Dieck, D. Tourists’ experience of Virtual Reality
applications. In Proceedings of the 2017 IEEE International Conference on Consumer Electronics (ICCE),
Las Vegas, NV, USA, 8–10 January 2017; pp. 208–210. [CrossRef]
17. Guttentag, D.A. Virtual reality: Applications and implications for tourism. Tour. Manag. 2010, 31, 637–651.
[CrossRef]
18. Yung, R.; Khoo-Lattimore, C. New realities: A systematic literature review on virtual reality and augmented
reality in tourism research. Curr. Issues Tour. 2019, 22, 2056–2081. [CrossRef]
19. Nguyen, V. Augmented Reality for Jeju Island Tourism. 2019. Available online: https://www.youtube.
com/watch?v=Dqm2acWbvHM (accessed on 21 February 2020).
20. Danchilla, B. Three.js framework. In Beginning WebGL for HTML5; Apress: Berkeley, CA, USA, 2012;
pp. 173–203.
21. Mapbox. Mapbox GL JS. 2019. Available online: https://docs.mapbox.com/mapbox-gl-js/api/ (accessed on
21 February 2020).
22. Mozilla. A Web Framework for Building Virtual Reality Experiences. 2019. Available online: https://aframe.io
(accessed on 23 January 2020).
23. Etienne, J. Creating Augmented Reality with AR.js and A-Frame. 2019. Available online: https://aframe.
io/blog/arjs (accessed on 23 January 2020).
24. T. Nguyen, V.; Hite, R.; Dang, T. Web-Based Virtual Reality Development in Classroom: From Learner’s
Perspectives. In Proceedings of the 2018 IEEE International Conference on Artificial Intelligence and
Virtual Reality (AIVR), Taichung, Taiwan, 10–12 December 2018; pp. 11–18. [CrossRef]
25. Nguyen, V.T.; Hite, R.; Dang, T. Learners’ Technological Acceptance of VR Content Development:
A Sequential 3-Part Use Case Study of Diverse Post-Secondary Students. Int. J. Semant. Comput. 2019,
13, 343–366, doi:10.1142/S1793351X19400154. [CrossRef]
26. Nguyen, V.T.; Zhang, Y.; Jung, K.; Xing, W.; Dang, T. VRASP: A Virtual Reality Environment for Learning
Answer Set Programming. In International Symposium on Practical Aspects of Declarative Languages, Springer:
Basel, Switzerland, 2020; pp. 82–91.
27. Nguyen, V.T.; Jung, K.; Dang, T. DroneVR: A Web Virtual Reality Simulator for Drone Operator.
In Proceedings of the 2019 IEEE International Conference on Artificial Intelligence and Virtual Reality
(AIVR), San Diego, CA, USA, 9–11 December 2019; pp. 257–2575.
28. Munzner, T. Visualization Analysis and Design; CRC Press: Boca Raton, FL, USA, 2014.
29. Talkr. Make My Pictures Talk. 2020. Available online: https://github.com/talkr-app/gif-talkr (accessed on
21 February 2020).
30. Blender. Blender, Made by You. 2019. Available online: https://www.blender.org (accessed on
10 October 2019).
31. Jeromeetienne. AR.js Marker Training. 2019. Available online: https://jeromeetienne.github.io/AR.js/
three.js/examples/marker-training/examples/generator.html (accessed on 22 February 2020).
32. Davis, F.D. A Technology Acceptance Model for Empirically Testing New End-User Information Systems:
Theory and Results. Ph.D. Thesis, Massachusetts Institute of Technology, Cambridge, MA, USA, 1985.
33. Abou-Shouk, M.; Megicks, P.; Lim, W.M. Perceived benefits and e-commerce adoption by SME travel
agents in developing countries: Evidence from Egypt. J. Hosp. Tour. Res. 2013, 37, 490–515. [CrossRef]
34. Casaló, L.V.; Flavián, C.; Guinalíu, M. Determinants of the intention to participate in firm-hosted online
travel communities and effects on consumer behavioral intentions. Tour. Manag. 2010, 31, 898–911.
[CrossRef]
35. Holsapple, C.W.; Wu, J. User acceptance of virtual worlds: The hedonic framework. ACM SIGMIS Database
DATABASE Adv. Inf. Syst. 2007, 38, 86–89. [CrossRef]
36. Rahimi, B.; Nadri, H.; Afshar, H.L.; Timpka, T. A systematic review of the technology acceptance model in
health informatics. Appl. Clin. Inform. 2018, 9, 604–634. [CrossRef]ISPRS Int. J. Geo-Inf. 2020, 9, 367 17 of 17
37. Kim, D.Y.; Park, J.; Morrison, A.M. A model of traveller acceptance of mobile technology. Int. J. Tour. Res.
2008, 10, 393–407. [CrossRef]
38. Davis, F.D. Perceived usefulness, perceived ease of use, and user acceptance of information technology.
MIS Q. 1989, 13, 319–340. [CrossRef]
39. Goodhue, D.L.; Thompson, R.L. Task-technology fit and individual performance. MIS Q. 1995, 19, 213–236.
[CrossRef]
40. Dishaw, M.T.; Strong, D.M. Extending the technology acceptance model with task–technology fit constructs.
Inf. Manag. 1999, 36, 9–21. [CrossRef]
41. Basoglu, N.; Cayir, S. Users and information technology interoperability: Analysis of task information
fit model. In Proceedings of the PICMET’09-2009 Portland International Conference on Management of
Engineering & Technology, Portland, OR, USA, 2–6 August 2009; pp. 3144–3153.
42. Wu, B.; Chen, X. Continuance intention to use MOOCs: Integrating the technology acceptance model
(TAM) and task technology fit (TTF) model. Comput. Hum. Behav. 2017, 67, 221–232. [CrossRef]
43. Becker, D. Acceptance of mobile mental health treatment applications. Procedia Comput. Sci. 2016,
98, 220–227. [CrossRef]
44. Li, Y.M.; Yeh, Y.S. Increasing trust in mobile commerce through design aesthetics. Comput. Hum. Behav.
2010, 26, 673–684. [CrossRef]
45. Hartmann, J.; Sutcliffe, A.; Angeli, A.D. Towards a theory of user judgment of aesthetics and user interface
quality. ACM Trans. Comput.-Hum. Interact. (TOCHI) 2008, 15, 15. [CrossRef]
46. Verhagen, T.; Feldberg, F.; van den Hooff, B.; Meents, S.; Merikivi, J. Understanding users’ motivations
to engage in virtual worlds: A multipurpose model and empirical testing. Comput. Hum. Behav. 2012,
28, 484–495. [CrossRef]
47. Hwang, H.; Jung, K.; Kim, S. WEB GESCA. 2019. Available online: http://sem-gesca.com/webgesca
(accessed on 22 April 2020).
48. Hwang, H.; Takane, Y. Generalized Structured Component Analysis: A Component-Based Approach to Structural
Equation Modeling; Chapman and Hall/CRC: Boca Raton, FL, USA, 2014.
49. Hwang, H.; Takane, Y.; Jung, K. Generalized structured component analysis with uniqueness terms for
accommodating measurement error. Front. Psychol. 2017, 8, 2137. [CrossRef]
50. Jung, K.; Panko, P.; Lee, J.; Hwang, H. A comparative study on the performance of GSCA and CSA in
parameter recovery for structural equation models with ordinal observed variables. Front. Psychol. 2018,
9, 2461. [CrossRef]
51. Jung, K.; Lee, J.; Gupta, V.; Cho, G. Comparison of Bootstrap Confidence Interval Methods for GSCA Using
a Monte Carlo Simulation. Front. Psychol. 2019, 10, 2215. [CrossRef]
52. Cronbach, L. Coefficient Alpha and the internal consistency of test. Psychometrika 1951, 16, 297–334.
[CrossRef]
53. Nunnally, J.C. Psychometric Theory 3E; Tata McGraw-Hill Education: New York, NY, USA, 1994.
54. Van der Heijden, H. User acceptance of hedonic information systems. MIS Q. 2004, 28, 695–704. [CrossRef]
55. Yildirim, C. Cybersickness during VR gaming undermines game enjoyment: A mediation model. Displays
2019, 59, 35–43. [CrossRef]
56. Barbieri, L.; Bruno, F.; Muzzupappa, M. User-centered design of a virtual reality exhibit for archaeological
museums. Int. J. Interact. Des. Manuf. (IJIDeM) 2018, 12, 561–571. [CrossRef]
57. Ibáñez, M.B.; Di Serio, Á.; Villarán, D.; Delgado-Kloos, C. Impact of Visuospatial Abilities on Perceived
Enjoyment of Students toward an AR-Simulation System in a Physics Course. In Proceedings of the 2019
IEEE Global Engineering Education Conference (EDUCON), Dubai, UAE, 8–11 April 2019; pp. 995–998.
58. Kim, M.J.; Hall, C.M. A hedonic motivation model in virtual reality tourism: Comparing visitors and
non-visitors. Int. J. Inf. Manag. 2019, 46, 236–249. [CrossRef]
c 2020 by the authors. Licensee MDPI, Basel, Switzerland. This article is an open access
article distributed under the terms and conditions of the Creative Commons Attribution
(CC BY) license (http://creativecommons.org/licenses/by/4.0/).You can also read