Mercia Asset Management PLC - 2022 Interim Results venture private equity debt proprietary capital
←
→
Page content transcription
If your browser does not render page correctly, please read the page content below

Mercia Asset Management PLC
2022 Interim Results

•   venture
•   private equity
•   debt
•   proprietary capital
Important notice

    •   This document contains statements about Mercia Asset Management PLC that are or may be forward-looking statements.
        Forward-looking statements include statements relating to (i) future revenues, expenses, earnings, financial condition and
        future prospects; and (ii) business and management strategies and the expansion and growth of Mercia Asset Management
        PLC’s operations.

    •   These forward-looking statements are not guarantees of future performance. They have not been reviewed by the auditors or
        advisers of Mercia Asset Management PLC. They involve known and unknown risks, uncertainties and other factors which may
        cause the actual results, performance or achievements to be materially different from any results, performance or achievements
        expressed or implied by such statements. They are based on numerous assumptions regarding the present and future business
        strategies and the future operating environment. All subsequent oral or written forward-looking statements attributable to
        Mercia Asset Management PLC or any of its shareholders or any persons acting on its behalf are expressly qualified in their
        entirety by this cautionary statement. All forward-looking statements included in this document speak only as of the date they
        were made and are based on information then available to Mercia Asset Management PLC. Investors should not place undue
        reliance on such forward-looking statements, and Mercia Asset Management PLC does not undertake any obligation to update
        publicly or revise any forward-looking statements.

    •   No representation or warranty, express or implied, is given regarding the accuracy of the information or opinions contained in
        this document and no liability is accepted by Mercia Asset Management PLC or any of its Directors, members, officers,
        employees, agents or advisers for any such information or opinions.

    •   This information is being supplied to you for information purposes only and not for any other purpose. This document and the
        information contained in it does not constitute or form any part of an offer of, or invitation or inducement to apply for, securities.

    •   The distribution of this document in jurisdictions other than the United Kingdom may be restricted by law and persons into whose
        possession this document comes should inform themselves about and observe any such restrictions. Any failure to comply with
        these restrictions may constitute a violation of laws of any such other jurisdiction.

2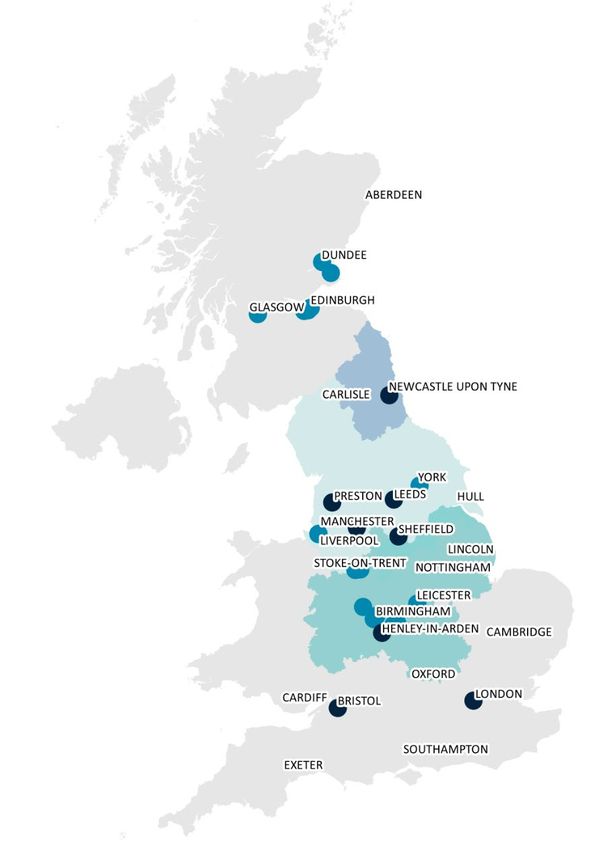
A track record of value creation

           Dr M a r k Payton                  M a r t i n Glanfield                   Julian Viggars
           Chief Executive Officer            Chief Financial Officer               Chief Investment Officer

         Over 20 years’ experience in      Over 20 years’ CFO experience of       Over 20 years’ venture capital
      technology commercialisation and   listed and PE-backed technology-led   experience including Blue Prism IPO
              venture investing                       businesses

            PhD in Life Sciences         Former CFO of Forward Group PLC        Oversees the investment activity of
                                                                               the Group across venture and private
           Co-founder of Mercia          KPMG trained chartered accountant                    equity

        Oxford University Innovation            Oversees debt team                     Chartered accountant

3
Continued growth and value generation
                   Assets under management
                             (AuM)
                                                Financial
                           c.£948m
                      (H1 2021: c.£872m)        •   ↑ 21% revenue* growth to c.£10m
                                                •   ↑ 125% adjusted operating profit* growth to £2.4m
                    Third-party funds under
                      management (FuM)          •   ↑ 35% growth in profit after tax to £11.2m
                           c.£762m
                                                •   Strong balance sheet with c.£52m cash and no debt
      Highlights

                      (H1 2021: c.£722m)        •   2022 interim dividend of 0.3p/share

                                                Strategic
                      Proprietary capital
                             AuM
                                                •   9 profitable exits across FuM
                           c.£186m
                                                •   Fourth most active venture investor in UK and top investor
                      (H1 2021: c.£150m)
                                                    in the Midlands and the North**
                                                •   Team and track record built for organic FuM scale
                   Adjusted operating profit*
                             £2.4m              Responsible investment
                        (H1 2021: £1.1m)
                                                •   Responsible Investment Team with ESG principles
                                                    at its core
                      Total AuM liquidity       •   Mercia is focused on diversity and net zero,
                           c.£284m                  setting the standard for its investees
                      (H1 2021: c.£255m)                                                 * Excluding the impact of performance fees
                                                                                         ** The Deal, Beauhurst (2020)

4
Sustainable, growing and financially strong
      Mercia Asset Management

                                         Find value                        Add value                      Realise value
                                      1,110 enquiries, 74            Centralised resource,              9 profitable exits in
                                     deals completed, 38             9 syndicated deals, 18                  H1 2022
                                            are new               NEDs placed, 137 jobs created
                                     portfolio companies              by regional venture

                                Addressable market                                  Market penetration
                                •   SMEs (micro and small cap)                      •   c.£100m invested per annum or c.5% of
                                •   Predominantly private                               addressable market
                                •   Mercia will invest c.£0.3m to c.£10m
                                •   SMEs with total funding < c.£20m
                                •   Exit enterprise values of c.£20m to c.£200m

5
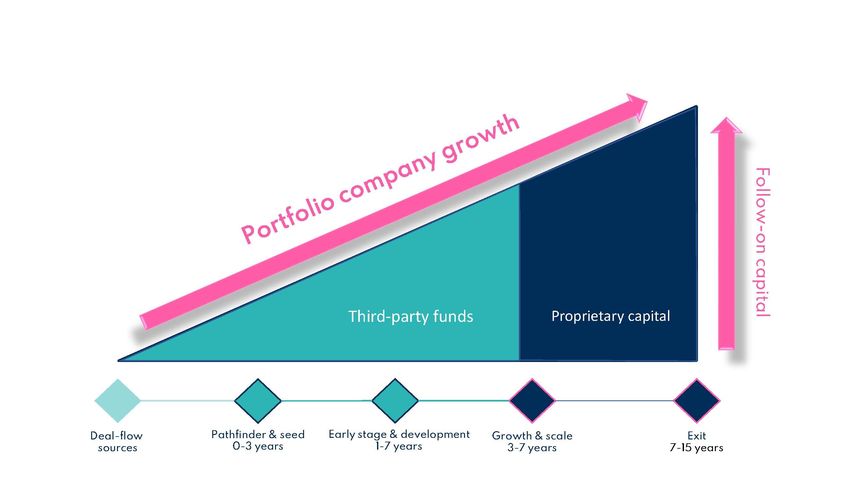
Investment model
    Flexible financing solutions across the capital structure to help companies develop and grow

                                         Venture Capital               Private Equity    Debt      Scale-up
        Complete Connected Capital

                                     •   Our third-party funds seed future
                                         direct investments and underpin our
                                         progressive dividend policy

                                     •   With our proprietary capital we
                                         provide growth capital for companies
                                         from our third-party funds and
                                         selectively invest in our managed
                                         funds

6
Our market
Total venture Our regional
investment coverage • Our offices
across UK • University
partners
• NEVF regions
• MEIF regions
• NPIF regions
• Active secondary,
70%
IPO and trade sale
market for Mercia
investees
Distribution
of high-
growth
businesses
25%
Source: The ScaleUp Institute & Beauhurst (2020), Tech Nation (2020)
7Pillars of Mercia’s 20:20 vision
Grow AuM on average by 20% per annum over the next 3 years
• Organic: c.50% of AuM to date through organic growth
• M&A: two successful acquisitions over 7 years has doubled AuM
Three-year objectives
• Balance sheet portfolio grown at c.14% IRR since IPO
£60m PBT over 3 years, on average £20m per annum
• Proprietary capital:
• Optimal portfolio size of 30
• Move to later-stage investments, co-investing with the Northern VCTs
• 3-7 years typical holding period
• Continue disciplined approach to direct investment portfolio management to achieve target
returns
• Attractive long-term recurring fund management fee income
• Portfolio resource provides value-add capabilities to drive portfolio growth
• Focused on enabling technologies within Life Sciences, Deep Tech, Software and Digital
Entertainment
8Financial review 9
Summarised results

                             • Revenue* increased 20.7% to £10.1m (H1 2021: £8.4m)
                             • Adjusted operating profit* increased 125.0% £2.4m (H1 2021: £1.1m)
     Financial information

                             • Net performance fees £1.6m (H1 2021: £nil)
                             • Profit after tax increased 35.2% £11.2m (H1 2021: £8.2m)
                             • Net assets £186.4m (H1 2021: £149.9m; FY 2021: £176.0m)
                             • Net assets per share 42.4 pence (H1 2021: 34.1 pence; FY 2021: 40.0 pence)
                             • Cash and short-term liquidity investments £52.1m (H1 2021: £24.9m; FY 2021:
                              £54.7m); no debt
                             • Interim dividend 0.3 pence per share, £1.3m (H1 2021: 0.1 pence per share,
                              £0.4m)

                             * Excluding the impact of performance fees

10
AuM movements
AuM AuM
Asset class 1 April 2021 Net fund flows Distributions Performance 30 Sept 2021
£’m £’m £’m £’m £’m
Venture 600 11 (36) 26 601
Private equity 54 - - (1) 53
Debt 110 - (2) - 108
Total FuM 764 11 (38) 25 762
Proprietary
capital 176 - (1) 11 186
Total AuM 940 11 (39) 36 948
• One EIS fund raised in the period and an additional fund allocation by BBB
• Venture, debt and propriety capital distributions to investors
• Performance driven by VCT and direct investment portfolio fair value increases
11Consolidated statement of comprehensive income
For the six months ended 30 September 2021
Unaudited Unaudited Audited
Six months Six months Year
ended ended ended
30 September 30 September 31 March
2021 2020 2021
£’000 £’000 £’000
Revenue 12,696 8,362 23,410
Administrative expenses (9,082) (7,429) (16,554)
Realised gains on disposal of investments - 1,704 20,251
Fair value movements in investments 8,708 6,730 10,088 • Fair value movement
Share-based payments charge (573) (182) (543) +29.4%
Amortisation of intangible assets (1,017) (1,167) (2,317)
Movement in fair value of deferred consideration - - (365)
Operating profit 10,732 8,018 33,970 • Operating profit +33.8%
Finance income 238 18 68
Finance expense (8) (9) (20)
Profit before taxation 10,962 8,027 34,018
Taxation 192 220 440
Profit and total comprehensive income for the period 11,154 8,247 34,458 • Profit after tax +35.2%
Basic earnings per Ordinary share (pence) 2.53 1.87 7.83 • Basic EPS +35.2%
Diluted earnings per Ordinary share (pence) 2.50 1.87 7.83
12Consolidated statement of financial position
As at 30 September 2021
Unaudited Unaudited Audited
As at As at As at
30 September 30 September 31 March
2021 2020 2021
£’000 £’000 £’000
Goodwill and intangible assets 33,371 35,538 34,388
• Direct portfolio:
Property, plant and equipment and right-of use assets 526 642 563 • Capital deployed £5.4m
Investments 110,298 101,618 96,220
Total non-current assets 144,195 137,798 131,171 • FVM +£8.7m
Trade and other receivables 4,551 1,451 4,060
• +14.6% vs. March 2021
Restricted cash - 305 2,484
Cash, cash equivalents and short-term liquidity
investments 52,114 24,866 54,725 • Cash £52.1m. No debt
Total current assets 56,665 26,622 61,269
Total assets 200,860 164,420 192,440
Trade, other payables and lease liabilities (6,486) (4,348) (8,249)
Deferred consideration (1,578) (1,736) (1,578)
Total current liabilities (8,064) (6,084) (9,827)
Lease liabilities (319) (409) (351)
Deferred consideration (2,869) (4,446) (2,869)
Deferred taxation (3,180) (3,592) (3,372)
Total non-current liabilities (6,368) (8,447) (6,592)
Total liabilities (14,432) (14,531) (16,419)
Net assets 186,428 149,889 176,021 • NAV per share 42.4p +c.6%
Equity vs. March 2021
Issued share capital 4 4 4
Share premium 81,644 81,644 81,644
Other distributable reserve 68,240 70,000 69,560
Retained earnings 33,559 (3,806) 22,405 • Interim dividend 0.3p/share
Share-based payments reserve 2,981 2,047 2,408
Total equity 186,428 149,889 176,021
13Consolidated cash flow statement
For the six months ended 30 September 2021
Unaudited Unaudited Audited
Six months Six months Year
ended ended ended
30 September 30 September 31 March
2021 2020 2021
£’000 £’000 £’000
Net cash generated from operating activities 2,625 2,164 5,611 • Strong operating cash inflow
Sale of direct investments - 3,493 36,987 £2.6m
Purchase of direct investments (5,370) (11,160) (15,647) • Net £5.4m of proprietary
Investee company loan repayments - 250 250 capital deployed
Investee company loan interest received 238 18 68
Net cash (used in)/generated from direct investment
activities (5,132) (7,399) 21,658
Purchase of property, plant and equipment (34) (25) (52)
Purchase of fund management contracts - - (2,100)
Decrease in short-term liquidity investments - 5,981 5,981
Net cash (used in)/generated from other investing activities (34) 5,956 3,829
Net cash (used in)/generated from total investing activities (5,166) (1,443) 25,487
Dividends paid - - (440)
Interest paid (8) (9) (20)
Payment of lease liabilities (62) (51) (118)
Net cash used in financing activities (70) (60) (578)
Net (decrease)/increase in cash and cash equivalents (2,611) 661 30,520
Cash and cash equivalents at the beginning of the period 54,491 23,971 23,971
Cash and cash equivalents at the end of the period 51,880 24,632 54,491
14Investment review
Third-party fund management
15Experienced investment teams with a strong track record
National Regional Private Proprietary
Debt
VCT/EIS venture equity capital
65 investment professionals
MD – asset classes:
Investment team size: 18 21 5 16 5
c.£5m of
CBILS
deployed
RLS
accredited
Highlights: August
2021
16Proactive regional deal origination
Origination across asset classes enhanced by digital platform established pre-pandemic
£55.1m invested in 74 companies, of which 38 are new
Key regional investor
National Regional Private Proprietary
VCT/EIS venture equity Debt capital
Investment Early stage, Early stage, Profitable, Profitable, Series A, up to
criteria: series A, up to up to £2m up to £5m up to £1m £5m
£5m
Total portfolio 128 125 9 164 23
size:
Investments made £24m £14m £5m £7m £5m
this period:
New to portfolio: 5 6 1 26 -
AuM: £420m £181m £53m £108m £186m
Cash: £121m £38m £19m £54m £52m
17Regional investment activity 18
H1 2022 managed funds’ performance

         Venture                 VCT                     Mercia

                    5.9x                  1.7x    2nd most active venture
                                                  capital funds in the UK
                                          6.0x
                                                    (excluding London)
                                                         June 2021
                    2.7x                  1.1x
                                                    4th most active UK
                                          10.9x    venture capital firm -
                                                     The Deal 2020
                    1.8x

                                          0.4x

19
H1 2022 asset class performance
T VPI * Venture PE
Institutional Funds
Legacy 137% 133%
Current 102% 101%
Retail EIS Funds
Legacy 140% n/a
Current 97% n/a
* TVPI % Distributions + total value + cash/paid in
VCTs NAV** Total return
Northern Venture Trust 74.1 256.6
Northern 2 VCT 69.2 199.6
Northern 3 VCT 106.1 212.5
** Total return growth over 12 months based on 30 September 2020 cumulative total return of 19.3%-23.0%
20Northern VCTs acquisition update
• Second successful acquisition since Mercia’s 2014 IPO
• Delivering on value drivers
Strategy in action
• Successful integration of investment team and support functions
• 8 investments from cross referrals
• 13 exits to 30 September 2021
• £38.2m raised in new capital, new £40.0m target raise announced
• £6.1m entitlement to performance fees
21Proprietary capital
• 25 direct investments (including two new added post period end)
Balance sheet performance
• £8.7m in fair value movements across direct investments
• IRR c.14%
• Areas of focus:
• Enabling technologies within Life Sciences, Software, Digital
Entertainment and Deep Tech
• Seed new 10-year funds to expand FuM
• Corporate activity
22Continuing to build a balanced portfolio
• Clear balance sheet strategy:
• Focus on enabling technologies within key sectors to reflect
Balance sheet strategy
regional strengths
• Optimal portfolio size of 30
• Typical holding period of 3-7 years
• Typically holding 10-30% equity stakes
• Acquire smaller stakes in later-stage investments
• Utilising balance sheet capital for secondary transactions
alongside VCTs
• Internal portfolio resource provides significant value add
• 12 companies in managed fund shadow portfolio
23Portfolio overview
Well diversified
Life Sciences Software
21% 26%
Deep Tech Digital Entertainment
27% 26%
24Direct investment holdings
as at 30 September 2021
Investment Net cash Fair value Investment Percentage
value invested movement value held
Year of As at Six months to Six months to As at As at
first 1 April 30 September 30 September 30 September 30 September
direct 2021 2021 2021 2021 2021
investment £’000 £’000 £’000 £’000 %
nDreams Ltd 2014 17,726 - - 17,726 35.4%
Faradion Ltd 2017 5,693 1,500 5,756 12,949 15.0%
Intechnica Group Ltd 2017 9,996 - 2,824 12,820 27.5%
Medherant Ltd 2016 8,105 534 349 8,988 33.1%
Voxpopme Ltd 2018 8,845 - - 8,845 17.6%
Impression Technologies Ltd 2015 8,622 - - 8,622 67.3%
Ton UK Ltd t/a Intelligent Positioning 2015 4,913 - - 4,913 29.9%
Locate Bio Ltd 2018 3,006 1,664 188 4,858 18.1%
Warwick Acoustics Ltd 2014 4,255 - 407 4,662 35.8%
Soccer Manager Ltd 2015 3,553 - 1,047 4,600 39.0%
VirtTrade Ltd t/a Avid Games 2015 2,812 796 148 3,756 40.0%
Eyoto Group Ltd 2017 1,813 750 - 2,563 15.7%
sureCore Ltd 2016 2,417 - - 2,417 22.0%
PsiOxus Therapeutics Ltd 2015 2,407 - - 2,407 1.4%
Edge Case Games Ltd 2015 2,300 - - 2,300 18.7%
W2 Global Data Solutions Ltd 2018 2,300 - - 2,300 16.3%
MyHealthChecked PLC 2016 4,488 - (2,448) 2,040 13.5%
Sense Biodetection Ltd 2020 945 - 625 1,570 1.2%
MIP Diagnostics Ltd 2020 302 - - 302 3.3%
LM Technologies Ltd 2015 250 - (250) - 48.3%
Other direct investments n/a 1,472 126 62 1,660 n/a
Total 96,220 5,370 8,708 110,298 n/a
25Top 10 holdings, by value (1-5)
Investment value
£ 17.7m £12.9m £12.8m £9.0m £8.8m
% direct holding
(excludes FuM) 35.4% 15.0% 27.5% 33.1% 17.6%
Direct investments
Initial year of
investment 2014 2017 2017 2016 2018
Description Sodium-ion E-commerce/
VR developer battery tech web security Patch delivery Video analytics
Board
representation Yes Yes Yes Yes Yes
Key metrics Regulatory,
Revenue, Licences, Revenue, ARR clinical, Revenue, ARR
partnerships partnerships partnerships
Highlights H1 2022 Revenue,
Fracked Netacea year-on- 3 pharma deal 40% growth
packs
released, TPP year growth progress
shipped to
deal signed 170%
new OEMs
= =
Valuation change
26Top 10 holdings, by value (6-10)
Investment value
£8.6m £4.9m £4.9m £4.7m £4.6m
% direct holding
67.3% 29.9% 18.1% 35.8% 39.0%
Direct investments
(excludes FuM)
Initial year of
investment 2015 2015 2018 2014 2015
Description Mobile soccer
Aluminum Business Orthobiologics Flat speaker management
pressings intelligence tech game
Board
representation Yes Yes Yes Yes Yes
Key metrics
Licences, Revenue, ARR Clinical milestones, Revenue, Revenue
partnerships partnerships partnerships
Highlights H1 2022
China + German Sustaining growth £10m Series A OEM Licences
licences pull closed milestones signed,
through, passed SM22
Aerospace growth
= =
Valuation change
27Responsible employer, responsible investor
• Dedicated ESG team representing all parts of the Group, led by Jill
Williams, reporting to CEO
• Our approach is based on the UN Principles of Responsible Investing
• We have 3 key areas of focus:
• Sustainable economic growth;
• Reducing inequalities within our communities; and
• Health and wellbeing for all
• This financial year’s focus is on greater diversity
(within Mercia and our portfolios)
• c.106 employees in 8 regional locations, with 19 university
partnerships
• c.41% of staff, c.31% of investment team and two of Mercia’s NEDs are
women
28Purpose-led, proven business model, strategy for
growth and shareholder returns
VCT operation fully integrated and delivering
Growing fee income - 88% contracted and recurring
Summary
Scale: c.£948m AuM with strong growth prospects
Well capitalised with substantial dry powder in both funds and balance sheet
Direct investment portfolio – increasing, maturing and diversified
H1 2022 interim dividend of 0.3 pence per share (H1 2021: 0.1 pence)
29Appendices 30
NEDs - strong corporate governance
 combined with deep business and asset
 management experience

         Ian Metcalfe               Diane Seymour-Williams            Ray Chamberlain
            Chair                            SID

                        Dr Jonathan Pell              Caroline Plumb OBE

31
Mercia share register: 69% free float
(31 March 2021: 69%)
• Board, management and employees (c.17%)
• Invesco (c.14%)
• Retail (c.10%)
• Ruffer (c.7%)
• Librae Holdings (c.6%)
• Chelverton Asset Management (c.4%)
• BMO (c.4%)
• BlackRock (c.3%)
• The Hargreaves No.11 settlement (c.3%)
• NFU Mutual (c.3%)
• Ninety One (Investec Asset Management) (c.3%)
Others of note:
• Allianz • NVM Private Equity
• Baillie Gifford • Schroders
• Hargreave Hale • West Yorkshire Pension Fund
• GPIM • Unicorn
• Liontrust
32Valuation methodology
• Followed IPEVCV Guidelines
• Calibration of valuation approaches
• Some use of DCF due to valuation guidelines
• COVID-19 discounts beginning to unwind
• But still adopt a ‘hand-on-heart’ final review
• BDO undertook interim review
Direct investment valuations
£2.3m £2.0m
Listed bid price: 2%
£13.5m
Enterprise value: 43%
£47.2m Price of recent funding round: 40%
£43.6m Cost adjusted for impairment: 13%
Cost: 2%
33You can also read