MI COVID response Data and modeling update - August 23, 2021 - State of ...

Page created by Jane Sharp
 
CONTINUE READING
MI COVID response Data and modeling update - August 23, 2021 - State of ...
MI COVID response
Data and modeling update
August 23, 2021
MI COVID response Data and modeling update - August 23, 2021 - State of ...
Executive Summary – All Indicators Show Increases
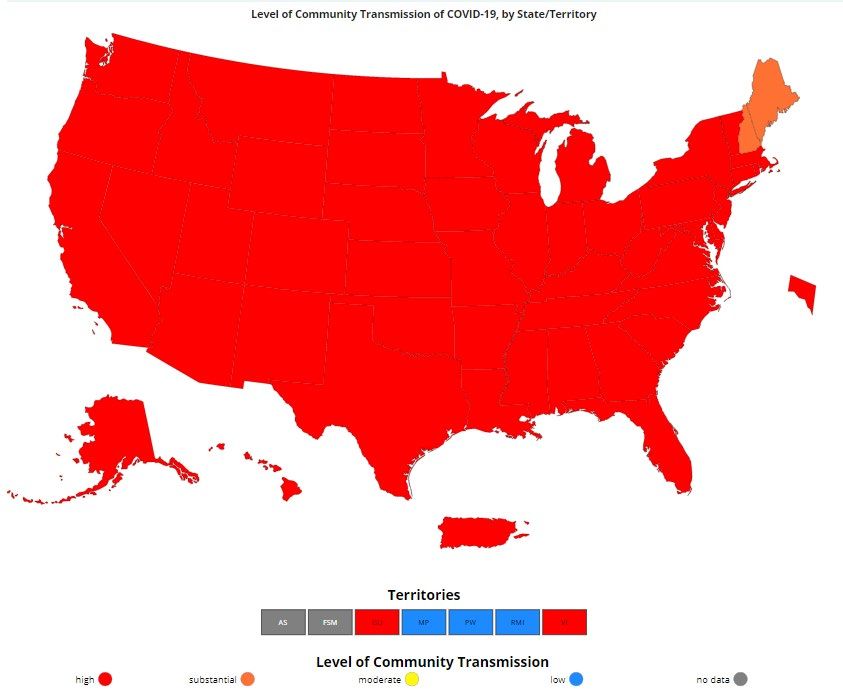
Michigan remains at High Transmission
Percent Positivity (8.6%) is increasing for two months (up from 7.7% last week), and Case Rate (127.2 cases/million) have increased for
two months (up from 102.0 last week)
  Michigan has 33rd lowest number of cases (30th last week), and 8th lowest case rate (5th last week) in the last 7 days
  99% of positive tests available for sequencing in Michigan were Delta variant in the last 4 weeks
Percent of inpatient beds occupied by individuals with COVID (4.7%) has increased for five weeks (up from 4.0% last week).
  Michigan has 7th lowest inpatient bed utilization (9th last week), and 5th lowest adult ICU bed utilization (10th last week)
Deaths (1.2 deaths/million) are increasing for three weeks (0.6 deaths/million last week). 86 COVID deaths between Aug 10 and Aug 16.
  Michigan has the 40th lowest number of deaths (T28th last week), and T22nd lowest death rate (T16th last week) in the last 7 days
7-day average state testing rate is steady at 2,131.7 tests/million/day. Daily diagnostic tests (PCR) is 20.7K per day, and the weekly
   average for PCR and antigen tests conducted in Michigan is 37.3K.
10.07 million COVID-19 vaccine doses administered, 50% of population is fully vaccinated (4.99 million people)
Science Round Up
  COVID-19 Delta outbreaks have already led to numerous school closures throughout the United States
  Michigan cases are growing at similar rates to states with Delta surges
  Delta wave in Michigan could lead to even more pediatric COVID hospitalizations this fall than we experienced last spring
  In the last thirty days, people who are not fully vaccinated developed COVID-19 at a rate 7 times that of fully vaccinated people and
      experienced COVID deaths at a rate 30 times that of fully vaccinated people
  Vaccine protection against hospitalization remains strong across different studies and settings.

                                                                                                                                          2
MI COVID response Data and modeling update - August 23, 2021 - State of ...
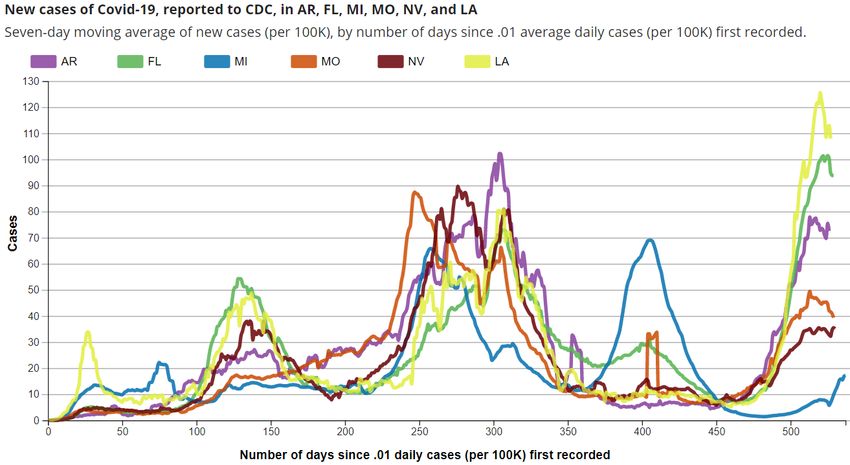
Global and National Comparisons: US cases increasing
 What we see today (data through 8/23):
 •    Globally, 212,023,982 cases and 4,435,004 deaths*
 •    Countries with the highest case count are U.S. (37,711,159), India (32,449,306), and Brazil (20,570,891)*
 •    Nearly all US jurisdictions have high community transmission†
 •    States with the highest seroprevalence (national seroprevalence: 21.6% through end of June)†:
       State                          Est. Seroprevalence                         95% CI
       1. Ohio                                   37.3%                      34.3% - 40.4%
       2. Illinois                               35.4%                      31.8% - 39.1%
       3. Wisconsin                              32.9%                      29.4% - 36.8%
       4. Texas                                  32.2%                      28.1% - 36.0%

       11. Michigan                              27.8%                      25.0% - 31.2%
       –    Other notable states: AL (29.2%), AR (22.9%), GA (14.4%), FL (24.1%), LA (12.7%), MO (26.5%), MS (31.5%), TN (29.2%)

  Source: * Johns Hopkins COVID-19 Dashboard; † CDC COVID Data Tracker
                                                                                                         Public Health               Other       Science
National Comparison                      Spread                           Severity
                                                                                                            Response               Indicators   Round-up   3
MI COVID response Data and modeling update - August 23, 2021 - State of ...
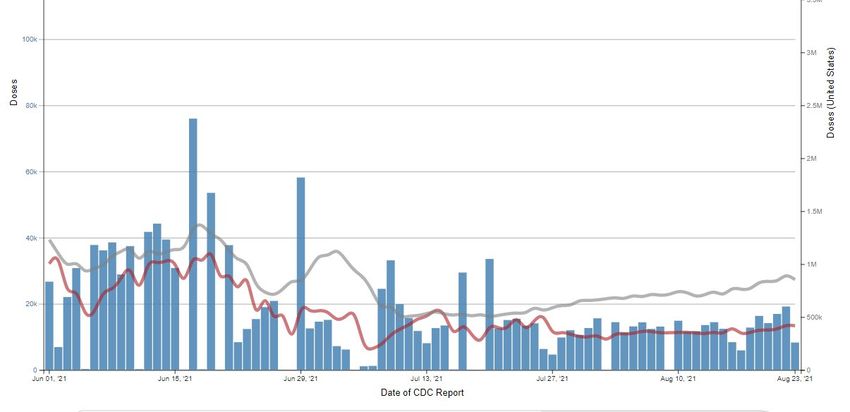
State Comparisons: Missouri and Arkansas
Missouri Confirmed New Cases / 1M (7 days average)                                                                  Arkansas Confirmed New Cases / 1M (7 days average)

                                                                                                                    1000
1000

 500                                                                                                                 500

   0                                                                                                                   0
       May 1, 20 Jul 1, 20    Sep 1, 20    Nov 1, 20      Jan 1, 21   Mar 1, 21   May 1, 21   Jul 1, 21 Sep 1, 21          May 1, 20 Jul 1, 20   Sep 1, 20    Nov 1, 20      Jan 1, 21   Mar 1, 21   May 1, 21   Jul 1, 21 Sep 1, 21

40K                    Percent Positive (7 day average)
                                                                                                                    15K        Percent Positive (7 day average)
30K                                                                                                                                                                                            New Tests
                                                                          New Tests                                                                                                                                          12.1%

                                                                                                                    10K
20K
                                                                                                          13.2%

10K                                                                                                                  5K

 0K                                                                                                                  0K
       May 1, 20 Jul 1, 20    Sep 1, 20    Nov 1, 20      Jan 1, 21   Mar 1, 21   May 1, 21   Jul 1, 21 Sep 1, 21          May 1, 20 Jul 1, 20    Sep 1, 20    Nov 1, 20     Jan 1, 21   Mar 1, 21   May 1, 21   Jul 1, 21 Sep 1, 21

   0                                                                                                                   0

                                                                                                                                         Mobility retails and recreational
 -50                                                                                                                 -50
                Mobility retails and recreational

 400                                                                                                                                                                                                                           420
                                                                                                            356
                                                                                                                     400
 300             Hospitalizations / 1M                                                                                          Hospitalizations / 1M
 200
                                                                                                                     200
 100
                                                                                                                       0
       May 1, 20 Jul 1, 20     Sep 1, 20   Nov 1, 20      Jan 1, 21   Mar 1, 21   May 1, 21   Jul 1, 21 Sep 1, 21          May 1, 20 Jul 1, 20    Sep 1, 20    Nov 1, 20     Jan 1, 21   Mar 1, 21   May 1, 21   Jul 1, 21 Sep 1, 21

                                                                                                                                                                                                                               4
MI COVID response Data and modeling update - August 23, 2021 - State of ...
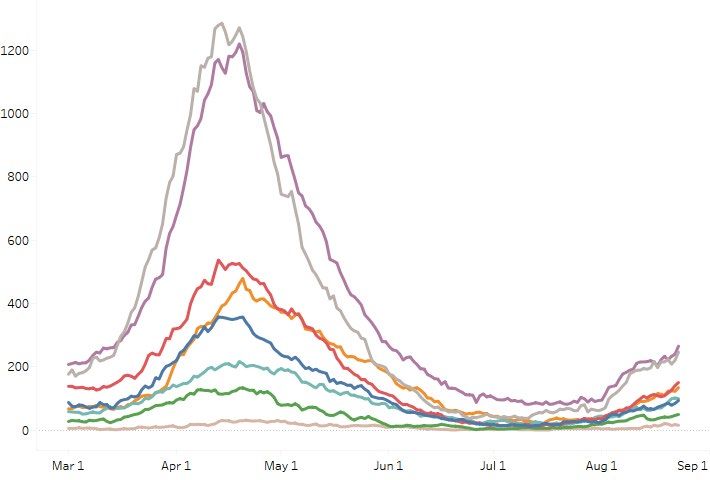
State Comparisons: Florida and Michigan
Florida Confirmed New Cases / 1M (7 days average)                                                                 Michigan Confirmed New Cases / 1M (7 days average)

                                                                                                                  1000
1000

 500                                                                                                               500

   0                                                                                                                 0
       May 1, 20 Jul 1, 20    Sep 1, 20    Nov 1, 20   Jan 1, 21   Mar 1, 21   May 1, 21   Jul 1, 21 Sep 1, 21           May 1, 20 Jul 1, 20   Sep 1, 20    Nov 1, 20      Jan 1, 21   Mar 1, 21   May 1, 21     Jul 1, 21 Sep 1, 21

150K                                                                                                      22.9%
                                                                       Percent Positive (7 day average)           80K        Percent Positive (7 day average)
                                      New Tests                                                                   70K
100K                                                                                                              60K
                                                                                                                                                                                                               New Tests
                                                                                                                  50K
                                                                                                                  40K
50K                                                                                                               30K
                                                                                                                  20K
                                                                                                                                                                                                                              6.9%
                                                                                                                  10K
 0K
       May 1, 20 Jul 1, 20    Sep 1, 20    Nov 1, 20   Jan 1, 21   Mar 1, 21   May 1, 21   Jul 1, 21 Sep 1, 21           May 1, 20 Jul 1, 20    Sep 1, 20    Nov 1, 20     Jan 1, 21   Mar 1, 21   May 1, 21     Jul 1, 21 Sep 1, 21

   0
                                                                                                                     0

 -50
                                                                                                                                       Mobility retails and recreational
                                                                                                                   -50
                Mobility retails and recreational
                                                                                                                  -100
 800                                                                                                        774    400
 600                                 Hospitalizations / 1M
 400                                                                                                               200                     Hospitalizations / 1M                                                               96
 200
                                                                                                                     0
       May 1, 20 Jul 1, 20     Sep 1, 20   Nov 1, 20   Jan 1, 21   Mar 1, 21   May 1, 21   Jul 1, 21 Sep 1, 21           May 1, 20 Jul 1, 20    Sep 1, 20    Nov 1, 20     Jan 1, 21   Mar 1, 21   May 1, 21     Jul 1, 21 Sep 1, 21

                                                                                                                                                                                                                               5
MI COVID response Data and modeling update - August 23, 2021 - State of ...
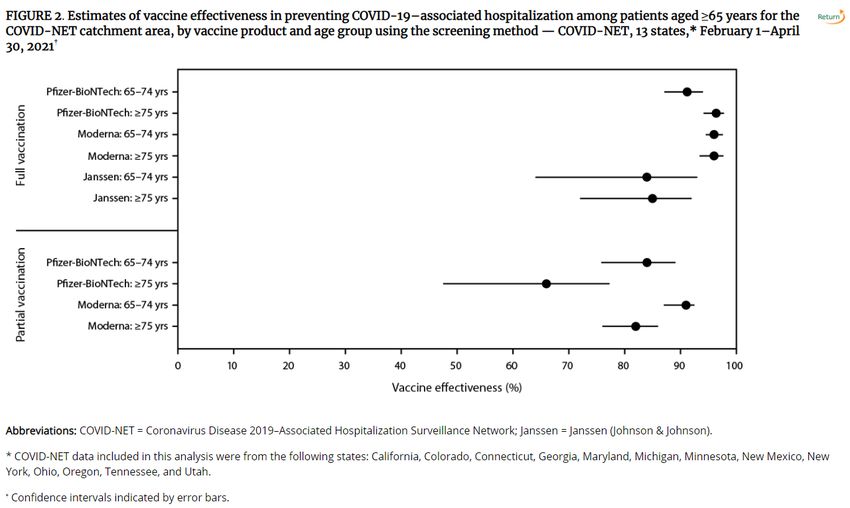
State Comparisons: Nevada and Louisiana
Nevada Confirmed New Cases / 1M (7 days average)                                                                    Louisiana Confirmed New Cases / 1M (7 days average)
                                                                                                                    1500
1000
                                                                                                                    1000

 500
                                                                                                                     500

   0                                                                                                                   0
       May 1, 20 Jul 1, 20    Sep 1, 20    Nov 1, 20      Jan 1, 21   Mar 1, 21   May 1, 21   Jul 1, 21 Sep 1, 21          May 1, 20 Jul 1, 20   Sep 1, 20    Nov 1, 20      Jan 1, 21   Mar 1, 21   May 1, 21    Jul 1, 21 Sep 1, 21

40K                    Percent Positive (7 day average)
                                                                                                                               Percent Positive (7 day average)
                                                                                                                    40K
                                                                                                          16.0%
30K
                                                       New Tests                                                                                                                                                              14.9%

20K
                                                                                                                                                                                                      New Tests
                                                                                                                    20K

10K

 0K                                                                                                                  0K
       May 1, 20 Jul 1, 20    Sep 1, 20    Nov 1, 20      Jan 1, 21   Mar 1, 21   May 1, 21   Jul 1, 21 Sep 1, 21          May 1, 20 Jul 1, 20    Sep 1, 20    Nov 1, 20     Jan 1, 21   Mar 1, 21   May 1, 21    Jul 1, 21 Sep 1, 21

   0                                                                                                                   0

                                                                                                                                         Mobility retails and recreational
 -50                                                                                                                 -50
                Mobility retails and recreational

 600
                                Hospitalizations / 1M                                                       393
                                                                                                                     600                         Hospitalizations / 1M
                                                                                                                                                                                                                                602
 400                                                                                                                 400
 200                                                                                                                 200
   0                                                                                                                   0
       May 1, 20 Jul 1, 20     Sep 1, 20   Nov 1, 20      Jan 1, 21   Mar 1, 21   May 1, 21   Jul 1, 21 Sep 1, 21          May 1, 20 Jul 1, 20    Sep 1, 20    Nov 1, 20     Jan 1, 21   Mar 1, 21   May 1, 21    Jul 1, 21 Sep 1, 21

                                                                                                                                                                                                                                6
MI COVID response Data and modeling update - August 23, 2021 - State of ...
Key Messages: COVID-19 is Spreading Faster with Delta
    Statewide positivity has increased to 8.6% (last week: 7.7%)
    •   One week percent change is up 11% (vs. up 11% last week)
    •   Increasing for two months (Jun 26 low of 1.2%)
    •   Positivity is increasing in all MERC regions; five regions are >7% and three regions > 10%

    Case rate (127.2 cases/million) increasing for two months (last week: 102.0 cases/million)
    • One week increase of 10% (vs. 15% increase last week)
    • Increasing for two months (Jun 26 low of 14.0 cases/million)
    • Cases per million are increasing in all MERC regions

    Michigan is at High Transmission level
    •   More than three quarters of the counties in Michigan are at high transmission level
    •   CDC recommends all individuals, regardless of vaccination status, should mask indoors
    •   The U.S. is at high transmission level (262.3 cases/100,000 in last 7 days) with 54 states/territories in substantial or high transmission

    Number of active outbreaks is up 48% from last week
     Eighty-three new outbreaks were identified in the past week
     SNF/LTC reported the most new and ongoing outbreaks this week

                                                                                 Public Health                  Other                    Science
National Comparison              Spread                   Severity                                                                                   7
                                                                                   Response                  Indicators                 Round-up
MI COVID response Data and modeling update - August 23, 2021 - State of ...
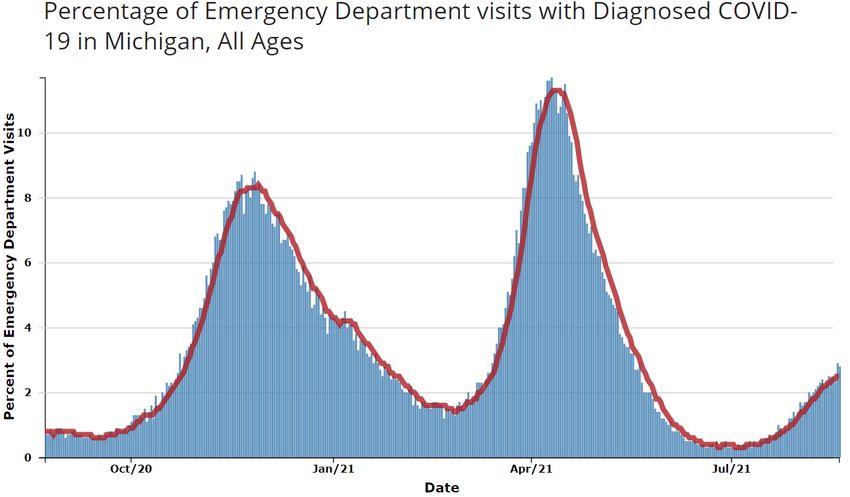
Confirmed and probable case indicators                                                          Risk levels
         Table Date: 8/23/2021 (7 days from date table was produced: 8/16/2021)                Low   A    B      C     D   E

           Cases                                            Positivity

                                                            Public Health           Other                        Science
National Comparison     Spread             Severity                                                                            8
                                                                                                                               8
                                                              Response            Indicators                   Round-up
MI COVID response Data and modeling update - August 23, 2021 - State of ...
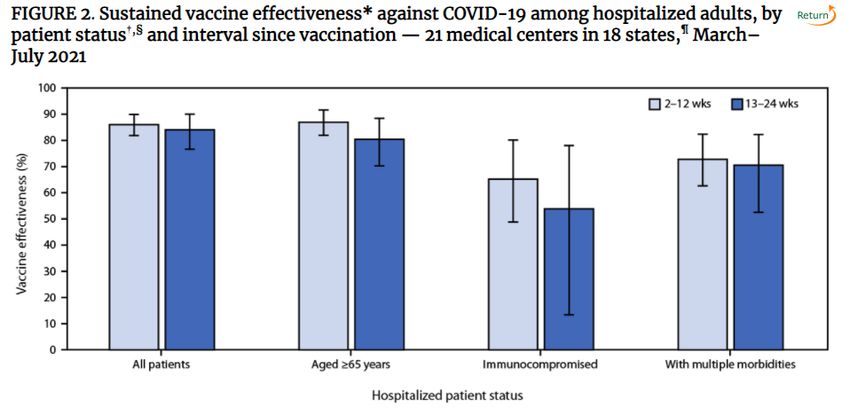
Overview of metrics for individuals
MI COVID response Data and modeling update - August 23, 2021 - State of ...
Michigan at High Transmission Level
  Dashboard | CDC | MI Start Map for most recent data by
  reporting date

                                                       Public Health     Other       Science
National Comparison   Spread            Severity                                               10
                                                           Response    Indicators   Round-up
Case Rate Trends are Increasing for All Age Groups
   Daily new confirmed and probable cases per million by age group (7-day rolling average)
                                0-9                30-39              60-69
       1000                     10-19              40-49              70-79                                200
                                20-29              50-59              80+

        750                                                                                                150

        500                                                                                                100

        250                                                                                                50

            0                                                                                               0
                3/1       5/1         7/1        9/1        11/1        1/1        3/1     5/1       7/1         6/26   7/3       7/10   7/17     7/24   7/31   8/7      8/14

   •      Case rate trends for all age groups are increasing
   •      Case rates for all age groups are between 70 and 180 cases per million (through 8/16)
   •      Case rate trends are highest for 30-39-year-olds followed by 20-29, 40-49, 10-19, and 50-59
       Note: Case information sourced from MDHHS and reflects date of onset of symptoms
       Source: MDHHS – Michigan Disease Surveillance System

                                                                                                                  Public Health                 Other                 Science
National Comparison                                 Spread                                Severity                                                                              11
                                                                                                                                                                                11
                                                                                                                    Response                Indicators            Round-up
Number of Cases and CaseRates are Increasing for Most Age Groups
   Daily new confirmed and probable cases per million by age group (7-day rolling average)

                    Age                 Average†                    Average†                   One Week                  •      Average daily number of cases (231) is
                   Group               daily cases                 Daily Case                % Change (Δ #)                     highest for those aged 20-29
                                                                      Rate
                                                                                                                         •      Avg. daily case rate (179.7 cases/mil) is
                0-9                           97.4                       84.5                      21% (+17)                    currently highest for 30-39
                10-19                        159.0                      126.7                      12% (+16)             •      Case rates for all age groups are between
                20-29                        230.7                      167.2                       6% (+13)                    70-180 cases per million
                30-39                        218.0                      179.7                      19% (+34)             •      Case rate trends are increasing for all age
                40-49                        170.1                      144.3                      3% (+1-5)                    groups
                50-59                        167.1                      123.8                      15% (+22)             •      Case rates bottomed out on June 26, 2021
                60-69                        123.3                       96.6                      -1% (-1-5)
                70-79                         73.1                       95.4                       12% (+8)
                80+                           29.9                       72.1                      7% (+1-5)                 * Highest 7-day avg. following spring 2021 surge
                                                                                                                             ¶ Total may not reflect state due to missing age data
                Total¶                      1275.1                      127.2                     10% (+120.4)
               † Rolling 7-day average
               Note: Case information sourced from MDHHS and reflects date of onset of symptoms
               Source: MDHHS – Michigan Disease Surveillance System

                                                                                                                Public Health                       Other                             Science
National Comparison                   Spread                                  Severity                                                                                                          12
                                                                                                                 Response                        Indicators                          Round-up   12
Racial and Ethnic Case Rates are Increasing
            Daily new confirmed and probable cases per million                                                Daily new confirmed and probable cases per
            (7 day rolling average) by race category                                                          million (7 day rolling average) by ethnicity category
                        American Indian/Alaska Native                     Black/African American                           Hispanic or Latino    Not Hispanic or Latino
              150       Asian/Pacific Islander                            White                               150
                            Race                      Case Rate

                            American Indian/          91.5
                            Alaskan Native

              100           Asian/Pacific Islander    47.1                                                    100
                            Black/African American    74.1

                            White                     96.7

                50                                                                                             50
                                                                                                                                                                     Race              Case Rate

                                                                                                                                                                     Hispanic/Latino   133.9

                                                                                                                                                                     Non-Hispanic      94.2

                 0                                                                                              0
                     6/26           7/3        7/10    7/17        7/24        7/31         8/7        8/14         6/26       7/3     7/10     7/17      7/24   7/31         8/7      8/14
    Updates since last week:
    •    Cases per million are increasing for all races and ethnicities
    •    Hispanics and Whites have the highest case rates
    •    In the past 30 days, 17% (↔) of race data and 20% (↔) ethnicity data was either missing or reported as unknown

    Note: Case information sourced from MDHHS and reflects date of death of confirmed and probable cases.
    Source: MDHHS – Michigan Disease Surveillance System

                                                                                                              Public Health                       Other                          Science
National Comparison                                  Spread                               Severity                                                                                             13
                                                                                                                                                                                               13
                                                                                                               Response                         Indicators                     Round-up
Identified COVID-19 Cases Caused by All Variants of Concern (VOC)
   in US and Michigan
     Variants Circulating in United States, Aug 8 –                                      Variants of Concern in Michigan, Aug 23
     Aug 14 (NOWCAST)

                                                                                                                                                            Note: The low number of
                                                                                                                                                            specimens recently
                                                                                                                                                            submitted for sequencing
                                                                                                                                                            limits the ability to estimate
                                                                                                                                                            the prevalence of variants in
                                                                                                                                                            Michigan

                                                                                                                                      737 cases in Wayne attributed to Detroit

                                                                                        Variant                            MI Reported Cases¶         # of Counties       % Specimens in last 4 wks
                                                                                        B.1.1.7 (alpha)                          13,661*                    81
Number of Outbreaks Reported has Increased
   Number of outbreak investigations by site type, week ending Aug 19
                                                                                                                                                                                                            Visibility1           Easier to identify outbreak
                                                                       Site type          Outbreaks by ongoing/new classification, #                                                                                              Harder to identify outbreak
                                                                                                                                    Ongoing                                          New          Total
                                SNF/L T C/ O T HE R        A SSIS T E D LIV ING                                                                                      34                               26                         Total number of active
                                                                                                                                                            30                      18
                                       CHIL DCA R E/Y O U T H          PRO G RA M                                                                                                                                                outbreaks is up 48% from
                               MA NUF A CT UR IN G , CONS T R U CT IO N                                                                                28           8               36                                           previous week, with 83 new
                                                      *SOCIA L GA THER IN G                                                                    23       8                 31                                                     outbreaks identified (3 fewer
                                            *RES TA U RA N T S A ND BA RS                                                            15    9            24                                                                       than last week)
                                                                 HEA L T HCA R E                                     10 1             11
                                                                            OTHER                                8       3            11
                                                                                                                                                                                                                                 SNF/LTC reported the
                                                            OFF ICE SET T IN G                               7       3               10
                                                                                                                                                                                                                                 greatest number of new
                                                                          *RETA IL                       6       2               8
                                                                                                                                                                                                                                 outbreaks (26) this week,
                            *CO MMU N IT Y EXPO S UR E - OUT DO O R                            3      3                      6
                                                                                                   4 1                   5                                                                                                       followed by childcare/ youth
                                                  *PER S O NA L SERV IC E S
                                                                 K- 12 SCHO O L                    4 1                   5                                                                                                       programs (18), restaurants/
                                                   *REL I G I O U S SERV I CE S                      5 0                 5                                                                                                       bars (9), manufacturing/
                                                                     *SHEL T E RS                  4 0               4                                                                                                           construction and social
                              A GRICU L T U RA L / F O O D        PRO CE S S I NG              3 0               3                                                                                                               gatherings (8 each) and
                                                               CORRE C T I O N S            2 0              2                                                                                                                   seven other settings with at
                                                   COLL EG E/ U N IV E R S IT Y          1 0             1                                                                                                                       least 1 new outbreak in the last
                               *CO MMU N IT Y EXPO S UR E - INDO O R                     1 0             1                                                                                                                       week.
                                                                         TO TA L                                                 188                                83               271

  1. Based on a setting’s level of control and the extent of time patrons/residents spend in the particular setting, different settings have differing levels of ability to ascertain whether a case derived from that setting

  NOTE: Many factors, including the lack of ability to conduct effective contact tracing in certain settings, may result in significant underreporting of outbreaks. This chart does not provide a complete picture of
  outbreaks in Michigan and the absence of identified outbreaks in a particular setting in no way provides evidence that, in fact, that setting is not having outbreaks.

  Source: LHD Weekly Sitreps

                                                                                                                                                Public Health                                     Other                                    Science
National Comparison                                    Spread                                        Severity                                                                                                                                             15
                                                                                                                                                                                                                                                          15
                                                                                                                                                    Response                                  Indicators                                 Round-up
Key Messages: COVID-19 and Healthcare Capacity and COVID Severity

    Hospitalizations and ICU utilization are increasing
     2.5% of ED visits are for COVID-like illness (CLI) (up from 2.1% last week)
     Hospital admissions are increasing for all age groups this week
     Hospitalizations up 29% since last week (vs. 23% increase week prior)
     All regions are showing increasing trends in hospitalization trends this week, except Region 8 (plateau)
       Hospitalization for COVID-19 is highest in Regions 2N, 2S, 3 and 6
       Fastest growth is in Regions 5 and 7
     Volume of COVID-19 patients in intensive care has increased 26% since last week (vs. 15% increase last week)

    Death rate is 1.2 daily deaths per million people
     Death rate has increased three weeks
     200% increase since Jul 22 low
     30-day proportion of deaths among those under 60 years of age is steady from the prior week

                                                                   Public Health            Other               Science
National Comparison        Spread               Severity                                                                  16
                                                                     Response             Indicators           Round-up
Michigan Trends in Emergency Department (ED) Visits for COVID-19-Like
         Illness (CLI) saw the largest increase in over 3 months

                                                                                                                        2.5%

     •    Trends for ED visits have increased to 2.5% since last week (up from 2.1% week prior)
     •    Trends vary by age groups with all age groups seeing an increase
     •    Over past week, those 40-49 years saw highest number of avg. daily ED CLI visits, but those between 25 and 74 all above state average
Source: https://covid.cdc.gov/covid-data-tracker/#ed-visits
                                                                                 Public Health               Other                   Science
National Comparison                           Spread          Severity
                                                                                   Response                Indicators              Round-up       17
Average Hospital Admissions Are Increase for all Age Groups

                                                                                                  Source: CHECC & EM Resource
   •   Trends for daily average hospital admissions have increased 5% since last week (vs. 28% increase prior week)
   •   This week, all age groups have experienced increases in daily hospital admissions
   •   Over the past week, those 50-59 years have seen the highest number of avg. daily hospital admissions (25 admissions)

                                                                     Public Health           Other                          Science
National Comparison         Spread                Severity                                                                            18
                                                                       Response            Indicators                     Round-up    18
Statewide Hospitalization Trends: Total COVID+ Census
         Hospitalization Trends 3/1/2021 – 8/23/2021          The COVID+ census in hospitals has
     Confirmed Positive & Persons Under Investigation (PUI)   increased 29% from last week (previous
                                                              week was up 23%). Hospitalizations are
                                                              up nearly 5-fold from the nadir in mid-
                          Confirmed Positive                  July.

                                                                  Hospitalized COVID Positive Long Term
                                                                     Trend (beginning March 2020)

                    PUI

                                                                                                          19
Statewide Hospitalization Trends: Regional COVID+ Census
                                                                All regions except Region 8 show increasing
      Hospitalization Trends 3/1/2021 – 8/23/2021
                                                                hospitalization trends this week. The fastest
              Confirmed Positive by Region
                                                                growth was in Regions 5 and 7 this week.
                                                    Region 1
                                                    Region 2N
                                                                Regions 2N, 2S, 3 and 5 are all above 100/M
                                                    Region 2S   population hospitalized.
                                                    Region 3
                                                    Region 5
                                                    Region 6
                                                    Region 7       Region          COVID+               COVID+
                                                    Region 8                 Hospitalizations (% Δ   Hospitalizations
                                                                               from last week)           / MM
                                                                Region 1           93 (43%)               86/M
                                                                Region 2N         246 (13%)               111/M
                                                                Region 2S         265 (24%)               119/M
                                                                Region 3          150 (34%)               132/M
                                                                Region 5           99 (50%)               104/M
                                                                Region 6          134 (31%)               91/M
                                                                Region 7           49 (53%)               98/M
                                                                Region 8           15 (0%)                48/M

                                                                                                                  20
Statewide Hospitalization Trends: ICU COVID+ Census
      Hospitalization Trends 3/1/2021 – 8/23/2021   Overall, the census of COVID+ patients in ICUs has
                Confirmed Positive in ICUs          increased by 26% from last week, to 245 patients.

                                                    All regions except Region 6 have increasing ICU
                                                    hospitalizations from last week. All regions remain at
                                                    or below 85% overall ICU occupancy.

                                                      Region    Adult COVID+ in   Adult ICU   % of Adult ICU
                                                                 ICU (% Δ from    Occupancy   beds COVID+
                                                                   last week)
                                                    Region 1       21 (11%)         85%            11%
                                                    Region 2N      58 (23%)         74%            10%
                                                    Region 2S      64 (16%)         79%            9%
                                                    Region 3       39 (39%)         83%            12%
                                                    Region 5       17 (42%)         78%            9%
                      Confirmed                     Region 6        25 (0%)         75%            10%
                      Positive in ICU
                                                    Region 7       16 (167%)        64%            9%
                                                    Region 8        5 (67%)         74%            9%

                                                                                                         21
What if Scenarios: Hospitalizations if we follow Wave 2 or 3
                                                       If this wave continues to grow and follows growth patterns of prior Michigan waves we
                                             450
                                                       would face growing hospitalizations through September with a peak in October
                                             400

                                                                                                                                              Magnitude of 4th wave
                                             350
                                                                                                                                              here is assumed to
   Hospitalizations per million population

                                                                                                                                              parallel prior waves for
                                                                                                                                              illustration purposes
                                             300

                                             250
                                                                                                                                              only; There is insufficient
                                                                                                                                              data to estimate the
                                             200                                                                                              magnitude of any fourth
                                                                                                                                              wave at this time
                                             150

                                                                       = 11-Mar-2021
                                             100                                                                                                   Wave 2 (winter)
                                                              = 19-Oct-2020            22-Aug-2021
                                              50

                                                                                                                                             Wave 3 (spring)
                                               0
                                                   0          20              40         60          80           100         120      140   160       180

                                                                                              Days since beginning of wave (aligned)

                                                                                                                                                                       22
Average and total new deaths, by age group
       Daily confirmed and probable deaths per million by                                                              Total confirmed and probable deaths by age group
       age group (7 day rolling average)                                                                               (past 30 days, ending 8/16/2021)

                        0-19                40-49               70-79                                              •       22% of deaths below age sixty
                        20-29               50-59               80+
       30               30-39               60-69               Total

                                                                                                                                                                                63
                                                                                                                                                                         56
       20
                                                                                                                                                                 42

       10                                                                                                                                                23
                                                                                                                                                11
                                                                                                                                7      1-5
                                                                                                                       0
        0
            5/23          6/6            6/20             7/4            7/18             8/1               8/15   0-19        20-29   30-39   40-49    50-59   60-69   70-79   80+

   •    Overall trends for daily average deaths are increasing since last week
   •    Through 8/16, the 7-day avg. death rate is more than 2.0 daily deaths per million people for those over the age of 60
   Note: Death information sourced from MDHHS and reflects date of death of confirmed and probable cases.
   Source: MDHHS – Michigan Disease Surveillance System

                                                                                                                       Public Health                 Other                 Science
National Comparison                               Spread                                  Severity                                                                                    23
                                                                                                                           Response              Indicators              Round-up     23
30-day rolling average daily deaths per million people by race and
    ethnicity
            Average daily deaths per million people by race                                                         Average daily deaths per million people by
                                                                                                                    ethnicity
              15            American Indian/Alaska Native                     Black/African American                15          Hispanic or Latino    Not Hispanic or Latino
                            Asian/Pacific Islander                            White

              10                                                                                                    10

                5                                                                                                    5

                0                                                                                                    0
                    5/23          6/6           6/20            7/4           7/18            8/1            8/15        5/23       6/6       6/20      7/4       7/18         8/1       8/15

    •     Additional reviews of vital records death data were performed the weeks of 7/6 and 8/9 to search for race and ethnicity
    •     This review has resulted in an adjustment of deaths for American Indian and Alaskan Natives from previous weeks
    •     Currently, American Indian/Alaskan Natives have the highest death rate

    Note: Death information sourced from MDHHS and reflects date of death of confirmed and probable cases.
    Source: MDHHS – Michigan Disease Surveillance System

                                                                                                                    Public Health                      Other                          Science
National Comparison                               Spread                                  Severity                                                                                              24
                                                                                                                     Response                        Indicators                      Round-up
•   `

    COVID-19 Vaccination
       Administration (doses administered)
       •   5,289 first doses administered each day (7 day rolling average*)
       •   Most administered frequently by pharmacies, local health departments, and hospitals
       Coverage (people vaccinated)
       •   65.9% (+0.5) of aged 18+ have had first dose of vaccine; 86.8% (+0.3) of aged 65+ have had first dose
       •   4,992,872 people in Michigan have completed vaccination series (4,955,984 and 4,916,256 in last 2 weeks)
       •   Initiation highest among Asian, Native Hawaiian or Pacific Islander and American Indian/Alaskan Native
           individuals (MI COVID Vaccine Dashboard 8/19/21)
       •   9,010 Additional Doses for Immunocompromised Individuals administered since 8/13
       •   Less than 1% of Vaccinated Individuals Later Tested Positive for COVID-19 (Number of cases who are fully
           vaccinated (n= 14,583)

  *https://covid.cdc.gov/covid-data-tracker/#vaccination-trends_vacctrends-onedose-daily

                                                                      Public Health              Other               Science
National Comparison          Spread               Severity
                                                                        Response             Indicators             Round-up   25
•   `

    Doses administered in Michigan remains steady as national
    administration is slightly increasing (data through 8/23/2021)

 12,609,020 doses delivered to providers and 10,074,092            Daily Change in Total Number of Administered Doses
 doses administered (CDC tracker)                                  Reported to CDC by date of CDC report, Michigan
 • US showing increase in first doses recently
 • MI increase not as strong

 August 12-19 (inclusive)
 • 42,311 first doses administered
 • 5,289 first doses/day on average (MCIR data)

 Doses were most frequently administered by
 - Pharmacies (28.5K)
 - LHD (3.9K) and hospitals (2.7K)
 - Family practice (1.9K), FQHCs (1.7K), and Pediatric (767)

                                                                   CDC COVID Data Tracker

                                                                     Public Health            Other             Science
National Comparison        Spread               Severity
                                                                       Response             Indicators         Round-up   26
Over 4.99 Million Michiganders fully vaccinated and 50% of total population fully
   vaccinated

        4.99 million people in the state are fully                Vaccination Coverage in Michigan as of 8/23/21
        vaccinated
        82.4% of people aged 65 and older have                    Age Group          % At Least     % Fully         Number Fully
        completed the series                                                         One Dose      Vaccinated        Vaccinated
        Race/Ethnicity for those 12 years and older:           Total Population             54.7             50.0       4,992,872
        •   Initiation coverage highest among those            ≥ 12 years                   63.6             58.1       4,992,769
            of Non-Hispanic (NH) Asian, Native
            Hawaiian or Pacific Islander Race                  ≥ 18 years                   65.9             60.5       4,744,582
            (53.7%), then NH American Indian
                                                               ≥ 65 years                   86.8             82.4       1,454,829
            (50.4%), NH White (46.6%), NH Black or
            African American Races (35.8%).
        •   Initiation is at 46.6% for those of Hispanic
            ethnicity
        •   Completion follows the same pattern

        •   20.4% data missing or unknown

                                                                            Public Health            Other                Science
National Comparison          Spread                 Severity
                                                                             Response              Indicators            Round-up   27
Third Doses of mRNA Vaccine

       Additional Dose: for when initial immune                 Booster Dose: for when initial sufficient
       response is likely to be insufficient                    immune response is likely to have waned
       • One additional dose recommended for                    • ACIP considering manufacturers data (July)
         moderately or severely immunocompromised                 and vaccine effectiveness by variant
         individuals after an initial 2-dose primary              (Sept/Oct)
         series of an mRNA COVID-19 vaccine has                     • HEROES-RECOVER cohort: 5000 essential
         been received.                                               workers, assess neutralizing antibodies 6 months
            • Pfizer for persons aged ≥12 years                       post-vaccination
            • Moderna for persons aged ≥18 years                    • Vision VE Network: 8 integrated care centers;
                                                                      assesses waning efficacy
            • At this time, not recommending additional doses
              of vaccine for people who were initially              • IVY VE Network: hospital-based investigators (MI
              vaccinated with the one-dose Janssen vaccine.           too); assess duration of protection
       • Clinicians use best clinical judgement in
         determining if patient meets eligibility               • MDHHS would like every eligible health care
         criteria. No special attestation required by             provider to enroll as a COVID-19 vaccine provider
         patient or medical provider.                             and keep vaccine available in their clinics to
                                                                  vaccinate their patients
       • 9,010 doses since Aug 13th                                 • 3,952 providers enrolled so far

                                                                  Public Health               Other             Science
National Comparison        Spread               Severity
                                                                   Response                 Indicators         Round-up
Comirnaty (koe-mir’-na-tee) approved

        FDA approves first COVID-19 Vaccine             Pfizer Extended Expiration Date
        • 8/23/21 FDA approved the first COVID-19      Extended from six to nine months, as long as authorized
          vaccine.                                     storage conditions between -90°C to -60°C (-130°F to -76°F)
                                                       have been maintained.
        • Pfizer-BioNTech COVID-19 Vaccine will
          now be marketed as Comirnaty (koe-mir’-      Printed Expiry Date           Updated Expiry Date
          na-tee), for the prevention of COVID-19      August 2021                   November 2021
          disease in individuals 16 years of age and
          older.                                       September 2021                December 2021

        • Vaccine continues to be available under      October 2021                  January 2022
          EUA, including for individuals 12 through    November 2021                 February 2022
          15 years of age and for the administration   December 2021                 March 2022
          of a third dose in certain
          immunocompromised individuals.               January 2022                  April 2022
                                                       February 2022                 May 2022

                                                          Public Health              Other                  Science
National Comparison    Spread            Severity
                                                            Response               Indicators              Round-up
Anticipated: Nursing Home* Staff will be required to receive COVID-19
  vaccination
  •     Goal: To Protect America’s Nursing Home Residents from
        COVID-19
  •     How: Requiring COVID-19 Vaccinations for Long-Term Care
        Workers Who Serve Medicare and Medicaid Enrollees
  •     Why:
       •     Millions of COVID-19 vaccinations have been administered to
             nursing home residents and staff
       •     COVID-19 vaccines can prevent severe outcomes from
             COVID-19 and are proven to be effective against the Delta
             (B.1.617.2) variant
             •  Higher levels of staff vaccination are linked to fewer
                outbreaks among residents
       •     Nationally, 62% of nursing home staff are already fully
             vaccinated against COVID-19 with some states reporting that
             more than 88% nursing home staff are fully vaccinated
             • 53% of Michigan’s nursing home staff are fully vaccinated

 * Medicare and Medicaid participating nursing homes
 Source: Centers for Medicare and Medicaid Services and The White House Fact Sheet

                                                                                                Public Health     Other       Science
National Comparison                               Spread                             Severity
                                                                                                 Response       Indicators   Round-up30
                                                                                                                                     30
`

    Potential COVID-19 Vaccination Breakthrough Cases
    Michigan part of CDC’s nationwide investigation (COVID-19 Breakthrough Case Investigations and Reporting | CDC)

    Michigan Data (1/1/21 through 8/17/21):
    •   14,583 cases met criteria based on a positive test 14 or more days after being fully vaccinated
    •    Less than 1% of people who were fully vaccinated met this case definition
        • Includes 267 deaths (235 in persons ages 65 years or older)
        • 779 cases were hospitalized

    •   Vaccine breakthrough cases are expected. COVID-19 vaccines are effective and are a critical tool to bring the pandemic under control.
        However, no vaccines are 100% effective at preventing illness in vaccinated people. There will be a small percentage of fully vaccinated
        people who still get sick, are hospitalized, or die from COVID-19.
    •   More than 166 million people in the United States have been fully vaccinated as of August 9, 2021. Like with other vaccines, vaccine
        breakthrough cases will occur, even though the vaccines are working as expected. Asymptomatic infections among vaccinated people will
        also occur.
    •   There is some evidence that vaccination may make illness less severe for those who are vaccinated and still get sick.
    •   Current data suggest that COVID-19 vaccines authorized for use in the United States offer protection against most SARS-CoV-2 variants
        currently circulating in the United States. However, variants will cause some vaccine breakthrough cases.

                                                                               Public Health                 Other                   Science
National Comparison             Spread                   Severity
                                                                                 Response                 Indicators                Round-up       31
Updated data

  Science Round Up
  What is delta and what does it mean to Michigan?
  • Michigan rates are about one month behind surges in states with early spread of delta variant; growing at similar rates
  • COVID-19 outbreaks have led to numerous school closures through out the United States.
  • Pediatric rates per total population in this Delta wave have been approaching 8-9 per million total population
  • Delta wave in Michigan could lead to more pediatric COVID hospitalizations this fall than we experienced last spring

  Are vaccinations working?
  • Cumulatively, a larger proportion of those who become cases (97%), are hospitalized (94%), and died (95%) from COVID were
  among people who were not fully vaccinated
  • In the last thirty days, 79% of cases, 77% of hospitalized cases, and 79% of deaths were among people who were not fully
  vaccinated
  • Rates of cases are increasing in both groups, but people who are not fully vaccinated have case rates 7 times that of those who
  are fully vaccinated; and deaths rates are 30 times greater among those not fully vaccinated
  • Vaccine protection against hospitalization remains strong across different studies and settings

                                                                       Public Health              Other                Science
National Comparison          Spread                Severity
                                                                         Response               Indicators            Round-up   32
What does Delta Variant
mean for Michigan
Cumulative COVID-19 Case Rates: States with High Delta Comparison

                                                                                                                                    Michigan

    •    Average daily incidence per 100,000 cases in Michigan is currently lower than other states experiencing a surge in delta cases
   Source: CDC COVID Data Tracker – State Trend Comparison

                                                                                Public Health                Other                    Science
National Comparison                           Spread         Severity                                                                           34
                                                                                  Response                 Indicators               Round-up    34
Michigan cases growing                                           In progress

 at similar rates to states
 with Delta surges
• Michigan case rates growing but
  lower than many states in the south
• However, the week-over-week %
  change and Rt are similar to other
  states which have seen large surges
• MI started with lower case rates, so
  exponential growth takes longer to
  reach high levels, however potential
  for Michigan to see a similar surge if
  growth continues
     Sources: CDC data tracker, Rt estimated from case data
     assuming a 5.68 day mean serial interval (SD = 4.77) based
     on Reed et al. 2021
Examples of US School District Closures due to COVID-19
  outbreaks

                      Texas - Iraan-Sheffield Ind S.D. closed after 6 days. No masking; low community vaccination rates.
                      Nebraska- Auburn Public Schools closed after 6 days.
                      Florida- School closures in 5 counties. 20,000 students and staff in quarantine and isolation. 17
                      employees, including seven teachers and an assistant principal have died since Aug 1.
                      Mississippi- 10 schools closed across 5 counties.

                      Oklahoma – 3 schools districts. Some schools with over 25% of student body in quarantine.

                      Kentucky – 2 school districts within 6 days of school opening.

                      Tennessee – School with 1/3 of staff and students out due to illness. Second school closed "due to
                      an inability to staff the building and classrooms."

                                                                Public Health            Other               Science
National Comparison     Spread               Severity
                                                                 Response              Indicators           Round-up
SARS-CoV-2 can Negatively Impact Children Directly and Indirectly
  •     Children can experience severe health outcomes from COVID-19 including MIS-C and Hospitalization
           •    Hospitalizations among children nationwide is higher than it’s ever been*
           •    Nearly half of children hospitalized have no reported underlying conditions†
      United States Hospital Admissions | 0 -17 years                                      U.S. Pediatric Hospitalizations | Underlying Medical Conditions
                                                                  All time high

                                                                                                                                                     46%

Sources: *CDC COVID Data Tracker > New Hospital Admissions; † COVIDNET

                                                                                  Public Health              Other                   Science
National Comparison                                       Spread
                                                                                   Response                Indicators               Round-up
Pediatric Hospitalizations for COVID in other states
 Alabama                                 Arkansas                             Texas

                                                                                                                9
                                                                                                                    • Pediatric
                                    10                                    8
                                         400                                  400                               8
                                                                          7

400
                                                                          6                                     7     hospitalizations follow
                                                                                                                6
                                                                          5
                                                                          4                                     5     adult hospitalizations
                                    5

200
                                         200
                                                                          3
                                                                              200                               4     with a slight lag
                                                                                                                3
                                                                          2
                                                                                                                2
                                                                          1
   0                                0      0                              0     0
                                                                                                                1   • Pediatric rates per total
            Jun 1   Jul 1   Aug 1                 Jun 1   Jul 1   Aug 1                 Jun 1   Jul 1   Aug 1         population in this Delta
 Missouri                                Mississippi                          Florida
                                                                                                                      wave have been
                                    10   600                                  800
                                                                                                                      approaching 8-9 per
                                                                                                                9

300
                                                                          8
                                                                          7                                     8     million total population
                                                                          6   600                               7
                                         400
                                                                                                                6
200                                 5
                                                                          5
                                                                          4   400                               5   • Pediatric proportion of
                                         200                              3
                                                                                                                4
                                                                                                                      population does not
                                                                                                                3
100                                                                       2
                                                                          1
                                                                              200
                                                                                                                2     vary dramatically in
   0                                0      0                              0      0
                                                                                                                1
                                                                                                                      these states vs.
            Jun 1   Jul 1   Aug 1                 Jun 1   Jul 1   Aug 1                 Jun 1   Jul 1   Aug 1         Michigan
Graphs show Adult hospitalizations per million total population (dark smoother lines, left Y axis)
and Pediatric Hospitalizations per million total population (lighter jagged lines, right Y axis)
                                                                                                                                          38
Michigan Pediatric COVID Hospitalization Implications
Michigan’s spring 2021 alpha variant wave                       Michigan Pediatric COVID Hospital Census at peak
saw higher pediatric hospitalizations vs.
prior waves in the US                              90
                                                                                                               85
                                                   80

If we extrapolate from what is happening           70

in other states and Michigan has a 4th             60
                                                                                       60

wave with Delta of similar size to past
waves, we could expect even more
                                                   50

pediatric COVID hospitalizations this fall         40

                                                   30
                                                               25

In the spring, ~70% of these                       20

hospitalizations were concentrated in 3            10

pediatric hospitals in Michigan (Detroit,
Ann Arbor, Grand Rapids)                            0

                                                            Fall 2020              Spring 2021          Possible Fall 2021

                                  Possible fall scenario assumes overall COVID wave similar to past waves and uses
                                  pediatric hospitalization rates seen in states having delta surge this summer
                                                                                                                             39
Are Vaccinations Working?
Cumulative COVID-19 Cases by Vaccination Status, Michigan, Jan 15 – Aug 17
                                                                                 Fully Vaccinated People (4,659,504)
                                         Cases                                                      Hospitalization                                                           Deaths
                   Percent of Cases In People Not                                 Percent of Hospitalizations In People                                  Percent of Deaths In People Not
                          Fully Vaccinated                                                Not Fully Vaccinated                                                  Fully Vaccinated
                                 (406,598 / 421,181)                                                   (11,548 / 12,327)                                                    (4,757 / 5,024)
                                         96.5%                                                              93.7%                                                              94.7%
                                       406,598                                                              11,548                                                              4,757
                         Total Cases Not Fully Vaccinated                                Total Hospitalized Not Fully Vaccinated                               Total Deaths Not Fully Vaccinated

                        Total Breakthrough Cases                                    Total Breakthrough Hospitalizations                                       Total Breakthrough Deaths
                                 14,583                                                            779                                                                   267
                                        0.313%                                                             0.017%                                                             0.006%
                    Percent of Fully Vaccinated People who                          Percent of Fully Vaccinated People Who Were                      Percent of Fully Vaccinated People Who Died of
                   Developed COVID-19 (14,583 / 4,659,504)                           Hospitalized for COVID-19 (779 / 4,659,504)                               COVID-19 (267 / 4,659,504)

                                          3.5%                                                               6.3%                                                                5.3%
                 Percent of Cases Who Were Fully Vaccinated                           Percent of Hospitalizations Who Were Fully                       Percent of Deaths Who Were Fully Vaccinated
                              (14,583 / 421,181)                                              Vaccinated (779 / 12,327)                                                (267 / 5,024)

                            Total Cases: 421,181                                        Total Hospitalizations: 12,327                                              Total Deaths: 5,024
Michigan Disease Surveillance System may underestimate the frequency of COVID-19 hospitalizations:
- Case investigation and follow-up is more difficult for individuals who get vaccinated (e.g., they are too ill to speak to investigators, don’t answer their phone, or otherwise).
- These hospitalizations include individuals who are hospitalized for issues other than COVID19 (the same as breakthrough COVID-19).
- Individuals who get hospitalization will lag after infection and may occur after case investigation.

                                                                                                                         Public Health                               Other                     Science
National Comparison                              Spread                               Severity
                                                                                                                           Response                              Indicators                   Round-up   41
Trends in Breakthrough Cases, Hospitalizations, and Deaths
         •    50% of the population is fully                                 30%
              vaccinated yet only account for
              ~20% of cases, hospitalizations,                                                                                                                                                   25%
                                                                             25%                                                                                                  24%24%
              and deaths                                                                                                                                                                     23%           23%

         •    As the fully vaccinated population                                                                                                                                           21%          21%   21%

              has increased, so have the                                     20%

              percent of breakthrough incident;
              but breakthrough burden remains                                15%
              lower                                                                                                                                                 12%       12%
                                                                                                                                                                  11%
         •    In the last 30 days, 6,151 (21%) of                            10%
              29,269 cases, 198 (23%) of 854
              hospitalizations, and 24 (21%) of                                                                                                       6%
                                                                                                                                                             5%
                                                                                                                                                 5%
              115 deaths were among fully                                      5%
              vaccinated individuals                                                                                       1%
                                                                                                                                2%
                                                                                                                                     1%
                                                                                                                                            2%

                                                                                         0% 0% 0%         0% 1% 0%
                                                                               0%
                                                                                         January         February           March              April            May              June        July      Last 30 days
                                                                                                                                Cases        Hospitalizations           Deaths

Michigan Disease Surveillance System may underestimate the frequency of COVID-19 hospitalizations:
- Case investigation and follow-up is more difficult for individuals who get vaccinated (e.g., they are too ill to speak to investigators, don’t answer their phone, or otherwise).
- These hospitalizations include individuals who are hospitalized for issues other than COVID19 (the same as breakthrough COVID-19).
- Individuals who get hospitalization will lag after infection and may occur after case investigation.

                                                                                                                         Public Health                               Other                          Science
National Comparison                              Spread                               Severity
                                                                                                                           Response                               Indicators                       Round-up      42
`

     Potential COVID-19 Vaccination Breakthrough Cases
      1200       Breakthrough Case Rate vs. Not Fully Vaccinated                                Breakthrough Death Rate vs. Not Fully Vaccinated
                                  Case Rate                                                                      Death Rate
      1000                                    Case Rate among Fully Vaccinated       12
                                              Case Rate among Not Fully Vaccinated
       800                                                                           10

                                                                                      8
       600
                                                                                      6
       400
                                                                                      4
       200                                                                            2

         0                                                                            0
          1/25       2/25    3/25      4/25    5/25        6/25       7/25             1/25       2/25    3/25      4/25       5/25   6/25     7/25

 •   Trends over time show that both case and death rates among the Fully Vaccinated are lower than the Not Fully vaccinated rates in Michigan
 •   Rates of cases are increasing in both groups, but people who are not fully vaccinated have case rates 7 times that of those who are fully
     vaccinated; and deaths rates are 30 times that of those not fully vaccinated
 •    The proportion of breakthrough cases and deaths among all cases and deaths has shown some increases as more people become fully
      vaccinated
     • However, the risk of infection and death remains significantly lower among the fully vaccinated

                                                                                          Public Health                Other                  Science
National Comparison                 Spread                   Severity
                                                                                              Response              Indicators               Round-up   43
All three vaccines effective at preventing hospitalization
       Effectiveness of COVID-19 Vaccines in Preventing Hospitalization Among Adults Aged ≥65 Years —
       COVID-NET, 13 States, February–April 2021

     COVID-NET: data on laboratory-confirmed COVID-19–
     associated hospitalizations in 99 U.S. counties in 13 states
     including Michigan.

     Among adults aged 65–74 years, effectiveness of full
     vaccination for preventing hospitalization was 96% for
     Pfizer-BioNTech, 96% for Moderna, and 84% for
     Janssen COVID-19 vaccines

     Among adults aged ≥75 years, effectiveness of full
     vaccination for preventing hospitalization was 91% for
     Pfizer-BioNTech, 96% for Moderna, and 85% for
     Janssen COVID-19 vaccines.

Moline HL, Whitaker M, Deng L, et al. Effectiveness of COVID-19 Vaccines in Preventing Hospitalization Among Adults Aged ≥65 Years — COVID-NET, 13 States, February–April 2021. MMWR
Morb Mortal Wkly Rep. ePub: 6 August 2021. DOI: http://dx.doi.org/10.15585/mmwr.mm7032e3external icon.

                                                                                                      Public Health                        Other                           Science
National Comparison                      Spread                          Severity
                                                                                                        Response                        Indicators                       Round-up      44
CDC Report: Sustained Vaccine Effectiveness against
 Hospitalization
• Vaccine Effectiveness 86% in
  preventing COVID-19 hospitalization
  through July 14, 2021.
• Evaluation of 3,089 hospitalized adults
  in 18 states including Michigan.
• Includes adults of all ages.
• VE in June–July was 84% (95%
  CI = 79%–89%).
• VE reduced in immunocompromised
  individuals 63% (95% CI = 44%–76%).
   Tenforde MW, Self WH, Naioti EA, et al. Sustained Effectiveness of Pfizer-BioNTech and Moderna Vaccines
   Against COVID-19 Associated Hospitalizations Among Adults — United States, March–July 2021. MMWR
   Morb Mortal Wkly Rep. ePub: 18 August 2021. DOI: http://dx.doi.org/10.15585/mmwr.mm7034e2
Appendix
Note: The low number of
   Identified COVID-19 Delta Variants by County                                                       specimens recently
                                                                                                      submitted for sequencing
     Last week (Aug 16, 2021)*                                    This week (Aug 23, 2021)            limits the ability to
                                                                                                      estimate the prevalence
                                                                                                      of variants in Michigan

Data last updated Aug 23, 2021   * Delta found in wastewater surveillance samples
Source: MDSS

                                                                         Public Health     Other              Science
 National Comparison              Spread               Severity
                                                                           Response      Indicators          Round-up   47
Reword – I reworded it, I wonder if we add to the media
Modeling: Masks can substantially reduce transmission                                   deck but don’t use in the presentation?

in school settings, even with delta variant
If 1 infectious child attends a class of 25 students, how long does it take for
there to be a >50% chance of at least one transmission event occurring?
                                            3h
           Elementary

                                                24 h
                                                                                    120 h

                                           2h
           High School

                                               18 h
                                                                                   89 h

    Estimates from the COVID-19 Indoor Safety Guideline, based on Bazant and Bush, A guideline to limit indoor airborne transmission of COVID-19, PNAS
    2021. Simulations assume: delta strain, normal talking (not singing/etc.), with child age group for elementary and average between adult and child age
    groups for high school. Vaccine coverage was assumed to be 0% for elementary and 33% for high school, based on age-specific coverage rates as of
    8/6/21. We assumed 95% mask fit/compliance for ‘Complete Masking’ and 75% for ‘Imperfect Masking’.
You can also read