MI COVID response Data and modeling update - September 14, 2021 - State of ...

Page created by Troy Burke
 
CONTINUE READING
MI COVID response Data and modeling update - September 14, 2021 - State of ...
MI COVID response
Data and modeling update
September 14, 2021
MI COVID response Data and modeling update - September 14, 2021 - State of ...
Executive Summary – All Indicators Show Increases
Michigan remains at High Transmission
Percent positivity (9.7%) is increasing for 2.5 months (9.2% last week)
Case rate (173.1 cases/million) is increasing for 2.5 months (169.2 last week)
  Michigan has 41st lowest number of cases (39th last week), and 15th lowest case rate (14th last week) in the last 7 days
  >99% of positive tests available for sequencing in Michigan were Delta variant in the last 4 weeks
Percent of inpatient beds occupied by individuals with COVID (6.8%) is increasing for eight weeks (up from 5.8% last week).
  Michigan has 13th lowest inpatient bed utilization (10th last week) and 13th lowest adult ICU bed utilization (9th last week)
Death rate (1.8 deaths/million) is increasing for six weeks (1.7 last week). There were 123 COVID deaths between Aug 31-Sep 6.
  Michigan has the 25th lowest number of deaths (29th last week), and T8th lowest death rate (T7th last week) in the last 7 days
7-day average state testing rate is steady at 2,967.5 tests/million/day. Daily diagnostic tests (PCR) is 29.6K per day, and the weekly average
   for PCR and antigen tests conducted in Michigan is 70.7K.
10.35 million COVID-19 vaccine doses administered, 51.3% of population is fully vaccinated (5.1 million people)
Science Round Up
Ridge regression model projects continued increases for Michigan although case trends may be slowing
CDC models project continued increases in hospitalizations and deaths
Children in Michigan can get infected with SARS-CoV-2 and spread the virus to others in the classroom setting
The proportion of kids getting sick with COVID-19 is increasing
Missed in person school negatively impacts children and can occur large uncontrolled outbreaks within schools
43% of Michigan school districts have mandatory mask policy for students in all K-12 grades
Case rates among children are higher in counties where school districts do not have mask policies
                                                                                                                                            2
MI COVID response Data and modeling update - September 14, 2021 - State of ...
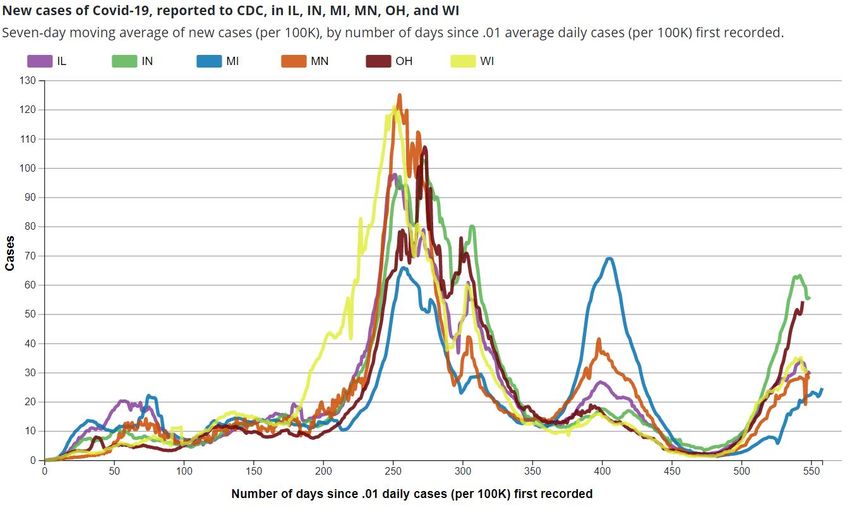
Global and National Comparisons: US cases increasing
 What we see today (data through 9/13):
 •    Globally, 224,880,598 cases and 4,633,870 deaths*
 •    Countries with the highest case count are U.S. (40,986,279), India (33,264,175), and Brazil (20,999,779)*
 •    Nearly all US jurisdictions have high community transmission†
 •    States with the highest seroprevalence (national seroprevalence: 20.6% [95% C.I. 20.2% - 21.1%] through end
      of July)†:
       State                          Est. Seroprevalence                         95% CI
       1. South Dakota                           34.1%                      23.5% - 49.2%
       2. Mississippi                            33.8%                      29.9% - 37.2%
       3. Ohio                                   33.3%                      30.6% - 36.2%
       4. Texas                                  31.9%                      26.9% - 37.0%

       13. Michigan                              28.1%                        24.9 - 31.0%
        –   Other notable states: AL (29.2%), AR (22.9%), GA (14.4%), FL (24.1%), LA (12.7%), MO (26.5%), MS (31.5%), TN (29.2%)
  Source: * Johns Hopkins COVID-19 Dashboard; † CDC COVID Data Tracker

                                                                                                         Public Health               Other      Science
National Comparison                      Spread                            Severity
                                                                                                            Response               Indicators   Round-up   3
MI COVID response Data and modeling update - September 14, 2021 - State of ...
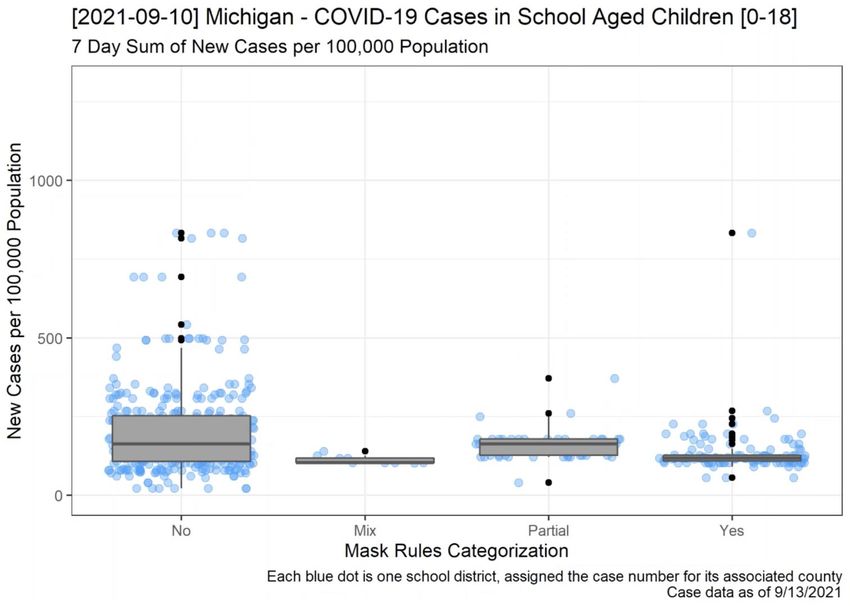
State Comparisons: Ohio and Indiana

                                      4
MI COVID response Data and modeling update - September 14, 2021 - State of ...
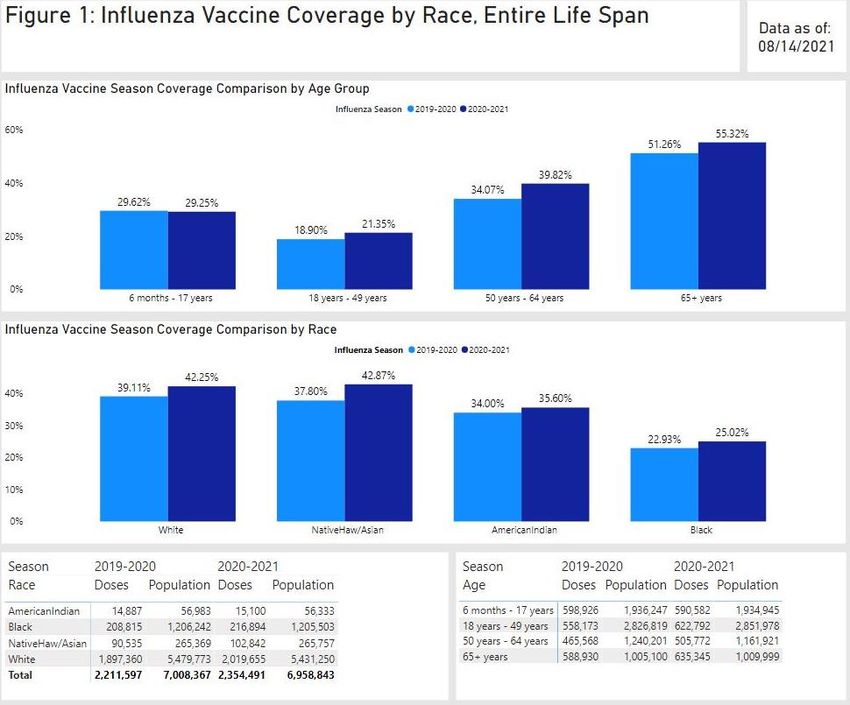
State Comparisons: Wisconsin and Michigan

                                            5
MI COVID response Data and modeling update - September 14, 2021 - State of ...
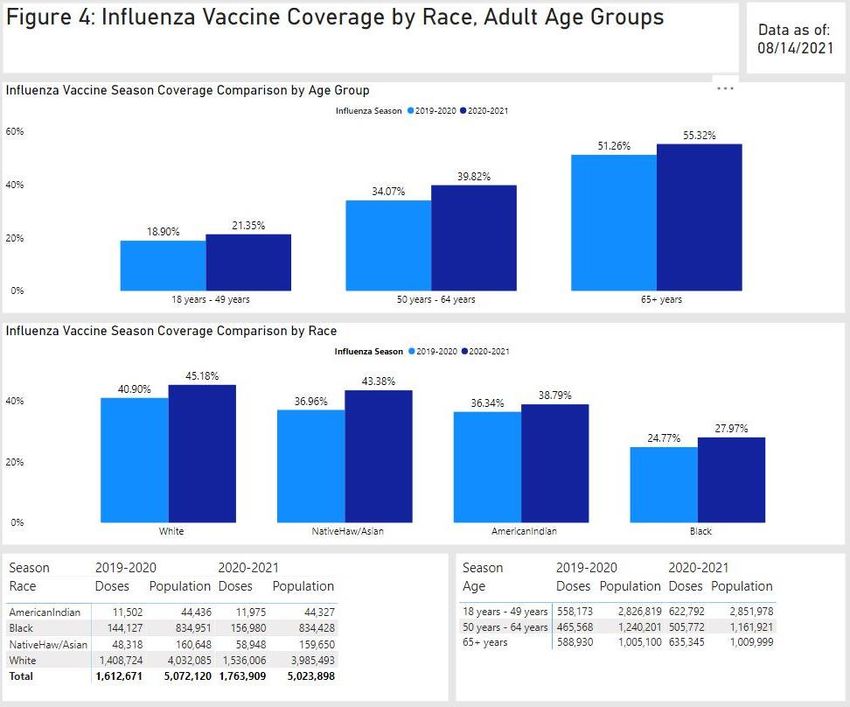
Key Messages: COVID-19 is Spreading Faster with Delta
    Statewide positivity has increased to 9.7% (last week: 9.2%)
    •   Increasing for two and half months (Jun 26 low of 1.2%)
    •   Positivity is increasing in most MERC regions; and six regions > 10%

    Case rate (173.1 cases/million) increasing for two and half months (last week: 169.2 cases/million)
    • Increasing for two and half months (Jun 26 low)
    • Cases per million are increasing in most MERC regions

    Michigan is at High Transmission level
    •   More than 90% of the counties in Michigan are at high transmission level
    •   CDC recommends all individuals, regardless of vaccination status, should mask indoors
    •   The U.S. is at high transmission level (248 cases/100,000 in last 7 days) with 54 states/territories in substantial or high transmission

    Number of active outbreaks is up 26% from last week
     132 new outbreaks were identified in the past week
     K-12 reported the most total outbreaks (108) and new outbreaks (71) this week

                                                                                  Public Health                 Other                    Science
National Comparison              Spread                   Severity
                                                                                    Response                  Indicators                Round-up   6
MI COVID response Data and modeling update - September 14, 2021 - State of ...
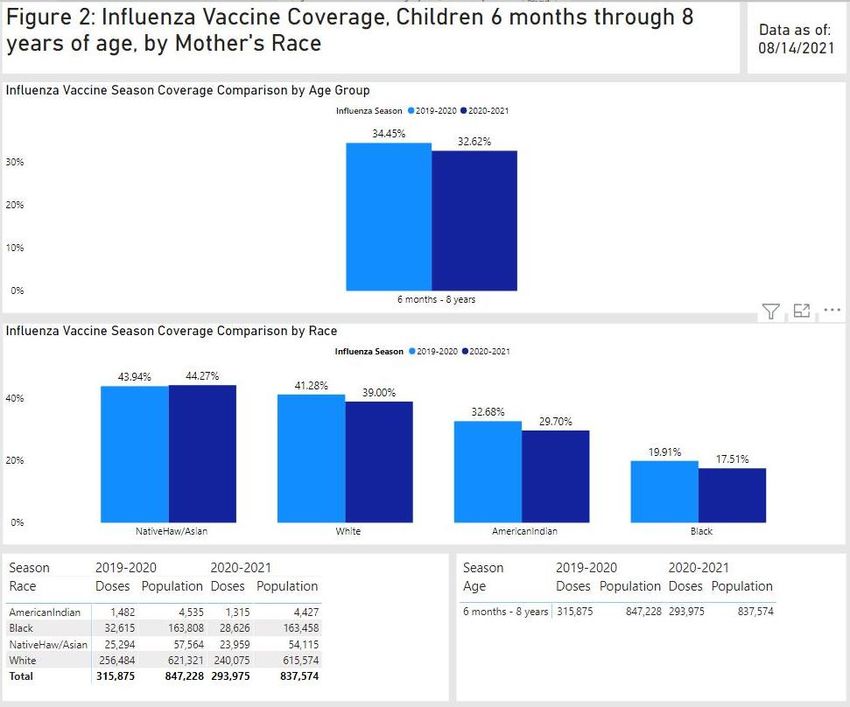
Confirmed and probable case indicators                                                         Risk levels
         Table Date: 9/13/2021 (7 days from date table was produced: 9/6/2021)                Low   A   B       C     D    E

           Cases                                            Positivity

                                                            Public Health          Other                         Science
National Comparison      Spread            Severity                                                                            7
                                                              Response           Indicators                    Round-up        7
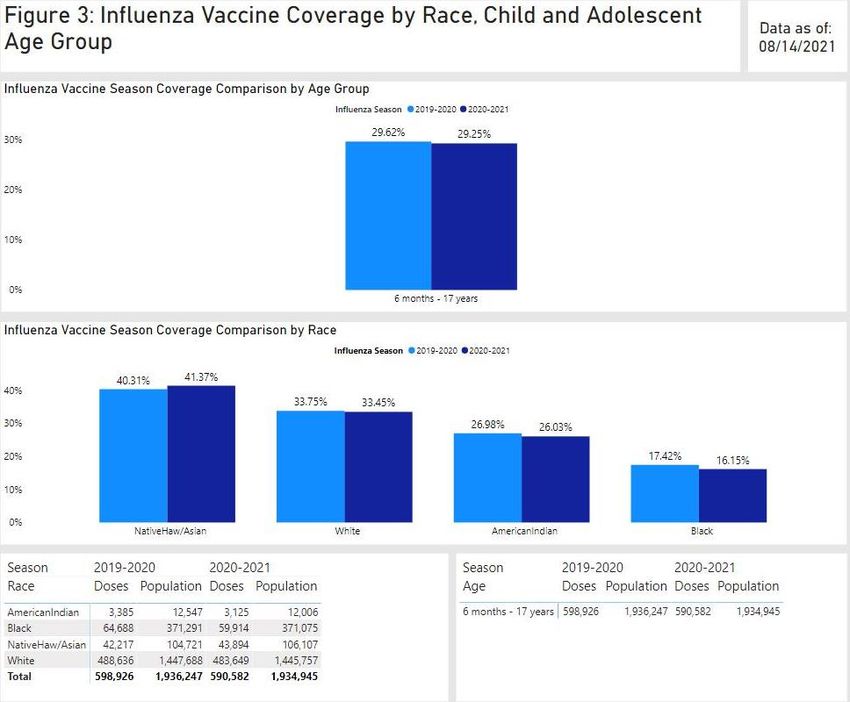
MI COVID response Data and modeling update - September 14, 2021 - State of ...
Positivity
  Regional Time Trends
   •       Case Rate and Positivity trend indicators for four
           regions on the postage stamp suggested declines:
           Detroit, Kalamazoo, Saginaw, and Lansing                           Kalamazoo
   •       Graphical display of these four regions display more               Region
           of a plateau or slight increases
          • Case rate lag is impacting case rate trends
          • Positivity levels are above substantial or high
              thresholds
                                                                                                                                            All charts
   •       At this point, cumulative data do not suggest that                 Saginaw                                                       represent
           the delta surge in Michigan is subsiding                           Region                                                        data from
                                                                                                                                            06/12/21 –
                                                                                                                                             09/12/21

             Case Rate

Detroit                                                                       Lansing
Region                                                                        Region

                                                                Case data lag period by onset date
       Source: MI Start Map; MDOC excluded

                                                                                                 Public Health         Other      Science
National Comparison                          Spread       Severity
                                                                                                     Response        Indicators   Round-up    8
MI COVID response Data and modeling update - September 14, 2021 - State of ...
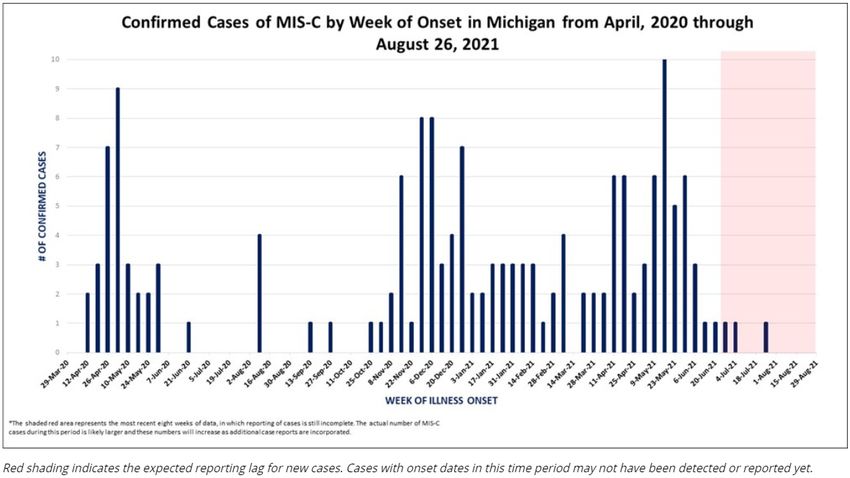
Michigan Lag adjusted new COVID cases by onset date
                                          • The gray line is cases reported
                                            as of 9/13 by onset date.
                                          • The blue line is the expected
                                            adjustment for cases by onset
                                            date as data is backfilled
                                          • The increasing delay between
                                            onset of symptoms and date
                                            of testing means that recent
                                            case numbers underestimate
                                            the true number of cases

                                                                         9
MI COVID response Data and modeling update - September 14, 2021 - State of ...
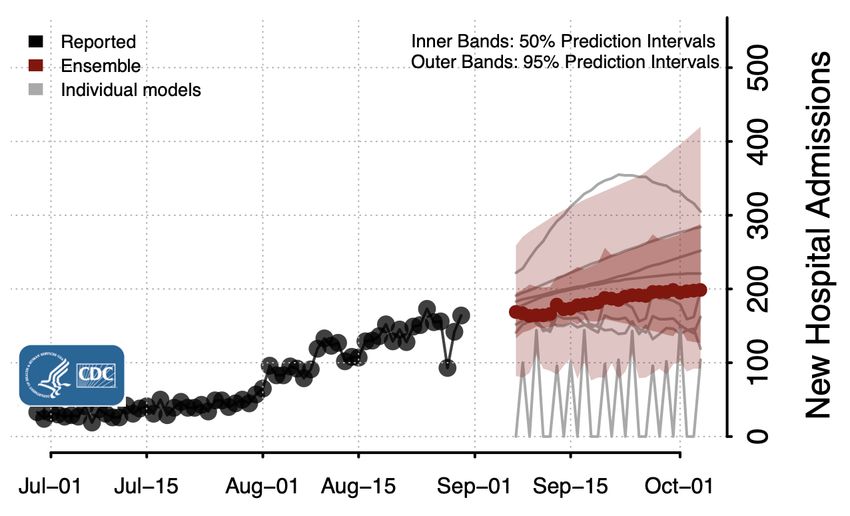
Overview of metrics for individuals < 18

•   Each day more than 230 children under age 12 become infected with COVID-19, 40 more children per day than last week
•   Pediatric case rates have increased from 138.9 to 168.2 with all regions in the state except Traverse City increasing.
•   The Upper Peninsula has more than doubled, going from 190.5 to 392.6 cases per million children since last week
•   More than 40 children (
Michigan at High Transmission Level
  and continuing to increase
  Dashboard | CDC | MI Start Map for most recent data by
  reporting date

                                                                                       Fewer cases were reported
                                                                                       over the Labor Day holiday
                                                                                       weekend which is impacting
                                                                                       trend indicators

    Source: MI Start Map; data through 9/13/2021

                                                                       Public Health                   Other        Science
National Comparison                                Spread   Severity                                                           11
                                                                        Response                    Indicators      Round-up
Case Rate Trends are Increasing for All Age Groups
   Daily new confirmed and probable cases per million by age group (7-day rolling average)
                               0-9                 30-39               60-69
       1000                    10-19               40-49               70-79
                                                                                                            300
                               20-29               50-59               80+

        750

                                                                                                            200

        500

                                                                                                            100
        250

            0                                                                                                 0
                3/1      5/1         7/1       9/1       11/1        1/1       3/1        5/1   7/1   9/1         6/26       7/10   7/24           8/7   8/21         9/4

   •      Case rate trends for all age groups are increasing
   •      Case rates for all age groups are between 100 and 260 cases per million (through 9/3)
   •      Case rate trends are highest for 10-19-year-olds followed by 30-39, 20-29, 40-49, and 0-9
       Note: Case information sourced from MDHHS and reflects date of onset of symptoms
       Source: MDHHS – Michigan Disease Surveillance System

                                                                                                                  Public Health            Other                Science
National Comparison                                  Spread                                Severity                                                                         12
                                                                                                                    Response           Indicators               Round-up    12
Number of Cases and Case Rates are Increasing for Most Age Groups
   Daily new confirmed and probable cases per million by age group (7-day rolling average)

                     Age                 Average†                    Average†                  One Week                 •      Largest one-week growth among those 10 to
                    Group               daily cases                 Daily Case               % Change (Δ #)                    19 years of age
                                                                       Rate
                                                                                                                        •      Average daily number of cases (330.7) and
                0-9                          175.7                       152.4                    10% (+18)                    avg. daily case rate (263.5 case/mil) are
                10-19                        330.7                       263.5                    38% (+97)                    highest for those aged 10-19
                20-29                        283.1                       205.2                     -3% (-9)             •    Case rate trends are increasing for those
                30-39                        263.4                       217.1
Case Rates for All Report Racial and Ethnic Groups are Increasing
            Daily new confirmed and probable cases per million                                                    Daily new confirmed and probable cases per
            (7 day rolling average) by race category                                                              million (7 day rolling average) by ethnicity category
                         American Indian/Alaska Native                     Black/African American                               Hispanic or Latino     Not Hispanic or Latino
              250        Asian/Pacific Islander                            White                                   250
                             Race                      Case Rate

              200            American Indian/          186.2                                                       200
                             Alaskan Native

                             Asian/Pacific Islander    64.0
              150            Black/African American    89.2
                                                                                                                   150
                             White                     135.1
              100                                                                                                  100
                                                                                                                                                                          Race               Case Rate
                50                                                                                                  50                                                    Hispanic/Latino    156.6

                                                                                                                                                                          Non-Hispanic       140.1
                  0                                                                                                  0
                      6/26              7/10            7/24            8/7              8/21               9/4          6/26          7/10          7/24         8/7            8/21           9/4
    Updates since last week:
    •     Cases per million are increasing for all races and ethnicities
    •     American Indian/Alaskan Native have the highest case rates
    •     In the past 30 days, 22% (↑2%) of race data and 27% (↑3%) ethnicity data was either missing or reported as unknown

    Note: Case information sourced from MDHHS and reflects date of death of confirmed and probable cases.
    Source: MDHHS – Michigan Disease Surveillance System

                                                                                                                  Public Health                        Other                             Science
National Comparison                                   Spread                               Severity                                                                                                   14
                                                                                                                   Response                          Indicators                      Round-up         14
Identified COVID-19 Cases Caused by All Variants of Concern (VOC)
   in US and Michigan
     Variants Circulating in United States, Aug 29 –                                      Variants of Concern in Michigan, Sep 13
     Sep 4 (NOWCAST)

                                                                                                                                           For the first time, all 83 counties have
                                                                                                                                           had a least one specimen sequenced
                                                                                                                                           with a variant.
                                                                                                                                           Keweenaw now has a Delta specimen
                                                                                                                                           sequence result reported in the last
                                                                                                                                           week

                                                                                                                                      786 cases in Wayne attributed to Detroit

                                                                                        Variant                            MI Reported Cases¶         # of Counties        % Specimens in last 4 wks
                                                                                        B.1.1.7 (alpha)                          13,697*                     81                      0.3%
                                                                                        B.1.351 (beta)                              88                       24                       0%
                                                                                        P.1 (gamma)                                336                       35                      0.3%
Data last updated Sep 13, 2021                                                          B.1.617.2 (delta)                      2,127 (↑321)              77 (↑3)                     99.4%
Source: https://covid.cdc.gov/covid-data-tracker/#variant-proportions and MDSS
                                                                                                                          * 534 cases within MDOC; ¶ 43 cases with county not yet determined
                                                                                                          Public Health                    Other                                 Science
 National Comparison                         Spread                          Severity
                                                                                                            Response                     Indicators                              Round-up     15
Note: The low number of
   Identified COVID-19 Delta Variants by County                                        specimens recently
                                                                                       submitted for sequencing
     Last week (Sep 3, 2021)                        This week (Sep 13, 2021)           limits the ability to
                                                                                       estimate the prevalence
                                                                                       of variants in Michigan

Data last updated Sep 3, 2021
Source: MDSS

                                                         Public Health      Other              Science
 National Comparison            Spread   Severity
                                                           Response       Indicators          Round-up   16
Number of Outbreaks Reported has Increased
   Number of outbreak investigations by site type, week ending Sep 9
                                                                                                                                                                                                             Visibility1          Easier to identify outbreak
                                                                       Site type          Outbreaks by ongoing/new classification, #                                                                                              Harder to identify outbreak
                                                                                                                                                                   Ongoing            New          Total
                                                                 K-12 SCHOOL                                       37                             71                           108                                               Total number of active
                                SNF/LTC/OTHER ASSISTED LIVING                                                                               70          21         91                                                            outbreaks is up 26% from
                               MANUFACTURING, CONSTRUCTION                                                              43    5    48                                                                                            previous week, with 136 new
                                       CHILDCARE/YOUTH PROGRAM                                                     37     9       46                                                                                             outbreaks identified (26 more
                                                                          *RETAIL                           29     6    35                                                                                                       than last week)
                                                     *SOCIAL GATHERING                               20 4      24
                                            *RESTAURANTS AND BARS                                    18
                                                                                                  15 3
                                                                                              10 3 13
                                                                                                                                                                                                                                 K-12 schools reported the
                                                                            OTHER
                                                                                             7 3 10
                                                                                                                                                                                                                                 greatest number of new
                                                            OFFICE SETTING
                                                                                              8 2 10
                                                                                                                                                                                                                                 outbreaks (71) this week,
                           *COMMUNITY EXPOSURE - OUTDOOR
                                                   COLLEGE/UNIVERSITY                      5 4     9                                                                                                                             and there were an additional
                                                               CORRECTIONS                 5 3    8                                                                                                                              9 new outbreaks in childcare
                                                  *RELIGIOUS SERVICES                       6 1 7                                                                                                                                and youth programs for a
                                                                 HEALTHCARE                  70 7                                                                                                                                total of 80 new outbreaks in
                             AGRICULTURAL/FOOD PROCESSING                                 4 1 5                                                                                                                                  settings primarily with 0-19-
                                                                    *SHELTERS             40 4                                                                                                                                   year-olds.
                               *COMMUNITY EXPOSURE - INDOOR                              30 3
                                                 *PERSONAL SERVICES                      20 2                                                                                                                                    The next greatest number of
                                                                                                                                                                                                      448                        new outbreaks was among
                                                                            TOTAL                                             312                                                  136
                                                                                                                                                                                                                                 SNF/LTC (21), followed by
  1. Based on a setting’s level of control and the extent of time patrons/residents spend in the particular setting, different settings have differing levels of ability to ascertain whether a case derived from that setting   retail (6), manufacturing/
  NOTE: Many factors, including the lack of ability to conduct effective contact tracing in certain settings, may result in significant underreporting of outbreaks. This chart does not provide a complete picture of
                                                                                                                                                                                                                                 construction (5), and nine
  outbreaks in Michigan and the absence of identified outbreaks in a particular setting in no way provides evidence that, in fact, that setting is not having outbreaks.                                                         other settings with at least 1
                                                                                                                                                                                                                                 new outbreak in the last week.
  Source: LHD Weekly Sitreps

                                                                                                                                              Public Health                                        Other                                   Science
National Comparison                                    Spread                                       Severity                                                                                                                                              17
                                                                                                                                                 Response                                      Indicators                                Round-up         17
K-12 school outbreaks, recent and ongoing, week ending Sep 9
    Number of reported outbreaks increased since last week (41 to 108), including increases in High Schools (14 to 44), Middle/Jr High (6 to 17),
    Pre K-Elementary (19 to 39), and Administrative (2 to 4).
                                                                                                          Number of             Range of cases
    Region         Number of reported cases, #                        # Ongoing - Excluding New # New     outbreaks             per outbreak
      Region 1                       86     100                                                                                                                                                           39            2-14
      Region 2n                11     12                                                                                                                                                                   7             2-8
      Region 2s                 17    34                                                                                                                                                                  10            2-14
      Region 3                       80     51                                                                                                                                                            20            2-30
      Region 5                   6    51                                                                                                                                                                  15             2-7
      Region 6                  17    54                                                                                                                                                                  10            2-21
      Region 7                  0     0                                                                                                                                                                    0             0-0
      Region 8                   7    21                                                                                                                                                                   7            2-10
      Total                           224            323                                                                                                                                                108             2-30

                                                                                                                                                                                               Number of          Range of cases
    Grade level                     Number of reported cases, #                                                               # Ongoing - Excluding New                 # New                  outbreaks          per outbreak
    Pre-school - elem.                98     75                                                                                                                                                           39            2-30
    Jr. high/middle school           50 58                                                                                                                                                                18            2-13
    High school                      71 184                                                                                                                                                               47            2-21
    Administrative                   56                                                                                                                                                                    4             2-5
    Total                                  224       323                                                                                                                                                 108            2-30
    Many factors, including the lack of ability to conduct effective contact tracing in certain settings, may result in significant underreporting of outbreaks. This chart does not provide a complete picture
    of outbreaks in Michigan and the absence of identified outbreaks in a particular setting in no way provides evidence that, in fact, that setting is not having outbreaks.
    Source: LHD Weekly Sitreps

                                                                                                                                            Public Health                                        Other               Science
National Comparison                                   Spread                                       Severity                                                                                                                    18
                                                                                                                                               Response                                      Indicators             Round-up
Key Messages: COVID-19 and Healthcare Capacity and COVID Severity

    Hospitalizations and ICU utilization are increasing
     3.5% of ED visits are for COVID diagnosis (up from 3.1% last week)
     Hospital admissions are increasing for most age groups this week
     Hospitalizations up 18% since last week (vs. 5% increase week prior)
     Nearly all regions experienced an increasing in hospitalization trends this week
      ▪ Hospitalization for COVID-19 is highest in Regions 2N, 3, and 6
      ▪ Fastest growth is in Regions 2N, 2S, and 8
     Volume of COVID-19 patients in intensive care has increased 16% since last week (vs. 9% increase last week)

    Death rate is 1.8 daily deaths per million people (up from 1.7% last week)
     One week percent change is up 7% (vs. up 34% last week)
     Death rate has increased six weeks (310% increase since Jul 22 low)
     30-day proportion of deaths among those under 60 years of age is steady from the prior week

                                                                   Public Health            Other               Science
National Comparison        Spread               Severity
                                                                     Response             Indicators           Round-up   19
Michigan Trends in Emergency Department (ED) Visits for COVID-19-Like
         Illness (CLI)

                                                                                                                        3.5%

     •    Trends for ED visits have increased to 3.5% since last week (up from 3.1% week prior)
     •    Trends vary by age groups with all age groups seeing an increase
     •    Over past week, those 50-64 years saw highest number of avg. daily ED CLI visits (4.7%), but those between 25 and 74 all above state average
Source: https://covid.cdc.gov/covid-data-tracker/#ed-visits
                                                                                 Public Health               Other                   Science
National Comparison                            Spread         Severity
                                                                                   Response                Indicators               Round-up   20
Average COVID-19 Hospital Admissions Are Increase for Most Ages

       50

       40

       30

       20

       10

        0
            8/15                                    8/22                            8/29                           9/5                              9/12
              0 - 11             12 - 17      18 - 19      20 - 29        30 - 39     40 - 49        50 - 59   60 - 69           70 - 79   80+        Age
                                                                                                                                                      Unkn

   •    Trends for daily average hospital admissions have increased 13% since last week (vs. 2% increase prior week)
   •    Most age groups experienced a one week increase in daily hospital admissions with largest increases for those over 40
   •    Over the past week, those 60-69 years have seen the highest number of avg. daily hospital admissions (37 admissions)
   Source: CHECC & EM Resource

                                                                                           Public Health                 Other                   Science
National Comparison                        Spread                    Severity                                                                                21
                                                                                                Response             Indicators                  Round-up    21
Average COVID-19 Hospital Admissions Are Increase for Most Ages

                                                                                                                         Peds

   •    Trends for daily average hospital admissions have increased 13% since last week (vs. 2% increase prior week)
   •    Most age groups experienced a one week increase in daily hospital admissions with largest increases for those over 40
   •    Over the past week, those 60-69 years have seen the highest number of avg. daily hospital admissions (37 admissions)
   Source: CHECC & EM Resource

                                                                      Public Health            Other                Science
National Comparison              Spread           Severity                                                                      22
                                                                        Response             Indicators            Round-up     22
Number of Hospital Admissions and Admission Rates Increasing for Most Ages
   Daily new hospital admission per million by age group (7-day rolling average)

              Age                  Average†                      Average† Daily                         One Week
             Group               Daily Hospital                    Hospital                           % Change (Δ #)                 •      Largest one-week growth in numbers of
                                  Admissions                    Admission Rate*                                                             admissions was among those 40-49 years of
          0-17                              3.9                               1.8                            -21% (-1)                      age
          18-19                             1.4                               5.4                               0% (0)               •      Average number of daily hospital admissions
          20-29                            10.9                               7.9                             13% (+1)                      (36.6) are highest for those aged 60-69
          30-39                            13.1                              10.8                            -15% (-2)               •      Average daily hospital admission rate (60.4
                                                                                                                                            hospital admissions/million) are highest for
          40-49                            20.7                              17.6                             36% (+5)
                                                                                                                                            those aged 80+
          50-59                            31.4                              23.3                             12% (+3)
          60-69                            36.6                              28.7                             21% (+6)
                                                                                                                                     Note: for some age groups, small changes in
          70-79                            33.1                              43.2                             15% (+4)
                                                                                                                                     number of hospitalization admissions can cause
          80+                              25.0                              60.4                             23% (+5)               large change in One Week Percent Change. For
          Total¶                          182.1                              18.2                            13% (+21)               example, the 0-17 years age group has a 21%
                                                                                                                                     decline since last week, based on reduction of 1
        * Rate is per 1 million residents; † Rolling 7-day average; ¶ Total may not reflect state due to missing age data
        Note: Case information sourced from MDHHS and reflects date of onset of symptoms
                                                                                                                                     daily admission. Slide 53 provides additional
        Source: MDHHS – Michigan Disease Surveillance System                                                                         context for this group.

                                                                                                                            Public Health                Other                 Science
National Comparison                             Spread                                       Severity                                                                                      23
                                                                                                                             Response                  Indicators             Round-up     23
Statewide Hospitalization Trends: Total COVID+ Census
          Hospitalization Trends 3/1/2021 – 9/13/2021         The COVID+ census in hospitals has
     Confirmed Positive & Persons Under Investigation (PUI)   increased 18% from the last week
                                                              (previous week was up 5%).

                          Confirmed Positive

                                                                 Hospitalized COVID Positive Long Term
                                                                    Trend (beginning March 2020)

                    PUI

                                                                                                         24
Statewide Hospitalization Trends: Regional COVID+ Census
                                                                7/8 regions have increased COVID+
      Hospitalization Trends 3/1/2021 – 9/13/2021               hospital census compared to last week.
             Confirmed Positive by Region
                                                                The fastest growth is in Region 2N, 2S and
                                                    Region 1
                                                    Region 2N
                                                                Region 8.
                                                    Region 2S
                                                    Region 3
                                                    Region 5    Region 2N, 3 and 6 have >150/M
                                                    Region 6
                                                    Region 7
                                                                population hospitalized for COVID.
                                                    Region 8       Region         COVID+               COVID+
                                                                            Hospitalizations (% Δ   Hospitalizations
                                                                              from last week)           / MM
                                                                Region 1          145 (7%)               134/M
                                                                Region 2N        342 (34%)               154/M
                                                                Region 2S        312 (24%)               140/M
                                                                Region 3          176 (5%)               155/M
                                                                Region 5         117 (13%)               123/M
                                                                Region 6         243 (13%)               166/M
                                                                Region 7          56 (0%)                112/M
                                                                Region 8          29 (32%)               93/M
                                                                                                                 25
Statewide Hospitalization Trends: ICU COVID+ Census
                                                    Overall, the census of COVID+ patients in ICUs
      Hospitalization Trends 3/1/2021 – 9/13/2021   has increased by 16% which is similar to last
                Confirmed Positive in ICUs
                                                    week’s growth.

                                                    All regions except Region 7 have increasing ICU
                                                    census, with Regions 1 and 3 at ICU occupancy
                                                    over 85%. Region 1 and 6 have >20% of ICU
                                                    beds occupied with COVID+ patients.
                                                      Region    Adult COVID+ in   Adult ICU   % of Adult ICU
                                                                 ICU (% Δ from    Occupancy   beds COVID+
                                                                   last week)
                                                    Region 1        41 (5%)         88%           24%
                                                    Region 2N      84 (24%)         75%           15%
                                                    Region 2S      91 (21%)         81%           13%

                  Confirmed                         Region 3       47 (24%)         91%           14%
                  Positive in ICU                   Region 5       33 (22%)         65%           18%
                                                    Region 6       66 (14%)         76%           28%
                                                    Region 7       25 (-7%)         74%           16%
                                                    Region 8       12 (20%)         69%           19%

                                                                                                         26
Average and total new deaths, by age group
       Daily confirmed and probable deaths per million by                                                             Total confirmed and probable deaths by age group
       age group (7 day rolling average)                                                                              (past 30 days, ending 9/6/2021)

       20               0-19                40-49                70-79                                            •     25% of deaths below age sixty
                        20-29               50-59                80+                                                                                                           157
                        30-39               60-69                Total
                                                                                                                                                                        143
       15

       10                                                                                                                                                       82

                                                                                                                                                        67

        5                                                                                                                                      31

                                                                                                                                       18
                                                                                                                              9
                                                                                                                  1-5
        0
            6/13         6/27            7/11            7/25             8/8            8/22               9/5   0-19      20-29     30-39   40-49    50-59   60-69   70-79   80+

   •    Overall trends for daily average deaths are increasing since last week
   •    Through 9/6, the 7-day avg. death rate is more than 6.0 daily deaths per million people for those over the age of 70
   Note: Death information sourced from MDHHS and reflects date of death of confirmed and probable cases.
   Source: MDHHS – Michigan Disease Surveillance System

                                                                                                                      Public Health                 Other                 Science
National Comparison                               Spread                                   Severity                                                                                  27
                                                                                                                       Response                 Indicators               Round-up    27
30-day rolling average daily deaths per million people by race and
    ethnicity
            Average daily deaths per million people by race                                                        Average daily deaths per million people by
                                                                                                                   ethnicity
              6                                                                                                    6
                            American Indian/Alaska Native                     Black/African American                         Hispanic or Latino      Not Hispanic or Latino
                            Asian/Pacific Islander                            White

              4                                                                                                    4

              2                                                                                                    2

              0                                                                                                    0
                  7/1              7/15                7/29               8/12               8/26            9/9       7/1        7/15            7/29           8/12         8/26         9/9
    •     Additional reviews of vital records death data were performed the weeks of 7/6 and 8/9 to search for race and ethnicity
    •     This review has resulted in an adjustment of deaths for American Indian and Alaskan Natives from previous weeks
    •     Currently, American Indian/Alaskan Natives have the highest death rate

    Note: Death information sourced from MDHHS and reflects date of death of confirmed and probable cases.
    Source: MDHHS – Michigan Disease Surveillance System

                                                                                                                   Public Health                         Other                       Science
National Comparison                               Spread                                   Severity                                                                                              28
                                                                                                                    Response                       Indicators                        Round-up
•   `

    COVID-19 Vaccination
       Administration (doses administered)
       •   5,357 first doses administered each day (7-day rolling average*)
       •   Most administered frequently by pharmacies, local health departments, and hospitals
       •   More than 50,000 third doses administered since third dose recommendation for immunocompromised individuals
       Coverage (people vaccinated)
       5.1 million people in the state are fully vaccinated
       83.1% of people aged 65 and older have completed the series (+0.2%)
       55.9% of total population initiated (+0.4%)
       •   67.2% (+0.5) of aged 18+ have had first dose of vaccine; 87.6% (+0.3) of aged 65+ have had first dose
       •   5,119,223 people in Michigan have completed vaccination series (5,070,925 and 5,040,341 in last 2 weeks)
       •   Initiation highest among Asian, Native Hawaiian or Pacific Islander and American Indian/Alaskan Native
           individuals (MI COVID Vaccine Dashboard 9/14/21)
       •   Less than 1% of Vaccinated Individuals Later Tested Positive for COVID-19 (Number of cases who are fully
           vaccinated (n= 24,603)

*https://covid.cdc.gov/covid-data-tracker/#vaccination-trends_vacctrends-onedose-daily

                                                                        Public Health            Other              Science
National Comparison          Spread                  Severity
                                                                         Response            Indicators             Round-up   29
•    `

     Average daily doses administered declining (data through 9/14/2021)

 13,167,470 doses delivered to providers and 10,352,589
 doses administered*

 MI 7-day rolling average ending September 14th
 • 9,011 total doses/day on average †
 • 3,527 first doses/day on average †

 Total primary series doses (between 9/5-9/11) were most
 frequently administered¶ by:
 Pharmacies (37.9K)
 LHD (3.7K) and hospitals (3.7K)
 Family practice (2.2K), FQHCs (1.8K), and Pediatric (885)

 Third Doses
 • 50,206 third doses administered to date

    Source: *CDC COVID Data Tracker > Vaccinations in the US, † CDC COVID Data Tracker > Vaccination Trends; ¶ MCIR COVID-19 Vaccine Dashboard

                                                                                                                         Public Health             Other      Science
National Comparison                            Spread                                 Severity
                                                                                                                            Response             Indicators   Round-up   30
Over 5 Million Michiganders fully vaccinated and 51.3% of total population fully
   vaccinated
                                                                                                      Vaccination Coverage in Michigan as of 9/14/21

           5.12 million people in the state are fully
           vaccinated*                                                                               Age Group           % At Least     % Fully    Number Fully
                                                                                                                         One Dose     Vaccinated    Vaccinated
           83.1% of people aged 65 and older have
           completed the series (+0.2%)*                                                          Total Population         55.9%        51.3%       5,119,223
           55.9% of total population initiated (+0.4%)*
                                                                                                  ≥ 12 years               65.0%        59.6%       5,119,111
           50,206 additional doses¶
                                                                                                  ≥ 18 years               67.2%        61.8%       4,846,788
           Race/Ethnicity¶ for those 12 years and older:
           •      Initiation coverage highest among those of                                      ≥ 65 years               87.6%        83.1%       1,467,812
                  Non-Hispanic (NH) Asian, Native Hawaiian
                  or Pacific Islander Race (55.0%), then NH
                  American Indian (52.5%), NH White
                  (48.0%), NH Black or African American
                  Races (37.5%).
           •      Initiation is at 49.9% for those of Hispanic
                  ethnicity
           •      Completion follows the same pattern

           •     19.5% data missing or unknown

    Source: *CDC COVID Data Tracker > Vaccinations in the US, ¶ MCIR COVID-19 Vaccine Dashboard

                                                                                                               Public Health            Other            Science
National Comparison                            Spread                                Severity
                                                                                                                Response              Indicators        Round-up   31
`

    Potential COVID-19 Vaccination Breakthrough Cases
    Michigan part of CDC’s nationwide investigation (COVID-19 Breakthrough Case Investigations and Reporting | CDC)

    Michigan Data (1/1/21 through 9/7/21):
    •   24,603 cases met criteria based on a positive test 14 or more days after being fully vaccinated
    •    Less than 1% of people who were fully vaccinated met this case definition
        • Includes 330 deaths (291 in persons ages 65 years or older)
        • 1,043 cases were hospitalized

    •   Vaccine breakthrough cases are expected. COVID-19 vaccines are effective and are a critical tool to bring the pandemic under control.
        However, no vaccines are 100% effective at preventing illness. Some fully vaccinated people will get sick, and some will even be
        hospitalized or die from COVID-19. However, there is evidence that vaccination may make illness less severe for those who are
        vaccinated and still get sick. The risk of infection, hospitalization, and death are all much lower in vaccinated compared to unvaccinated
        people.
    •   More than 173 million people in the United States have been fully vaccinated as of August 30, 2021. Like with other vaccines, vaccine
        breakthrough cases will occur, even though the vaccines are working as expected. Asymptomatic infections among vaccinated people will
        also occur.
    •   Current data suggest that COVID-19 vaccines authorized for use in the United States offer protection against most SARS-CoV-2 variants
        circulating in the United States. However, variants will cause some vaccine breakthrough cases.

                                                                                 Public Health                 Other                    Science
National Comparison             Spread                   Severity
                                                                                   Response                 Indicators                Round-up       32
Update on breakthrough
     cases

                                          Public Health     Other      Science
National Comparison   Spread   Severity
                                           Response       Indicators   Round-up   33
Cumulative COVID-19 Cases by Vaccination Status, Michigan, Jan 15 – Sep 7
                                                                                 Fully Vaccinated People (4,756,092)
                                         Cases                                                      Hospitalization                                                            Deaths
                   Percent of Cases In People Not                                 Percent of Hospitalizations In People                                  Percent of Deaths In People Not
                          Fully Vaccinated                                                Not Fully Vaccinated                                                  Fully Vaccinated
                                 (434,438 / 459,041)                                                   (12,209 / 13,252)                                                   (4,984 / 5,314)
                                         94.6%                                                              92.1%                                                               93.8%
                                       434,438                                                              12,209                                                              4,984
                         Total Cases Not Fully Vaccinated                                Total Hospitalized Not Fully Vaccinated                               Total Deaths Not Fully Vaccinated

                        Total Breakthrough Cases                                   Total Breakthrough Hospitalizations                                        Total Breakthrough Deaths
                                  24,603                                                          1,043                                                                  330
                                        0.517%                                                             0.022%                                                             0.007%
                    Percent of Fully Vaccinated People who                          Percent of Fully Vaccinated People Who Were                       Percent of Fully Vaccinated People Who Died of
                   Developed COVID-19 (24,603 / 4,756,092)                          Hospitalized for COVID-19 (1,043 / 4,756,092)                              COVID-19 (330 / 4,756,092)

                                          5.4%                                                               7.9%                                                                6.2%
                 Percent of Cases Who Were Fully Vaccinated                           Percent of Hospitalizations Who Were Fully                       Percent of Deaths Who Were Fully Vaccinated
                              (24,603 / 459,041)                                             Vaccinated (1,043 / 13,252)                                               (330 / 5,314)

                            Total Cases: 459,041                                        Total Hospitalizations: 13,252                                              Total Deaths: 5,314
Michigan Disease Surveillance System may underestimate the frequency of COVID-19 hospitalizations:
- Case investigation and follow-up is more difficult for individuals who get vaccinated (e.g., they are too ill to speak to investigators, don’t answer their phone, or otherwise).
- These hospitalizations include individuals who are hospitalized for issues other than COVID19 (the same as breakthrough COVID-19).
- Individuals who get hospitalization will lag after infection and may occur after case investigation.

                                                                                                                        Public Health                                Other                     Science
National Comparison                              Spread                               Severity
                                                                                                                           Response                               Indicators                 Round-up    34
Trends in Breakthrough Cases, Hospitalizations, and Deaths
                                                                            30%
       •    51.3% of the population is fully
                                                                                                                                                                                               26%
            vaccinated yet only account for ~20-                                                                                                                                                                   25%
                                                                                                                                                                                           24%       24%        25%
            25% of cases, hospitalizations, and                             25%                                                                                                                         24%
                                                                                                                                                                              23%
            deaths                                                                                                                                                                       21%

       •    As the fully vaccinated population                              20%
                                                                                                                                                                                                          20%
                                                                                                                                                                                                                      19%
                                                                                                                                                                                   18%
            has increased, so have the percent
            of breakthrough incidents; but
                                                                            15%
            breakthrough burden remains lower
                                                                                                                                                                 12%       12%
                                                                                                                                                              11%

                                                                            10%
       In the last 30 days (Aug 9 – Sep 7),
       11,940 (25%) of 48,664 cases, 275                                                                                                         5%
       (25%) of 1,095 hospitalizations, and 35                                5%                                                            5%             5%

       (19%) of 184 deaths were among fully                                                                                 2% 1%      2%
       vaccinated individuals                                                          0% 0% 0%        0% 0% 0%
                                                                                                                       1%

                                                                              0%
                                                                                       January        February          March            April                May            June          July      August       Last 30
                                                                                                                                                                                                                   days
                                                                                                                                       Cases          Hospitalizations    Deaths

Michigan Disease Surveillance System may underestimate the frequency of COVID-19 hospitalizations:
- Case investigation and follow-up is more difficult for individuals who get vaccinated (e.g., they are too ill to speak to investigators, don’t answer their phone, or otherwise).
- These hospitalizations include individuals who are hospitalized for issues other than COVID19 (the same as breakthrough COVID-19).
- Individuals who get hospitalization will lag after infection and may occur after case investigation.

                                                                                                                        Public Health                                      Other                        Science
National Comparison                              Spread                               Severity
                                                                                                                            Response                                     Indicators                    Round-up     35
`

     COVID-19 Vaccination Breakthrough Cases and Deaths
     1200   Breakthrough Case Rate vs. Not Fully Vaccinated                                   Breakthrough Death Rate vs. Not Fully Vaccinated Death
                             Case Rate                                                                                Rate
     1000                                      Case Rate among Fully Vaccinated
                                                                                      12
                                               Case Rate among Not Fully Vaccinated
      800                                                                             10

                                                                                      8
      600
                                                                                      6
      400
                                                                                      4
      200
                                                                                      2

        0                                                                             0
         1/25   2/25   3/25    4/25     5/25       6/25      7/25       8/25           1/25       2/25     3/25   4/25    5/25     6/25    7/25        8/25

 •   Trends over time show that both case and death rates among the Fully Vaccinated are lower than the Not Fully vaccinated rates in Michigan
 •    The proportion of breakthrough cases and deaths among all cases and deaths has shown some increases as more people become fully
      vaccinated
     • However, the risk of infection and death remains significantly lower among the fully vaccinated

                                                                                           Public Health             Other                   Science
National Comparison            Spread                         Severity
                                                                                            Response               Indicators              Round-up       36
Other Public Health
  Indicators

                                          Public Health   Other   Science
National Comparison   Spread   Severity                                     37
Other Public Health Indicators
  Disparities in influenza vaccine coverage by race – 2021
  •    Data for influenza vaccination coverage for children, adolescents, and adults in 2020-2021 season as compared to 2019-2020 season.
      • The timeline for the baseline influenza season considered in this report is July 1st, 2019 - June 30th, 2020 (2019-2020 season)
      • The timeline for the comparison influenza season considered in this report is July 1st, 2020 - June 30th, 2021 (2020-2021 season)

  •   There was an overall increase in flu vaccination coverage in 2020-2021 as compared to 2019-2020 and for all the races

  •    Influenza vaccination coverage rates were disproportionately lower in Black individuals as compared to those of other races in
       both 2019-2020 and 2020-2021
      • This was seen among all age groups

  •   There was a decrease in flu vaccination coverage rates for children aged 6 months through 8 years in 2020-2021

                                                                            Public Health               Other                  Science
National Comparison             Spread                 Severity
                                                                              Response                Indicators              Round-up   38
Influenza Vaccination Coverage for 2020-2021 was higher than the 2019-
  2021 (all ages)
   • Influenza vaccination coverage for
     children, adolescents, and adults
     in 2020-2021 influenza season
     and 2019-2020 influenza season
   • There was an increase in flu
     vaccination coverage in 2020-21
     as compared to 2019-20 for
     individuals of all racial groups
     and for most age groups
        • Overall increase in coverage
          across each races group is in line
          with a statewide increase of 7%
        • Coverage rates were lower for
          Black individuals as compared to
          the other racial groups

                                                          Public Health     Other      Science
National Comparison       Spread               Severity
                                                           Response       Indicators   Round-up   39
Influenza vaccine coverage increased for adults during 2020-2021 flu
  year
   • There was an increase in
     adult flu vaccination
     coverage in 2020-2021 as
     compared to 2019-2020
     overall and for
     individuals of all racial
     and age groups
   • Those 65 and older and
     those who were white had
     the highest vaccination
     coverage among adults
   • Adults who were under 50
     and Black adults had the
     lowest flu vaccination
     coverage

                                            Public Health     Other      Science
National Comparison   Spread     Severity
                                             Response       Indicators   Round-up   40
Influenza vaccine coverage remained the same for all children and
  adolescents (6 months – 17 years) for the 2020-2021 flu year
   • There was little shift in flu
     vaccination coverage for
     children and adolescents (6
     months – 17 years) in 2020-
     2021 as compared to 2019-
     2020 overall and for all racial
     groups
        • On average, shifts between the
          two years were
Influenza vaccine coverage decreased for children 6 months through 8
  years for the 2020-2021 flu year
                                          • Flu vaccination coverage declined
                                            in 2020-2021 as compared to 2019-
                                            2020 for children aged 6 months
                                            to 8 years overall and across
                                            most racial groups
                                             • Overall, influenza vaccine coverage
                                               fell ~2%
                                             • Coverage rates were highest for
                                               individuals of Native Hawaiian/Asian
                                               race, and increased slightly from
                                               43.9% to 44.3% for this group
                                             • Coverage rates were lowest in children
                                               of Black race as compared to children
                                               in other racial groups

                                          Public Health      Other         Science
National Comparison   Spread   Severity
                                           Response        Indicators      Round-up   42
Science Round Up
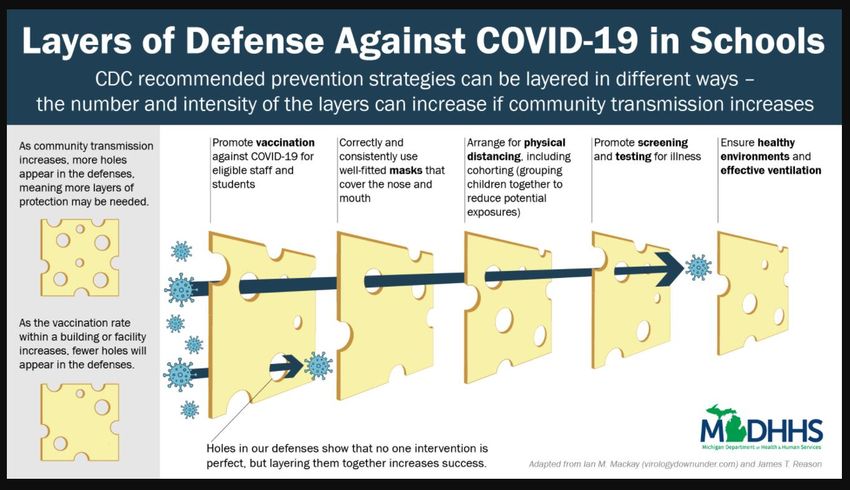
  Deeper look at trends: What happening in other states and comparison to past surges
  •   Average daily incidence per 100,000 cases in Michigan is currently lower than other states, including other Midwestern states, experiencing a surge in delta
      cases
  •   Ridge regression model projects continued increases for Michigan although case trends may be slowing
  •   CDC models project continued increases in hospitalizations and deaths, although cases projected to plateau
  What do we know about COVID in children and schools
  •   Children in Michigan can get infected with SARS-CoV-2 and spread the virus to others in the classroom setting
  •   The proportion of kids getting sick with COVID-19 is increasing
  •   Missed in person school negatively impacts children and can occur large uncontrolled outbreaks within schools
  •   Children can experience severe health outcomes from COVID-19 including MIS-C and Hospitalization
  •   Many of those who experience MIS-C in Michigan are admitted to intensive care, school age, and are Black/African American
  Importance of Continue Mitigation
  •   Correctly and consistently implementing layered prevention strategies are the best way to prevent uncontrolled spread of SARS-CoV-2
  •   43% of Michigan school districts have mandatory mask policy for students in all K-12 grades
  •   School districts with mandatory mask policies for all grades K-12 cover 60% of all students in Michigan
  •   Case rates among children are higher in counties where school districts do not have mask policies

                                                                                       Public Health                    Other                    Science
National Comparison                Spread                     Severity
                                                                                         Response                     Indicators                Round-up     43
Deeper look at trends: What is
    happening in other states and
    COVID forecasts for Michigan

                                          Public Health     Other      Science
National Comparison   Spread   Severity
                                           Response       Indicators   Round-up
COVID-19 Case Rates: States with High Delta Comparison
                                                                                                                                      •         Average daily incidence per
                                           Seven-day moving average of new cases per 100K
                                                                                                                                                100,000 cases in Michigan is
                  150                                                                                                                           currently lower than other
                                                                                                                                                states experiencing a surge in
                                                                                                                            TN                  delta cases
                                                                                                                                      •         Several states impacted by
                                                                                                                                                delta are beginning to see a
                  100                                                                                                                           decline in case rate
                                                                                                                                      •      A few states are seeing
      Case Rate

                                                                                                                                             rebound after that decline
                                                                                                                                            • Including LA and TN

                   50                                                                                                       LA      150
                                                                                                                                                                                    TN

                                                                                                                            MI      100

                    0                                                                                                                                                               LA
                        3/1   5/1            7/1             9/1        11/1      1/1      3/1        5/1     7/1     9/1            50

                                              Georgia              Arkansas     Florida      Louisiana
                                              Michigan             Tennessee    Missouri     Nevada
                                                                                                                                                                                    MI
                                                                                                                                      0
   Source: CDC COVID Data Tracker – State Trend Comparison                                                                                7/1     7/15   7/29   8/12   8/26   9/9

                                                                                                      Public Health                Other                          Science
National Comparison                            Spread                          Severity                                                                                       45
                                                                                                         Response                Indicators                      Round-up     45
COVID-19 Case Rates: Midwest Comparison

    •    Average daily incidence per
         100,000 cases in Michigan is
         currently lower than other
         Midwestern states experiencing
         a surge in delta cases

   Source: CDC COVID Data Tracker – State Trend Comparison

                                                                        Public Health     Other      Science
National Comparison                            Spread        Severity                                           46
                                                                         Response       Indicators   Round-up   46
COVID-19 Case Rates: Midwest Comparison (Cumulative Numbers)

    •    Average daily incidence per
         100,000 cases in Michigan is
         currently lower than other
         Midwestern states experiencing
         a surge in delta cases
    •    This pattern is reflected in the
         cumulative case numbers as
         well

   Source: CDC COVID Data Tracker – State Trend Comparison

                                                                        Public Health     Other      Science
National Comparison                            Spread        Severity                                           47
                                                                         Response       Indicators   Round-up   47
Ridge regression
model projects
continued increases
for Michigan
• Model projects slowing increase in cases
  and continued increase in deaths
• Uncertainty range includes potential for
  sustained or slowed growth
• Cases and deaths are also projected to
  continue increasing across the Midwest
  (not shown)
•   Line is the ridge regression model projection, and
    the shaded region represents the 95%
    confidence region (2.5% and 97.5% quantiles).
•   Projections are based on previous data on cases,
    hospitalizations, and deaths, as well as data on
    mobility and vaccinations.
•   Cases are plotted by report date.
•   For full projections, see dataepi.org                Sources: Data from MDHHS/JHU,
                                                             UM Ridge Regression Model
CDC models project continued                                                As of 6-Sep-2021
increases in hospitalizations and
deaths for Michigan, while cases
are predicted to plateau

As of 6-Sep-2021

                                                               As of 6-Sep-2021

            Data Sources: CDC mathematical model
            forecasting, CovidComplete Data Center model
            forecast evaluations. Individual models shown as
            grey lines, ensemble shown in red
What do we know about
     COVID-19 impact on
     Michigan schools

                                          Public Health     Other      Science
National Comparison   Spread   Severity
                                           Response       Indicators   Round-up
SARS-CoV-2 can Negatively Impact Children Directly and Indirectly
 ➢ Children can get infected with SARS-CoV-2 and the proportion of kids getting sick with COVID-19 is increasing
                20%                                                                        Cumulative
                                                                                           Last Month
                                                                                                                      •     The proportion of cases among 0-9 in the last 30 days is
                15%
                                                                                                                            double what it’s been for the entire pandemic in Michigan
                                                                                                                      •     10-19-year-olds also seeing a larger proportion of cases
                10%
                                                                                                                            compared to older age groups in Michigan
                 5%

                 0%
                         0-9     10-19    20-29    30-39    40-49     50-59    60-69    70-79     80+

 ➢ Children can transmit the virus to others and can be sources for outbreaks
                                                                                                                                                                    A school outbreak consists of
                                                                                                                                                                    two or more COVID-19 cases
                                                                                                                                                                    (e.g., students, teachers, staff)
                                                                                                                                                                    who were exposed in a school
                                                                                                                                                                    setting and whose infection
                                                                                                                                                                    cannot be attributed to another
                                                                                                                                                                    setting (e.g., home, retail, etc.)

Sources: Case data: MDSS; 18 mid-Michigan schools experiencing COVID-19 outbreaks; 3 new COVID-19 school outbreaks reported in Oakland County; 12 cases confirmed

                                                                                                         Public Health                                     Other                Science
National Comparison                                          Spread
                                                                                                            Response                                   Indicators              Round-up
SARS-CoV-2 can Negatively Impact Children Directly and Indirectly

  •     Missed in person school negatively impacts children and can occur large uncontrolled outbreaks within
        schools
            •     28 Schools in Michigan reported with 30 classrooms or entire grades in quarantine

  •     Children can experience severe health outcomes from COVID-19 including MIS-C, Hospitalization, and Death
            •     A JAMA study reported MIS-C incidence was 5.1 persons per 1,000,000 person-months and 316 persons
                  per 1,000,000 SARS-CoV-2 infections in persons younger than 21 years
            •     Incidence was higher among Black, Hispanic or Latino, and Asian or Pacific Islander persons compared
                  with White persons and in younger persons compared with older persons

Sources: Verlenden JV, Pampati S, Rasberry CN, et al. Association of Children’s Mode of School Instruction with Child and Parent Experiences and Well-Being During the COVID-19 Pandemic — COVID Experiences Survey, United States, October 8–
November 13, 2020. MMWR Morb Mortal Wkly Rep 2021;70; Payne AB, et al. Incidence of Multisystem Inflammatory Syndrome in Children Among US Persons Infected With SARS-CoV-2. JAMA Netw Open. 2021;4(6); Baldwin Community Schools

                                                                                                             Public Health                                      Other                                        Science
 National Comparison                                           Spread
                                                                                                                Response                                     Indicators                                    Round-up
SARS-CoV-2 can Negatively Impact Children Directly and Indirectly
  •     Children can experience severe health outcomes from COVID-19 including MIS-C and Hospitalization
           •     Hospitalizations among children nationwide is higher than it’s ever been*
           •     In Michigan, hospitalizations for 0-17 years are not at all time highs but are generally increasing since July
      United States Hospital Admissions | 0 -17 years                                       Michigan Hospital Admissions | 0 -17 years

            Note: Gray bar indicates lag period where data may be updated

Sources: * CDC COVID Data Tracker > New Hospital Admissions; † COVIDNET

                                                                            Public Health                Other                  Science
National Comparison                                            Spread
                                                                             Response                  Indicators              Round-up
SARS-CoV-2 can Negatively Impact Children Directly and Indirectly
  •     Children can experience severe health outcomes from COVID-19 including MIS-C and Hospitalization
           •     Nationally, nearly half of children hospitalized have no reported underlying conditions†
           •     In Michigan, over 50% of children hospitalized have not reported underlying conditions
U.S. Pediatric Hospitalizations | Underlying Medical Conditions                                MI Pediatric Hospitalizations | Underlying Medical Conditions
                                                                                                      Proportion of Medical Conditions Among Pediatric COVID-NET Cases (N=112)
                                                                                               100

                                                                                                80

                                                                                                                                                                                 52.7%

                                                                                  Percentage
                                                                                                60
                                                                          46.0%
                                                                                                40

                                                                                                20

                                                                                                 0

Sources: * CDC COVID Data Tracker > New Hospital Admissions; † COVIDNET

                                                                           Public Health                               Other                                  Science
 National Comparison                                       Spread
                                                                            Response                                Indicators                              Round-up
SARS-CoV-2 can Negatively Impact Children Directly and Indirectly
      Multisystem Inflammatory Syndrome in Children (MIS-C)
       • Higher community transmissions is followed by higher incidence of MIS-C cases

Source: MDHHS and MIS-C Data and Reporting

                                                          Public Health            Other      Science
        National Comparison                  Spread
                                                            Response             Indicators   Round-up
SARS-CoV-2 can Negatively Impact Children Directly and Indirectly
      Multisystem Inflammatory Syndrome in Children (MIS-C)
       • Higher community transmissions is followed by higher incidence of MIS-C cases
                   •    Many of those who experience MIS-C in Michigan are admitted to intensive care, school age, and are
                        Black/African American

Source: MDHHS and MIS-C Data and Reporting

                                                                    Public Health             Other                 Science
        National Comparison                   Spread
                                                                      Response              Indicators             Round-up
Why do we still need
     mitigation measures?

                                          Public Health     Other      Science
National Comparison   Spread   Severity
                                           Response       Indicators   Round-up
MI School Districts and Mask Policy as of Sept 10, 2021
      Yes – Any masking policy in some subset of school grades
      No – No mask policies (includes unknown)

                           NUMBER OF SCHOOL DISTRICTS                                                       NUMBER OF STUDENTS* IN K-12
                            WITH MASK MANDATES IN K-12                                                     SCHOOLS WITH MASK MANDATES
                                     SETTING

                                                                                                       No, 496280
                                                                         Yes, 229

                                                                                                                                                       Yes,
                            No, 304
                                                                                                                                                      756528

•     43% (229/533) of school districts have mandatory mask policy for students in all K-12 grades
•     School districts with mandatory mask policies for all grades K-12 cover 60% (756,528/1,252,808) of all students*

    * Student size based on school enrollment numbers; Buses and public transportation are federally required to enforce mask mandates
      Source: Executive Office of Governor School District Mask Policy

                                                                                                     Public Health                         Other               Science
National Comparison                                  Spread                   Severity
                                                                                                        Response                         Indicators            Round-up
Age group
School reopening: cases in                                                                            0-11   12-18   19-30   31-50   51-65   >65
children are increasing and                                           Change in 7-day avg. new
                                                                      cases during school reopening   +57%   +96%    +12%    +5%     -2%     +3%
case rates are higher in                                              period (Aug 18 – Sep 8)

counties where school
districts without masking
• Over the course of school
  reopening period (Aug 18 – Sep 8,
  from earliest to latest first day of
  school), the largest % increases
  have been among those
You can also read