COVID-19 vaccine surveillance report - Week 40 - GOV.UK
←
→
Page content transcription
If your browser does not render page correctly, please read the page content below
COVID-19 vaccine surveillance report
Week 40

COVID-19 vaccine surveillance report – week 40

Contents
Summary...................................................................................................................................... 3
   Vaccine effectiveness ............................................................................................................... 3
   Population impact ..................................................................................................................... 3
Vaccine effectiveness .................................................................................................................. 4
   Effectiveness against symptomatic disease ............................................................................. 4
   Effectiveness against hospitalisation ........................................................................................ 5
   Effectiveness against mortality ................................................................................................. 5
   Effectiveness against infection ................................................................................................. 5
   Effectiveness against transmission .......................................................................................... 6
Population impact ........................................................................................................................ 8
   Vaccine coverage ..................................................................................................................... 8
   Vaccination status .................................................................................................................. 11
   Vaccine impact on proportion of population with antibodies to COVID-19.............................. 19
   Summary of impact on hospitalisations, infections and mortality ............................................ 24
References................................................................................................................................. 25

                                                                      2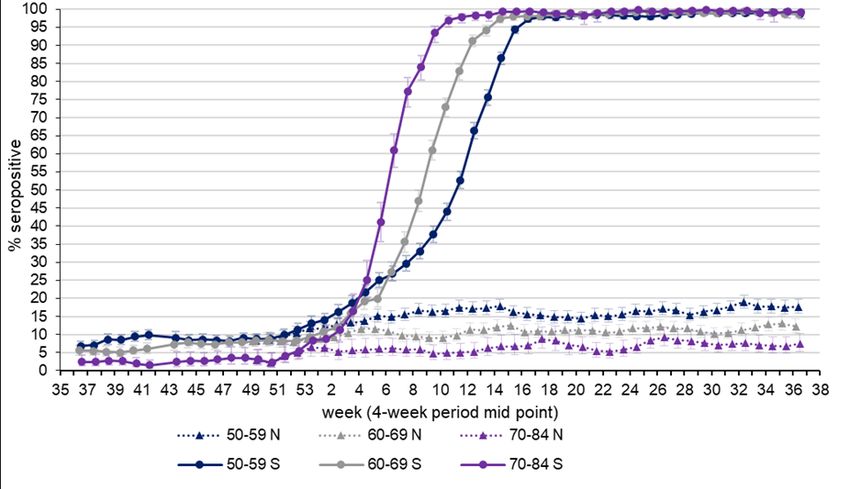
COVID-19 vaccine surveillance report – week 40

Summary
Four coronavirus (COVID-19) vaccines have now been approved for use in the UK. Rigorous
clinical trials have been undertaken to understand the immune response, safety profile and
efficacy of these vaccines as part of the regulatory process. Ongoing monitoring of the vaccines
as they are rolled out in the population is important to continually ensure that clinical and public
health guidance on the vaccination programme is built upon the best available evidence.
UK Health Security Agency, UKHSA, formerly Public Health England (PHE), works closely with
the Medicines and Healthcare Regulatory Agency (MHRA), NHS England, and other
government, devolved administration and academic partners to monitor the COVID-19
vaccination programme. Details of the vaccine surveillance strategy are set on the page
COVID-19: vaccine surveillance strategy (1). As with all vaccines, the safety of COVID-19
vaccines is continuously being monitored by the MHRA. They conclude that overall, the benefits
of COVID-19 vaccines outweigh any potential risks (2).

Vaccine effectiveness
Several studies of vaccine effectiveness have been conducted in the UK which indicate that 2
doses of vaccine are between 65 and 95% effective at preventing symptomatic disease with
COVID-19 with the Delta variant, with higher levels of protection against severe disease
including hospitalisation and death. There is some evidence of waning of protection against
infection and symptomatic disease over time, though protection against severe disease remains
high in most groups at least 5 months after the second dose.

Population impact
The impact of the vaccination programme on the population is assessed by taking into account
vaccine coverage, evidence on vaccine effectiveness and the latest COVID-19 disease
surveillance indicators. Vaccine coverage tells us about the proportion of the population that
have received 1 and 2 doses of COVID-19 vaccines. By 3 October 2021, the overall vaccine
uptake in England for dose 1 was 65.3% and 60.1% for dose 2. In line with the programme
rollout, coverage is highest in the oldest age groups.
We present data on COVID-19 cases, hospitalisations and deaths by vaccination status.
Based on antibody testing of blood donors, 98.0% of the adult population now have antibodies
to COVID-19 from either infection or vaccination compared to 19.0% that have antibodies from
infection alone. Over 96% of adults aged 17 or older have antibodies from either infection or
vaccination.

                                                 3
COVID-19 vaccine surveillance report – week 40
Vaccine effectiveness
Large clinical trials have been undertaken for each of the COVID-19 vaccines approved in the
UK which found that they are highly efficacious at preventing symptomatic disease in the
populations that were studied. The clinical trials have been designed to be able to assess the
efficacy of the vaccine against laboratory confirmed symptomatic disease with a relatively short
follow up period so that effective vaccines can be introduced as rapidly as possible.
Nevertheless, understanding the effectiveness against different outcomes (such as severe
disease and onwards transmission), effectiveness in different subgroups of the population and
understanding the duration of protection are equally important in decision making around which
vaccines should be implemented as the programme evolves, who they should be offered to and
whether booster doses are required.
Vaccine effectiveness is estimated by comparing rates of disease in vaccinated individuals to
rates in unvaccinated individuals. Below we outline the latest real-world evidence on vaccine
effectiveness from studies in UK populations. We focus on data related to the Delta variant
which is currently dominant in the UK. The findings are also summarised in Table 1.
Effectiveness against symptomatic disease
Vaccine effectiveness against symptomatic COVID-19 has been assessed in England based on
community testing data linked to vaccination data from the National Immunisation Management
System (NIMS), cohort studies such as the COVID Infection Survey and GP electronic health
record data. After 2 doses, observed vaccine effectiveness against symptomatic disease with
the Delta variant reaches approximately 65 to 70% with AstraZeneca Vaxzevria and 80 to 95%
with Pfizer-BioNTech Comirnaty and Moderna Spikevax (3, 4) Vaccine effectiveness is
generally slightly higher in younger compared to older age groups. With both Vaxzevria and and
Comirnaty, there is evidence of waning of protection over time, most notably among older
adults. There is not yet enough follow-up with Spikevax to assess waning (3).
Data (based primarily on the Alpha variant) suggest that in most clinical risk groups, immune
response to vaccination is maintained and high levels of VE are seen with both the Pfizer and
AstraZeneca vaccines. Reduced antibody response and vaccine effectiveness were seen after
1 dose of vaccine among the immunosuppressed group, however, after a second dose the
reduction in vaccine effectiveness is smaller (5).
Analyses by dosing interval suggest that immune response to vaccination and vaccine
effectiveness against symptomatic disease improves with a longer (greater than 6 week
interval) compared to a shorter interval of 3 to 4 weeks (6, 3)
4COVID-19 vaccine surveillance report – week 40
Effectiveness against hospitalisation
Several studies have estimated vaccine effectiveness against hospitalisation in older all of
which indicate higher levels of protection against hospitalisation with all vaccines against the
Alpha variant (7, 8, 9, 10). Effectiveness against hospitalisation of over 90% is also observed
with the Delta variant with all 3 vaccines (3). In most groups there is relatively limited waning of
protection against hospitalisation over a period of at least 5 months after the second dose.
Greater waning appears to occur among those in clinical risk groups (3).
Effectiveness against mortality
High levels of protection (over 90%) are also seen against mortality with all 3 vaccines and
against both the Alpha and Delta variants (7, 11, 3). Relatively limited waning of protection
against mortality is seen over a period of at least 5 months.
Effectiveness against infection
Although individuals may not develop symptoms of COVID-19 after vaccination, it is possible
that they could still be infected with the virus and could transmit to others. Understanding how
effective vaccines are at preventing infection is therefore important to predict the likely impact of
the vaccination programme on the wider population. In order to estimate vaccine effectiveness
against infection, repeat asymptomatic testing of a defined cohort of individuals is required.
Studies have now reported on vaccine effectiveness against infection in healthcare workers,
care home residents and the general population (12, 13, 14, 15). With the delta variant, vaccine
effectiveness against infection has been estimated at around 65% with Vaxzevria and 80% with
Comirnaty (4).
5COVID-19 vaccine surveillance report – week 40
Effectiveness against transmission
As described above, several studies have provided evidence that vaccines are effective at
preventing infection. Uninfected individuals cannot transmit; therefore, the vaccines are also
effective at preventing transmission. There may be additional benefit, beyond that due to
prevention of infection, if some of those individuals who become infected despite vaccination
are also at a reduced risk of transmitting (for example, because of reduced duration or level of
viral shedding). A household transmission study in England found that household contacts of
cases vaccinated with a single dose had approximately 35 to 50% reduced risk of becoming a
confirmed case of COVID-19. This study used routine testing data so would only include
household contacts that developed symptoms and went on to request a test via pillar 2. It
cannot exclude asymptomatic secondary cases or mildly symptomatic cases who chose not to
request a COVID-19 test (16). Data from Scotland has also shown that household contacts of
vaccinated healthcare workers are at reduced risk of becoming a case, which is in line with the
studies on infection (17). Both of these studies relate to a period when the Alpha variant
dominated. An analysis from the ONS Community Infection Survey found that contacts of
vaccinated index cases had around 65-80% reduced odds of testing positive with the Alpha
variant and 35-65% reduced odds of testing positive with the Delta variant compare to contacts
of unvaccinated index cases (18).
6COVID-19 vaccine surveillance report – week 40
A summary of vaccine effectiveness evidence can be seen in Table 1.
Table 1. Summary of evidence on vaccine effectiveness against different outcomes Delta
Vaccine effectiveness*
Outcome Pfizer-BioNTech AstraZeneca Moderna
Cominarty Vaxzevria Spikevax
Infection 75-85% 60-70%
Symptomatic
80-90% 65-75% 90-99%
disease
Hospitalisation 95-99% 90-99% 95-99%
Mortality 90-99% 90-95%
High Evidence from multiple studies which is consistent
Confidence and comprehensive
Medium Evidence is emerging from a limited number of
Confidence studies or with a moderately level of uncertainty
Low Little evidence is available at present and results are
Confidence inconclusive
* Estimates of initial vaccine effectiveness in the general population after a 2 dose course. This
typically applies for at least the first 3 to 4 months after vaccination. For some outcomes there
may be waning of effectiveness beyond this point.
7COVID-19 vaccine surveillance report – week 40
Population impact
Vaccines typically have both direct effects on those who are vaccinated and indirect effects on
the wider population due to a reduced probability that people will come into contact with an
infected individual. The overall impact of the vaccination programme may therefore extend
beyond that estimated through vaccine effectiveness analysis.
Estimating the impact of a vaccination programme is challenging as there is no completely
unaffected control group. Furthermore, the effects of the vaccination programme need to be
differentiated from that of other interventions (for example, lockdowns or outbreak control
measures), changes in behaviour and any seasonal variation in COVID-19 activity.
UKHSA and other government and academic partners monitor the impact of the of the
vaccination programme on levels of COVID-19 antibodies in the population and different
disease indicators, including hospitalisations and mortality. This is done through population-
based testing and through modelling which combines vaccine coverage rates in different
populations, estimates of vaccine effectiveness and disease surveillance indicators.
Vaccine coverage
The data in this week’s report covers the period from 8 December 2020 to 3 October 2021
(week 39) (Figure 1). It shows the provisional number and percentage of people in England who
have had received 1 dose or 2 doses of a COVID-19 vaccination by age group and week since
the start of the programme.
Up to 31 August 2021 81,532 women of child-bearing age in England (under 50) who reported
that they were pregnant or could be pregnant at the time, received at least 1 dose of COVID-19
vaccination and of these, 65,579 have received their second dose. This is in response to the
self-reported pre-screening question “Are you or could you be pregnant?”. The true number of
pregnant women who have had a COVID-19 vaccination is likely to be greater than this.
Please note that pregnant women are not a separate priority group as defined by JCVI who
have advised that “women who are pregnant should be offered vaccination at the same time as
non-pregnant women, based on their age and clinical risk group” therefore comparing vaccine
uptake in pregnant women to other vaccination programmes is not currently appropriate. The
MHRA closely monitors the safety of COVID-19 vaccine exposures in pregnancy, including
Yellow Card reports for COVID-19 vaccines used in pregnancy, for the latest information please
see the webpage Coronavirus vaccine – weekly summary of Yellow Card reporting.
8COVID-19 vaccine surveillance report – week 40
Figure 1. Cumulative weekly vaccine uptake by age
a) Dose 1
Over 80 75 to under 80 70 to under 75 65 to under 70 60 to under 65 55 to under 60
50 to under 55 45 to under 50 40 to under 45 35 to under 40 30 to under 35 25 to under 30
20 to under 25 18 to under 20 16 to under 18 12 to under 15 Under 12
100.0
90.0
80.0
70.0
60.0
% vaccine uptake
50.0
40.0
30.0
20.0
10.0
0.0
50 51 52 53 1 2 3 4 5 6 7 8 9 10 11 12 13 14 15 16 17 18 19 20 21 22 23 24 25 26 27 28 29 30 31 32 33 34 35 36 37 38 39
Week number
9COVID-19 vaccine surveillance report – week 40
b) Dose 2
Over 80 75 to under 80 70 to under 75 65 to under 70 60 to under 65 55 to under 60
50 to under 55 45 to under 50 40 to under 45 35 to under 40 30 to under 35 25 to under 30
20 to under 25 18 to under 20 16 to under 18 12 to under 15 Under 12
100.0
90.0
80.0
70.0
60.0
% vaccine uptake
50.0
40.0
30.0
20.0
10.0
0.0
50515253 1 2 3 4 5 6 7 8 9 1011121314151617 18192021222324252627282930 313233343536373839
Week number
10COVID-19 vaccine surveillance report – week 40
Vaccination status
Vaccination status of COVID-19 cases, deaths and hospitalisations by week of specimen date
over the past 4 weeks up to week 39 (up to 3 October 2021) are shown in Table 2 to 4 and
Figure 2.
Methods
COVID-19 cases and deaths identified through routine collection from the Second Generation
Surveillance System (SGSS) and from UKHSA EpiCell's deaths data as described here, were
linked to the National Immunisation Management System (NIMS) to derive vaccination status,
using an individual’s NHS number as the unique identifier.
Attendance to emergency care at NHS trusts was derived from the Emergency Care DataSet
(ECDS) managed by NHS Digital. The same data source was used to identify COVID-19 cases
where the attendance to emergency care resulted in admission to an NHS trust.
ECDS is updated weekly, and cases are linked to these data twice weekly. Data from ECDS are
subject to reporting delays as, although NHS trusts may update data daily, the mandatory
deadline for submission is by the 21st of every month. This means that for weeks immediately
following the 21st of a month, numbers may be artificially low and are likely to be higher in later
versions of the report.
Data from ECDS also only report on cases who have been presented to emergency care and
had a related overnight patient admission and do not show those who are currently in hospital
with COVID-19. As such, it is not appropriate for use for surveillance of those currently
hospitalised with COVID-19. In addition, these data will not show cases who were directly
admitted as inpatients without presenting to emergency care.
The outcome of overnight inpatient admission following presentation to emergency care, was
limited to those occurring within 28 days of the earliest specimen date for a COVID-19 case.
Deaths include those who died (a) within 28 days of the earliest specimen date or (b) within 60
days of the first specimen date or more than 60 days after the first specimen date with COVID-
19 mentioned on the death certificate.
The rate of COVID-19 cases, hospitalisation, and deaths in fully vaccinated and unvaccinated
groups was calculated using vaccine coverage data for each age group extracted from the
National Immunisation Management Service.
11COVID-19 vaccine surveillance report – week 40
Results
The rate of a positive COVID-19 test varies by age and vaccination status. The rate of a positive
COVID-19 test is substantially lower in vaccinated individuals compared to unvaccinated
individuals up to the age of 39. In individuals aged greater than 40, the rate of a positive
COVID-19 test is higher in vaccinated individuals compared to unvaccinated. This is likely to be
due to a variety of reasons, including differences in the population of vaccinated and
unvaccinated people as well as differences in testing patterns.
The rate of hospitalisation within 28 days of a positive COVID-19 test increases with age, and is
substantially greater in unvaccinated individuals compared to vaccinated individuals.
The rate of death within 28 days or within 60 days of a positive COVID-19 test increases with
age, and again is substantially greater in unvaccinated individuals compared to fully vaccinated
individuals.
Interpretation of data
These data should be considered in the context of vaccination status of the population groups
shown in the rest of this report. The vaccination status of cases, inpatients and deaths is not the
most appropriate method to assess vaccine effectiveness and there is a high risk of
misinterpretation. Vaccine effectiveness has been formally estimated from a number of different
sources and is described earlier in this report.
In the context of very high vaccine coverage in the population, even with a highly effective
vaccine, it is expected that a large proportion of cases, hospitalisations and deaths would occur
in vaccinated individuals, simply because a larger proportion of the population are vaccinated
than unvaccinated and no vaccine is 100% effective. This is especially true because vaccination
has been prioritised in individuals who are more susceptible or more at risk of severe disease.
Individuals in risk groups may also be more at risk of hospitalisation or death due to non-
COVID-19 causes, and thus may be hospitalised or die with COVID-19 rather than because of
COVID-19.
12COVID-19 vaccine surveillance report – week 40
Table 2. COVID-19 cases by vaccination status between week 36 and week 39 2021
Received Received
Second Rates among
Cases reported one dose one dose, Rates among
dose ≥14 persons
by specimen date Not (1-20 days ≥21 days persons not
Total Unlinked* days before vaccinated
between week 36 vaccinated before before vaccinated
specimen with 2 doses
and week 39 2021 specimen specimen (per 100,000)
date (per 100,000)
date) date
Under 18 305,428 20,967 272,981 4,973 5,898 609 278.8 2,325.7
18-29 67,820 8,556 23,440 1,119 12,593 22,112 409.6 688.1
30-39 81,532 7,534 21,449 690 7,468 44,391 763.6 738.4
40-49 101,094 6,839 11,662 297 3,653 78,643 1,281.8 690.2
50-59 70,731 4,668 5,144 89 1,464 59,366 839.5 502.5
60-69 36,953 2,585 1,798 26 546 31,998 563.1 332.9
70-79 22,142 1,367 693 6 207 19,869 428.9 281.4
80+ 10,581 869 403 4 199 9,106 354.4 319.5
*individuals whose NHS numbers were unavailable to link to the NIMS
** Interpretation of the case rates in vaccinated and unvaccinated population is particularly susceptible to changes in denominators
and should be interpreted with extra caution.
13COVID-19 vaccine surveillance report – week 40
Table 3. COVID-19 cases presenting to emergency care (within 28 days of a positive specimen) resulting in an
overnight inpatient admission by vaccination status between week 36 and week 39 2021
Cases presenting to
emergency care
Received Received Second
(within 28 days of a Rates among
one dose one dose, dose ≥14 Rates among
positive test) persons
Not (1-20 days ≥21 days days persons not
resulting in overnight Total Unlinked* vaccinated
vaccinated before before before vaccinated
inpatient admission, with 2 doses
specimen specimen specimen (per 100,000)
by specimen date (per 100,000)
date) date date
between week 36 and
week 39 2021
Under 18 486 20 455 3 7 1 0.5 3.9
18-29 348 6 241 6 35 60 1.1 7.1
30-39 588 15 396 5 46 126 2.2 13.6
40-49 769 15 388 9 46 311 5.1 23.0
50-59 870 6 359 3 36 466 6.6 35.1
60-69 963 8 274 4 29 648 11.4 50.7
70-79 1,246 2 173 2 30 1,039 22.4 70.2
80+ 1,421 2 125 1 34 1,259 49.0 99.1
*individuals whose NHS numbers were unavailable to link to the NIMS
14COVID-19 vaccine surveillance report – week 40
Table 4. COVID-19 deaths (a) within 28 days and (b) within 60 days of positive specimen or with COVID-19 reported
on death certificate, by vaccination status between week 36 and week 39 2021
(a)
Death within 28 Received Received
Second Rates among
days of positive one dose one dose, Rates among
dose ≥14 persons
COVID-19 test by Not (1-20 days ≥21 days persons not
Total Unlinked* days before vaccinated
date of death vaccinated before before vaccinated
specimen with 2 doses
between week 36 specimen specimen (per 100,000)
date (per 100,000)
and week 39 2021 date) date
Under 18 6 3 2 1 0 0 0.0 0.0
18-29 18 1 12 0 0 5 0.1 0.4
30-39 38 2 29 0 0 7 0.1 1.0
40-49 77 3 46 0 5 23 0.4 2.7
50-59 238 6 113 1 12 106 1.5 11.0
60-69 414 7 114 0 22 271 4.8 21.1
70-79 786 3 127 0 22 634 13.7 51.6
80+ 1,449 8 168 1 37 1,235 48.1 133.2
15COVID-19 vaccine surveillance report – week 40
(b)
Death within 60 Received Received
Second Rates among
days of positive one dose one dose, Rates among
dose ≥14 persons
COVID-19 test by Not (1-20 days ≥21 days persons not
Total Unlinked* days before vaccinated
date of death vaccinated before before vaccinated
specimen with 2 doses
between week 36 specimen specimen (per 100,000)
date (per 100,000)
and week 39 2021 date) date
Under 18 8 4 3 1 0 0 0.0 0.0
18-29 25 1 16 0 1 7 0.1 0.5
30-39 49 3 34 0 1 11 0.2 1.2
40-49 116 3 73 0 8 32 0.5 4.3
50-59 305 7 146 1 15 136 1.9 14.3
60-69 519 9 150 0 28 332 5.8 27.8
70-79 938 4 147 0 29 758 16.4 59.7
80+ 1,711 8 183 1 45 1,474 57.4 145.1
*individuals whose NHS numbers were unavailable to link to the NIMS
** Number of deaths of people who had had a positive test result for COVID-19 and either died within 60 days of the first positive
test or have COVID-19 mentioned on their death certificate
16COVID-19 vaccine surveillance report – week 40
Figure 2. Rates (per 100,000) by vaccination status from week 36 to week 39 2021
(a) COVID-19 cases
2,500.0
2,000.0
Rate per 100,000
1,500.0
1,000.0
500.0
0.0
Under 18 18-29 30-39 40-49 50-59 60-69 70-79 80+
Age group
Vaccinated with at least 2 doses Unvaccinated
(b) Cases presenting to emergency care (within 28 days of a positive test) resulting in overnight
inpatient admission
120.0
100.0
80.0
Rate per 100,000
60.0
40.0
20.0
0.0
Under 18 18-29 30-39 40-49 50-59 60-69 70-79 80+
Age group
Vaccinated with at least 2 doses Unvaccinated
17COVID-19 vaccine surveillance report – week 40
(c) Death within 28 days of positive COVID-19 test
140.0
120.0
100.0
Rate per 100,000
80.0
60.0
40.0
20.0
0.0
Under 18 18-29 30-39 40-49 50-59 60-69 70-79 80+
Age group
Vaccinated with at least 2 doses Unvaccinated
(d) Death within 60 days of positive COVID-19 test
160.0
140.0
120.0
Rate per 100,000
100.0
80.0
60.0
40.0
20.0
0.0
Under 18 18-29 30-39 40-49 50-59 60-69 70-79 80+
Age group
Vaccinated with at least 2 doses Unvaccinated
18COVID-19 vaccine surveillance report – week 40
Vaccine impact on proportion of population with
antibodies to COVID-19
UKHSA monitors the proportion of the population with antibodies to COVID-19 by testing
samples provided by healthy adult blood donors aged 17 years and older, supplied by the NHS
Blood and Transplant (NHS BT collection). This is important in helping to understand the extent
of spread of COVID-19 infection (including asymptomatic infection) in the population and the
impact of the vaccine programme. 250 samples from every geographic region in England are
tested each week using 2 different laboratory tests, the Roche nucleoprotein (N) and Roche
spike (S) antibody assays. This dual testing helps to distinguish between antibodies that are
produced following natural COVID-19 infection and those that develop after vaccination.
Nucleoprotein (Roche N) assays only detect post-infection antibodies, whereas spike (Roche S)
assays will detect both post-infection antibodies and vaccine-induced antibodies. Thus, changes
in the proportion of samples testing positive on the Roche N assay will reflect the effect of
natural infection and spread of COVID-19 in the population. Increases in the proportion positive
as measured by S antibody will reflect both infection and vaccination. Antibody responses
reflect infection or vaccination occurring at least 2 to 3 weeks previously given the time taken to
generate an antibody response.
In week 40, errors were identified and corrected in some historical sample records within week
30, first reported in week 32. These records had resulted in some minor variations in age
specific Roche N estimates between report weeks 32 and 39, although these were unlikely to
alter the interpretation of any trends. Data reported in this week’s report have been corrected
and the updated historical Roche N seropositivity can be seen in figure 4.
In this report, we present the results using a 4-weekly average, of testing samples up to 24
September 2021, which takes account of the age and geographical distribution of the English
population. Overall, the proportion of the population with antibodies using the Roche N and
Roche S assays respectively were 19.0% and 98.0% for the period 30 August to 24 September
(weeks 35 to 38) (Figure 3). This compares with 18.6% Roche N seropositivity and 97.8%
Roche S seropositivity for the period of 02 August to 29 August (weeks 31 to 34).
The continuing increase in seropositivity using the Roche S assay reflects the growing
proportion of adults who have developed antibodies following vaccination.
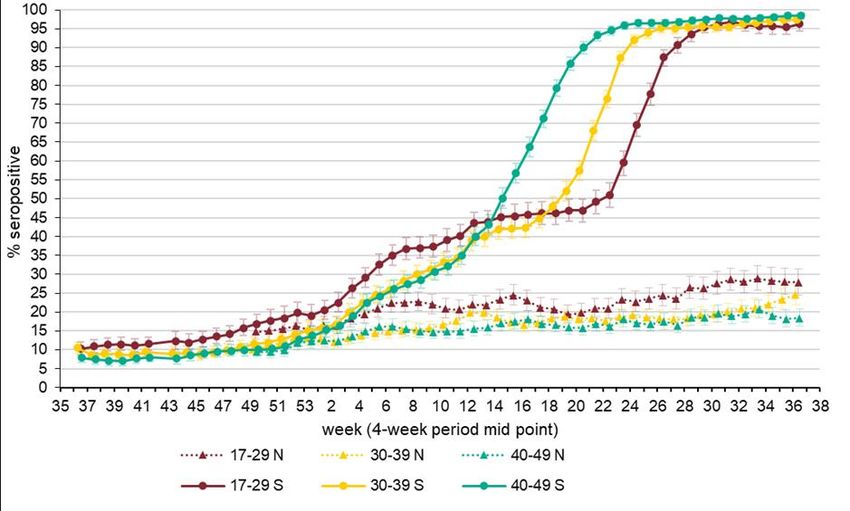
Figure 4a and 4b show the proportion of the population with antibodies by age group. Recent
increases in N seropositivity has been observed in some age groups. Roche N seropositivity
has increased slightly in the 30 to 39 year olds from 20.9% in weeks 31 to 34 to 24.5% in weeks
35 to 38. Similarly, small increases were observed in individuals aged 60 to 69 from 11.3% in
weeks 31 to 34 to 12.3% in weeks 35 to 38. Prevalence in those aged 40 to 49 years old has
decreased from 19.4% in weeks 31 to 34 to 18.4% in weeks 35 to 38. Similarly, decreases were
also observed in 50 to 59 year olds from 19.1% in weeks 31 to 34 to 17.7% in weeks 35 to 38.
Prevalence in individuals aged 17 to 29 has remained stable at 28.0% in weeks 31 to 34 and
27.9% in weeks 35 to 38 as well as in individuals aged 70 to 84 between 7.6% in weeks 31 to
34 and 7.5% in weeks 35 to 38. Decreases in Roche N seropositivity may be due to waning of
19COVID-19 vaccine surveillance report – week 40
the N antibody response over time, however it’s important to note that confidence intervals
overlap.
The pattern of increases in Roche S seropositivity which are observed follow the roll out of the
vaccination programme with the oldest age groups offered vaccine first. (Figure 4b). Roche S
seropositivity increased first in donors aged 70 to 84 and has plateaued since week 13,
reaching 99.2% in weeks 35 to 38. Seropositivity has also plateaued since week 16 for those
aged 60 to 69 reaching 98.7% in weeks 35 to 38. Plateauing in Roche S seropositivity has been
observed since week 19 in those aged 50 to 59 reaching 98.8% in weeks 35 to 38 2021. A
plateauing in seropositivity has been observed in the 40 to 49-year olds since week 23 reaching
98.6% in weeks 35 to 38. Plateauing has been observed in the 30 to 39 year olds from week 28
reaching 97.4% in weeks 35 to 38. A plateauing in seropositivity has recently been observed in
the 17 to 29 year olds reaching 96.3% in weeks 35 to 38 2021.
The impact of the vaccination programme is clearly evident from the increases in the proportion
of the adult population with antibodies based on Roche S testing. This was evident initially
amongst individuals aged 50 years and above who were prioritised for vaccination as part of the
phase 1 programme and since week 15 in younger adults and below as part of phase 2 of the
vaccination programme. Roche S seropositivity is now >95% across all adult age groups.
20COVID-19 vaccine surveillance report – week 40
Figure 3. Overall population weighted 4-weekly rolling SARS-CoV-2 antibody seroprevalence (% seropositive) in blood
donors from the Roche S and Roche N assays.
21COVID-19 vaccine surveillance report – week 40
Figure 4. Population weighted 4-weekly rolling SARS-CoV-2 antibody seroprevalence (% seropositive) in blood
donors from the Roche S and Roche N assays by a) age groups 17 to 29, 30 to 39 and 40 to 49, b) age group 50 to
59, 60 to 69 and 70 to 84.
a)
22COVID-19 vaccine surveillance report – week 40
b)
23COVID-19 vaccine surveillance report – week 40
Summary of impact on hospitalisations, infections
and mortality
UKHSA previously reported on the number of hospitalisations directly averted by vaccination. In
total, around 261,500 hospitalisations have been prevented in those aged 45 years and over up
to 19 September 2021.
UKHSA and University of Cambridge MRC Biostatistics Unit previously reported on the direct
and indirect impact of the vaccination programme on infections and mortality. Estimates suggest
that 127,500 deaths and 24,144,000 infections have been prevented as a result of the COVID-
19 vaccination programme, up to 24 September.
Neither of these models will be updated going forward. This is due to these models being
unable to account for the interventions that would have been implemented in the absence of
vaccination. Consequently, over time the state of the actual pandemic and the no-vaccination
pandemic scenario have become increasingly less comparable. For further context surrounding
this figure and for previous estimates, please see previous vaccine surveillance reports.
24COVID-19 vaccine surveillance report – week 40
References
1. Public Health England. ‘COVID-19: vaccine surveillance strategy 2021’
2. Medicines and Healthcare Products Regulatory Agency. ‘Coronavirus vaccine –
weekly summary of Yellow Card reporting 2021’
3. Andrews N, Tessier E, Stowe J, Gower C, Kirsebom F, Simmons R and others.
‘Vaccine effectiveness and duration of protection of Comirnaty, Vaxzervia and
Spikevax against mild and severe COVID-19 in the UK’. Khub. 2021.
4. Pouwels K, Pritchard E, Matthews P, Stoesser N, Eyre D and others. ‘Impact of
Delta on viral burden and vaccine effectiveness against new SARS-CoV-2
infections in the UK’. MedRxiv. 2021
5. Whitaker H, Tsang R, Byford R, Andrews N, Sherlock J, Sebastian Pillai P and
others. ‘Pfizer-BioNTech and Oxford AstraZeneca COVID-19 vaccine effectiveness
and immune response among individuals in clinical risk groups’
6. Amirthalingham G, Lopez Bernal J, Andrews N, Whitaker H, Gower C, Stowe J and
others. ‘Higher serological responses and increased vaccine effectiveness
demonstrate the value of extended vaccine schedules in combatting COVID-19 in
England.’ medRxiv. 2021
7. Lopez Bernal J, Andrews N, Gower C, Robertson C, Stowe J, Tessier E and
others.
‘Effectiveness of the Pfizer-BioNTech and Oxford-AstraZeneca vaccines on
COVID-19-related symptoms, hospital admissions, and mortality in older adults in
England: test negative case-control study.’ British Medical Journal 2021: volume
373, n1,088
8. Vasileiou E, Simpson CR, Robertson C, Shi T, Kerr S, Agrawal U and others.
‘Effectiveness of first dose of COVID-19 vaccines against hospital admissions in
Scotland: national prospective cohort study of 5.4 million people.’ 2021
9. Hyams C, Marlow R, Maseko Z, King J, Ward L, Fox K and others. ‘Effectiveness
of BNT162b2 and ChAdOx1 nCoV-19 COVID-19 vaccination at preventing
hospitalisations in people aged at least 80 years: a test-negative, case-control
study.’ Lancet Infectious Diseases 2021
10. Ismail SA, Vilaplana TG, Elgohari S, Stowe J, Tessier E, Andrews N and others.
‘Effectiveness of BNT162b2 mRNA and ChAdOx1 adenovirus vector COVID-19
vaccines on risk of hospitalisation among older adults in England: an observational
study using surveillance data.’ PHE Preprints. 2021
11. Lopez Bernal J, Andrews N, Gower C, Stowe J, Tessier E, Simmons R and others.
‘Effectiveness of BNT162b2 mRNA vaccine and ChAdOx1 adenovirus vector
vaccine on mortality following COVID-19.’ PHE Preprints 2021
12. Pritchard E, Matthews PC, Stoesser N, Eyre DW, Gethings O, Vihta K-D and
others. ‘Impact of vaccination on SARS-CoV-2 cases in the community: a
population-based study using the UK’s COVID-19 Infection Survey.’ medRxiv
2021: 2021.04.22.21255913
25COVID-19 vaccine surveillance report – week 40
13. Hall VJ, Foulkes S, Saei A, Andrews N, Oguti B, Charlett A and others. ‘COVID-19
vaccine coverage in health-care workers in England and effectiveness of
BNT162b2 mRNA vaccine against infection (SIREN): a prospective, multicentre,
cohort study.’ Lancet 2021
14. Shrotri M, Krutikov M, Palmer T, Giddings R, Azmi B, Subbarao S and others.
‘Vaccine effectiveness of the first dose of ChAdOx1 nCoV-19 and BNT162b2
against SARS-CoV-2 infection in residents of long-term care facilities in England
(VIVALDI): a prospective cohort study.’ Lancet Infectious Diseases 2021
15. Menni C, Klaser K, May A, Polidori L, Capdevila J, Louca P and others. ‘Vaccine
side-effects and SARS-CoV-2 infection after vaccination in users of the COVID
Symptom Study app in the UK: a prospective observational study.’ The Lancet
Infectious Diseases 2021
16. Harris RJ, Hall JA, Zaidi A, Andrews NJ, Dunbar JK, Dabrera G. ‘Effect of
Vaccination on Household Transmission of SARS-CoV-2 in England’ NEJM 2021
17. V Shah AS, Gribben C, Bishop J, Hanlon P, Caldwell D, Wood R and others.
‘Effect of vaccination on transmission of COVID-19: an observational study in
healthcare workers and their households.’ medRxiv 2021: 2021.03.11.21253275
18. Eyre DW, Taylor D, Purver M, Chapman D, Fowler T, Pouwels KB, Walker S, Peto
T. ‘The impact of SARS-CoV-2 vaccination on Alpha & Delta variant transmission’
medRxiv 2021: 2021.09.28.21264260
26About the UK Health Security Agency
The UK Health Security Agency is an executive agency, sponsored by the Department
of Health and Social Care.
www.ukhsa.gov.uk
© Crown copyright 2021
Published: 7 October 2021
Publishing reference: GOV-10076
You may re-use this information (excluding logos) free of charge in any format or medium,
under the terms of the Open Government Licence v3.0. To view this licence, visit OGL. Where
we have identified any third party copyright information you will need to obtain permission from
the copyright holders concerned.
27You can also read