The Dismal Picture of Lentic Water Bodies and Over Exploitation of Ground Water Storage in Raiganj Block, of North Dinajpur District, W.B., India ...
←
→
Page content transcription
If your browser does not render page correctly, please read the page content below
International Journal of Trend in Research and Development, Volume 7(4), ISSN: 2394-9333
                                           www.ijtrd.com
 The Dismal Picture of Lentic Water Bodies and Over
  Exploitation of Ground Water Storage in Raiganj
   Block, of North Dinajpur District, W.B., India
                                           1
                                          Abhishek Sinha and 2Amal Bhattacharya,
                                          1
                                            Research Scholar, 2Associate Professor,
                             1,2
                                 Department of Zoology, Raiganj University, West Bengal, India

Abstract: India is experiencing a gradual acute shortage of         than 50% of total precipitation flows to the rivers and it is
water resources due to global warming as well as by excessive       estimated to be 1869 billion cubic meters. However, only 690
extraction of groundwater and by much use of the other lentic       billion cubic meter surface water resources can actually be
water bodies due to excessive population growth. Raiganj            utilised (Central Water Commission 2015).
block of North Dinajpur District of W.B., India is also facing
                                                                    A. Study site
the same problem. Almost 30% to 40% of water bodies have
disappeared permanently from the map of Raiganj block during        The entire study area was confined within the jurisdiction of
the last three decades. The dismal picture of water bodies          Raiganj (25.62oN and 88.12oE) block and this survey work was
shows that less than 2.25% area is covered under lentic water       carried out from March, 2019 to the end of February 2020.
bodies in Raiganj block. The condition becomes severe in the        Raiganj block is located in the North Dinajpur District of West
hot dry months, when, altogether only 17% rainfall occurs, but,     Bengal, India (Fig.1a and 1b), the administrative headquarters
the average temperature rises up to 36.4o C. As the land prices     of the district is Raiganj town (pink area, Fig.1c). It is a large
have been increased limitlessly the characteristics of small        block, covering an area of 472.13 km2, out of which only 36.51
ponds, ditches and other waterlogged low lands have been            km2 of the area is covered by Raiganj town which is also the
changed in favour of house building lands. The highest decadal      administrative zone of Raiganj block, as well as, of whole
population growth rate of Raiganj block in respect to the whole     North Dinajpur District. Raiganj Block is bounded by Haripur
West Bengal during the last three decades has led to excess         Upazila in Thakurgaon District of Bangladesh on the
groundwater extraction in the range of 7,74,19200 litres per        north, Hemtabad and Kaliaganj Blocks on the east, Itahar
day in 2020 which is partially being recharged. So, there may       Block on the south and Barsoi Block in Katihar district of
always be a cumulative deficit which may become a severe            Bihar on the west (District Census Handbook, W.B.2011). In
factor in the near future.                                          addition, the north-western side is bordered by Karandighi
                                                                    block.
Key Words: Lentic Water Bodies, Raiganj Block, Decadal
Population Growth Rate, Water Consumption
                     I. INTRODUCTION
It is known that the presence of a considerable amount of
watery areas in a locality helps to avoid an extreme climate.
During the last few decades, water bodies in India are fast
disappearing leading to a drought-like situation and water
shortage. To fight with this water crisis, rivers and
underground water resources have attracted much attention in
India, while the revival of other inland surface water bodies,
such as ponds, lakes, small ditches, beels etc. have been largely
overlooked (Mohanty, 2019). The same thing is happening in
Raiganj block of North Dinajpur District, West Bengal, but
here, the health of the only existing river, Kulik, is also in
dying condition, particularly in the hot dry months. The
only silver array in respect to India as well as in Raiganj block
is monsoon precipitation which has been the lifeline for
agriculture as well as recharging its water resources. It has
been estimated that about 83% (941 mm out of 1130 mm) of
precipitation occurs in the months from June to September in
Raiganj block (Table 1 and Figure 4)(World weather,2018)
which goes at per the records of the rest of India excepting in
some western and northwestern dry states. As per record, India
receives about 4000 billion cubic meters of average annual
precipitation along with snowfall, of which 3000 billion cubic
meters alone is received in the monsoon season from June to
September. The spatial distribution of precipitation widely
varies over the country, less than100 mm in Rajasthan to over
2500 mm in Assam (Central Ground Water Board, 2014). Less

IJTRD | July – Aug 2020
Available Online@www.ijtrd.com                                                                                    166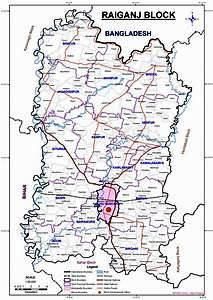
International Journal of Trend in Research and Development, Volume 7(4), ISSN: 2394-9333
                                           www.ijtrd.com
                                                                                    Types of surface waterbodies

                                                                       2.2
                                                                       6%              21.12%
                                                                                                                        PUKUR
                                                                             15.4                                       DOBA
                                                                             5%                       61.45%
                                                                                                                        KHAL
                                                                                                                        BILL

  Fig.1(a) Map of India showing the Fig.1(b) Map of North
   Dinajpur Dist block Fig1(c) Detail map of Raiganj block
         the location of Raiganj Block
                   II. METHODOLOGY
 The study was initiated following the observation of gradual        Fig.2: Graphical representation of different types of lentic
degradation of watery areas through decades, so, a project was                     water bodies in Raiganj block
undertaken from March, 2019 in Raiganj block by the                The total area of Raiganj block is estimated to be 116,665.86
Department of Zoology, Raiganj University. Total one-year          acres (472.13 km2) with the inclusion of 227 moujas (5 new
data were collected covering all the seasons for the fluctuating   moujas have been included in recent times). So, if we calculate
area covered by the water bodies. Most of the areas were           the percentage of lentic surface water coverage of Raiganj
covered by the first author; but, in spite of that, some major     Block, it is less than only 2.25% (Fig3.), which is far below
help was taken from the Block Development Office of Raiganj        than the ideal average surface water coverage (12.34%) (Water
Block (2019-20) for the available total picture of the water       Statistics of EU, 2020).
bodies, and due to failure to reach to some inaccessible remote
areas. Apart from this, some data on water bodies were                                   TOTAL AREA
collected from the local residents. The previous data of the                                 VS
then existing water bodies were collected from the senior                            SURFACE WATER AREA
residents of Raiganj block, especially, from the senior
permanent residents of Raiganj town because of many
developmental works had been taken there during the last three
decades following the formation of District Head Quarter from                             2.2
1st April 1992. Records of decadal population growth rate,                                5%
population density, etc., were obtained from the population
census records of India from 1991 to present to calculate the                                                  Total Area
population pressure index on the surface lentic watery areas
and on the groundwater resources. For this purpose, randomly
30 houses were selected in different wards under Raiganj                                                       Water coverage
Municipality area which is densely populated to calculate per                                                  area
                                                                                                97.75%
head per day consumption of water. The obtained data were
multiplied by the population strength of the block for getting
an average result of the total consumption of water per day.
Besides, records of climatological data were taken from World
Weather Report (2018).
            III. RESULTS AND DISCUSSIONS
                                                                     Fig.3: Total area vs surface water covered area, only 2.25%
Present Picture of water coverage: The present scenario of                           area is covered under water
water bodies in Raiganj Block is not very encouraging.
                                                                   The average high temperature of Raiganj block (Fig.5) reveals
According to survey work on surface static water bodies done
                                                                   that the three hot and dry months, March, April and May
in Raiganj Block in 2019-2020, the estimated total water
                                                                   shows the highest average temperature rising up to 36.4o C
coverage area (excluding the Kulik river and its tributaries) of
                                                                   when actually the lowest rainfall occurs averaging only 17 mm
lentic water bodies is only 2624.45 acres which comprises of
                                                                   (approx.) (Table1 and Figure 4). That means, before monsoon,
1612.81 acres (61.45%) of big, medium and small ponds;
                                                                   the water level of ponds, ditches, beels etc. reaches at its all-
397.74 acres (15.15%) of ditches; only 59.42 acres (2.26%) of
                                                                   time lowest level in a year. The groundwater level also sinks
khals and 554.48 acres (21.12%) of beels (Office of the Land
                                                                   down at its lowest level but, the per head consumption remains
and Land Revenue, Raiganj,2020)(Fig.2). No man-made
                                                                   the same; rather demand becomes higher during these months.
reservoirs were constructed during the last three decades
                                                                   The difference between the high and low temperature in those
(Department of Planning and Statistics, North Dinajpur
                                                                   three months also shows a higher differential average, i.e.
District, 2010).
                                                                   15.1oC, which indicates that the relative humidity remains low
                                                                   and there is the least chance of rainfall.

IJTRD | July – Aug 2020
Available Online@www.ijtrd.com                                                                                  167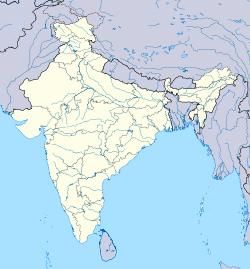
International Journal of Trend in Research and Development, Volume 7(4), ISSN: 2394-9333
www.ijtrd.com
Municipal and Panchayet authorities in the respective zones
JAN FEB MAR APR MAY JUNE JUL AUG SEPT OCT NOV DEC TOT
in different periods whoever had been in power.
19 11 11 08 33 134 306 274 227 94 09 04 1130
0.7 0.4 0.4 0.3 1.3 5.3 12.0 10.8 8.9 3.7 0.4 0.2 44.5
Table1:Showing 83% rainfall occur in June, July, August and
September, while other eight months receives only17% of
rainfall in Raiganj block ( upper in mm and lower in inches) [
after World Weather,2018]
AMOUNT OF RAIN FALL
14
12
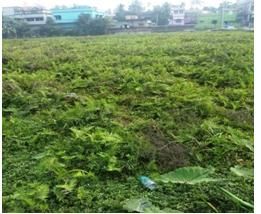
10 Photo1. A pond in the Ward no.9 in Raiganj Municipality area
8 is full of aquatic weeds
6 The sheer casual attitude from the part of the authority, as well
Series 1 as, from the responsible citizens has paid back by the
4 environment itself. The drastic change of weather during the
Rainfll in
2 inches last 30 years has been noticed. The summer has been too much
dry with a hot wave and the monsoonal season has been
0 extended up to September or, in some cases, up to the second
week of October causing a severe flood. One of the main
reasons is unplanned urbanization and its outward extensions
haphazardly. Due to unplanned urbanization, the drainage
system is disrupted and there are hardly any passages for
Fig.4: Graphical representation of precipitation in inches in flowing out of the floodwater to the Kulik River. Kulik River
Raiganj block (After World Weather,Dec.2018) and its tributaries have also lost their water holding capacity
and, thereby, causing devastating flood once in three or four
45 Average High years in a regular manner.
40 Temp. Overall tremendous growth of human population: Population
35 Average Low growth is positively correlated with the consumption of water.
30 Temp. If one looks back to the population growth rate during 1981-
1991 decade the highest growth rate can be observed. Almost
25
57% growth rate occurred in Raiganj block during that period
20 in comparison to the whole district (35%) and West Bengal
15 (25%)(Fig.6). Before that, from 1947 to 1971 a constant
10 fluctuating flow of immigration was a regular phenomenon and
after 1971 a higher rate of immigrants started entering into the
5 border districts of northern West Bengal, particularly in the
0 then West Dinajpur District. The other decades show the
population growth rate of Raiganj Block ranging from 30% to
Nov
April
June
Aug
May
Sept
July
Dec
Feb
Mar
Oct
Jan
20% (Fig.6), whereas, the population growth rate in West
Bengal was managed to confine within 15% to 20%. This extra
load of human population in Raiganj Block has broken all the
Fig.5. Average High and Low temperature of Raiganj block in systematic developmental procedures. The underground water
o
C ( World Weather,2018) level has lowered down considerably and per capita
Is the Raiganj Block drying up? If we look through the expenditure of water increased without any limit during this
situation of lentic surface water bodies chronologically during period.
the last 30 years, it will be very clear that the water bodies’
coverage of the area has been drastically diminished in Raiganj
block up to 30% to 40%. In many areas, either the ponds and
low land water locked areas have been completely dried up, or
the mud layer is exposed; the bottomland of the water bodies
have risen up or have been filled up with manmade garbage
along with aquatic weeds due to eutrophication (Photo 1). In
some areas the character of the land has been changed from
land to building erection land (‘bastu’) and the ponds or low
lands have been filled up overnight for building purposes done
by the influential persons, particularly in the urban localities.
This punishable act in the eye of law had been ignored by the Fig.6: Decadal population growth rate in Raiganj Block from
1971 to 2011(After CD Block wise Primary Census Data,
2018)
IJTRD | July – Aug 2020
Available Online@www.ijtrd.com 168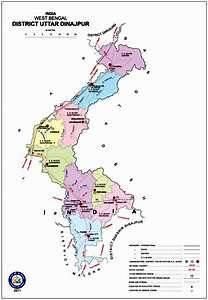
International Journal of Trend in Research and Development, Volume 7(4), ISSN: 2394-9333
                                           www.ijtrd.com
A study by North Bengal University reveals that "Immigrants         we consider 1991 as the base year the excess pressure on water
from East Pakistan/Bangladesh have arrived in the then West         consumption may be as below:
Dinajpur District (Latter Uttar Dinajpur from 1st April,1992)
                                                                      Table 2: Decadal increase of water consumption/day due to
in almost equal numbers before and after 1971." The Human
                                                                                population increase in Raiganj Block
Development Report opines that, "The overall post-Partition
impact on the rates of demographic growth have been                            Population        Water                Total
particularly strong in all North Bengal districts. Despite its       Year
                                                                                strength     usage/head/day      consumption/day
smaller relative size, the region has received more migration in
                                                                      1991       253600         160 litres        40576000 litres
pro-rata terms than the West Bengal districts lying south of the
Ganga."                                                               2001      362285          160 litres        58445600 litres
The decadal growth of population in Raiganj Block in 2001-            2011      430221          160 litres        68835360 litres
2011 was 18.83%. The decadal growth of population in                  2020     483870*       160 litres           77419200litres
Raiganj PS in 1991-2001 was 23.14%, in 1981-91 was 57.70%           *Considering at per the estimated            population growth
and in 1971-81 was 30.37%. The decadal growth rate of               rate,12.47%, of West Bengal
population in North Dinajpur district was as follows: 30.2% in
1971-81, 34.0% in 1981-91, 28.7% in 1991-2001 and 23.2% in          It is very alarming (from the data of Table 2) that in 1991 when
2001-11. At the same time, the decadal growth rate for West         the people of Raiganj Block used to consume 4,05,76,000 litres
Bengal was 13.93% in 2001-2011, 17.77% in 1991-                     of water per day, now they are consuming 7,74,19,200 litres
2001, 24.73% in 1981-1991 and 23.17% in 1971-1981.                  every day! The population of Raiganj Block in January 2020 is
Fig.6 shows that North Dinajpur district has the highest            based on the state decadal growth rate (12.47%) which may
decadal population growth rate in West Bengal with a figure of      probably be low, since next complete census in Raiganj Block,
23.2% for the decade 2001-2011 which is much higher than the        as well as, of North Dinajpur District will be held in 2021, but
state average of 13.8% (Census of India, recd 26 Dec.2018).         it has always been found that the population growth rate of
                                                                    Raiganj block is higher than that of the State’s decadal growth
As per the 2011 and 2001 Census of India, Raiganj Block had         rate. We are consuming extra 3,68,43,000 litres of water per
a total population of 430,221 and 362,285 respectively (CD          day in respect to the year 1991. The consumption shows a
Block wise Primary Census data, recd.22 Dec.2018).                  steady increase throughout the last three decades (table 2).
Considering the registered population growth of 30.71 per cent
during the 1991-2001 decade the 1991 census recorded a total        As throughout the entire Raiganj Block, there is no centralised
population of 253,600. By this time the decadal growth for the      water supply system to the houses still now, the entire pressure
district was 28.72 per cent.                                        is on the underground aquifers and those have also some limits.
                                                                    Underground aquifers are also gradually losing their store
This huge pressure of population growth had a direct effect on      amount (not capacity) as the water is not being recharged
its land-use pattern. Many of the ponds, shallow lowlands,          sufficiently in comparison to the extraction. Work on
open marshlands, bills, small waterlogged tributaries of Kulik      groundwater recharge in Andhra Pradesh has shown that the
river disappeared permanently from the map of Raiganj Block.        heavy rain-fall events of more than 300 mm with prolonged
Gradual shrinkage of water bodies like ponds had been               time lead to the rise of the groundwater levels, thereby,
occurring by filling earth and rubbish. The worst damage had        increasing the groundwater recharge. So, it reveals that
been done in the wards 9,11,12,23,24,25 of Raiganj                  irrespective of the total amount of annual precipitation on the
Municipality area where the developmental programmes were           ground, continuous high precipitation events, exceeding a
taken extensively. Due to the high price of land in these areas,    rainfall of 300 mm in any particular year, can help to rise of the
the ditches, small ponds etc. have been vanished in quick           groundwater levels in that year (Prasad and Rao,2018). But in
successions.                                                        Raiganj block, the aquifers are gradually drying up because of
Apart from diminishing the surface water coverage the               forceful extraction and unpredictable scanty precipitation in
underground water source also had been fallen under                 consecutive two or three years. The highest decadal population
tremendous pressure. Underground water was being pumped             growth rate of Raiganj block in respect to the whole West
out by using shallow pumps so heavily and in so unlimited way       Bengal during the last three decades has led to excess
for the irrigation purpose that the water level sank down           groundwater extraction in the range of 7,74,19200 litres per
considerably.                                                       day in 2020 which is partially being recharged. So, there may
                                                                    always be a cumulative deficit which may become severe in
Water usage per head per day: It has been estimated that            the near future.
average 160 litres of water are consumed per head per day by
the people of Raiganj Municipality area. Random sampling                                    Acknowledgement
suggests that the consumption ranges from 150 litres to 170         The authors are very much thankful to the Land and Land
litres which includes drinking, bathing, cooking, washing           Revenue Department of Raiganj block, for extending their
clothes, house and cars (if any), washing cattle (if any),          helping hands to complete this work. The authors are also very
gardening (if any). In rural areas it may be more due to            thankful to the senior citizens of Raiganj Municipality area and
irrigation purpose, but, there, surface water usage, i.e., water    other moujas who provided valuable data of past decades.
extraction from ponds and other sources, even from river and
rivulets may be done which is difficult to estimate. Here the                                  References
farmers depend more on the monsoonal rain because in the dry        [1]      C.D. Block Wise Primary Census Abstract
months as the underground water level sinks down heavily.                    Data(PCA)". West Bengal – District-wise CD Blocks.
So the population pressure index on water usage can be                       Registrar General and Census Commissioner, India.
calculated by multiplying the population with the prescribed                 Retrieved 22 December 2018.
water consumption, i.e., 160 litres, during the last 30 years. If   [2]      Census of India 2011: District Census Handbook Uttar
                                                                             Dinajpur" (PDF). Series 20, Part XII B, Page 15.

IJTRD | July – Aug 2020
Available Online@www.ijtrd.com                                                                                    169
International Journal of Trend in Research and Development, Volume 7(4), ISSN: 2394-9333
www.ijtrd.com
Directorate of Census Operations, West Bengal. [7] https://en.wikipedia.org/wiki/Raiganj_(community_dev
Retrieved 26 December 2018 elopment_block)(2020):
[3] Central Ground Water Board (2014): Ministry of [8] Mohanty,P.(2019): India’s water crisis: Lakes, ponds
Jalshakti, Department of water resources, Government need urgent attention., indiatoday.in, 28.6.2029
of India [9] Office of the Land and Land Revenue, Raiganj (2020):
[4] Central Water Commission (2015): cwc.gov.in A survey work on pukur, doba, khal and beel of
[5] Department of Planning and Statistics, Uttar Dinajpur Raiganj block, January,2020.
District (2010): Regional Profile of Uttar Dinajpur [10] Prasad,Y.S and Rao,B.V (2018): Groundwater recharge
District: Human Developmentin Uttar Dinajpur estimation studies in a khondalitic terrain of India,
District, pp.1-367. Applied Water Science,8:102, pages 8.
[6] District Census Handbook, W.B (2018): District [11] uttardinajpur.nic.in (2018)
Census Handbook Uttar Dinajpur, Series 20, Part XII [12] Water statistics of European Union (2020):
A" (PDF). Page 337: Directorate of Census https://ec.europa.eu/eurostat/statistics-
Operations, West Bengal. Retrieved 24 explained/index.php/Water_statistics, June,2020.
December 2018. [13] World Weather (2018): Climatological information for
Raiganj, Deccmber,2018
IJTRD | July – Aug 2020
Available Online@www.ijtrd.com 170You can also read