CAPTURING CPG AND RETAIL GROWTH IN 2020 AND 2021 AMID A COVID-19- ALTERED WORLD - COVID-19 and Navigating the Path Ahead - IRI

Page created by Suzanne Beck
 
CONTINUE READING
CAPTURING CPG AND RETAIL GROWTH IN 2020 AND 2021 AMID A COVID-19- ALTERED WORLD - COVID-19 and Navigating the Path Ahead - IRI
COVID-19 and Navigating the Path Ahead

CAPTURING CPG AND
RETAIL GROWTH IN 2020
AND 2021 AMID A COVID-19-
ALTERED WORLD
July 9, 2020
CAPTURING CPG AND RETAIL GROWTH IN 2020 AND 2021 AMID A COVID-19- ALTERED WORLD - COVID-19 and Navigating the Path Ahead - IRI
SECTION 1
Level Setting

                © 2020 Information Resources Inc. (IRI). Confidential and Proprietary.   2
CAPTURING CPG AND RETAIL GROWTH IN 2020 AND 2021 AMID A COVID-19- ALTERED WORLD - COVID-19 and Navigating the Path Ahead - IRI
Online and Food and Beverages Stores are the Bright
                                                                                                                                                                Greater increases in
  Spots in U.S. Retail; Foodservice Recovering in May                                                                                                             spend for younger
                                                                                                                                                                     generations
  U.S. Retail Sales $B by Store Type, February - May 2020                                                                                                        (Millennials, Gen Z)
                                                                                                                                                                vs. Boomers in early
                                   -7%
                        $557 B                          -15%                              +17%                               May vs.                               reopened states2
                                                                                                                            Feb. Index
                                         $516 B                                                          $513 B

                                                                       $439 B
                          269                                                                                                                               Pent up demand for cars,
    All Other Retail1                     219
                         (48%)
                                         (43%)
                                                                                                           228                     85                        furniture, apparel, etc.
                                                                                                          (45%)
                                                                         176
                                                                        (40%)                                                                                   Online sales continue
  Health & Personal                      32 (6%)                                                                                                                 to rise despite store
                        30 (5%)                                                                         27 (5%)                    90
        Care Stores
                           69               72                         27 (6%)                                                                                        re-openings
Non-Store Retailers                                                                                        86
       (e.g., Online)    (12%)            (14%)                           79                                                      125
                                                                                                         (17%)
Gen Merch Retailers        60               65                          (18%)                                                                                   Foodservice is at 60%
                                                                                                           60
                         (11%)            (13%)
                                                                     56 (13%)                            (12%)                     99                             of February level
    Food Service &         65            46 (9%)                                                                                                                and accounts for 35%
    Drinking Places      (12%)                                         30 (7%)                          39 (8%)                    59
                           64              82                             71                               73                                                    of food retail sales
         F&B Stores
                         (12%)           (16%)                          (16%)                            (14%)                    113                            vs. 50% in February
                        February         March                           April                             May

                                                                                                         Source: U.S. Census Retail Trade advanced estimates seasonally adjusted. IRI Consulting analysis.
                                                   1.Includes Auto, Gas, Furniture, Building Materials, Clothing, Electronics, and Sporting retailers. 2. JP Morgan Chase Consumer Card Spending Tracker.
                                                                                                                                         © 2020 Information Resources Inc. (IRI). Confidential and Proprietary.   3
CAPTURING CPG AND RETAIL GROWTH IN 2020 AND 2021 AMID A COVID-19- ALTERED WORLD - COVID-19 and Navigating the Path Ahead - IRI
At-Home Edible Sales Continue to Grow in Double-Digits,
Along with Accelerating Price / Mix Across CPG
U.S. CPG Retail Sales Growth in Measured Channels (MULO+C)

                                   Total Store – 2020                                Edible – 2020                                                    Nonedible – 2020

                                        32.4                                           36.6
   Dollar Sales %                               13.6 13.3 10.6                                  19.5 17.9 13.9                                             25.3
   Change vs. YA        2.3     1.7                                  2.6     2.0                                                        1.8       1.4                 3.4       5.4       5.0

Price / Vol1 % Change
         vs. YA         2.5     2.3     1.7     4.0    4.9    5.2    1.8     1.7        1.1      3.6       4.6      5.0                 3.7       3.4       2.9       4.7       5.3       5.4

Price / Unit % Change
                        2.8%    2.4%    3.1%    6.3%   6.8%   6.5%   2.6%    2.5%       5.0%     9.8%      9.6%     8.6%               3.6%      2.3%      2.3%      3.4%      4.7%      4.7%
        vs. YA

                                        30.2                                           35.1
  Volume1 Sales %                                                                               15.4 12.7                                                  21.8
   Change vs. YA
                                                9.3    8.0    5.2    0.8     0.3                                    8.4                                                          0.1
                        -0.2    -0.6                                                                                                   -1.8 -2.0                     -1.3                -0.4
    Unit Sales %
   Change vs. YA        -0.4%   -0.6%   28.4%   6.8%   6.0%   3.9%   -0.1%   -0.5%     30.2%     8.8%      7.6%     4.9%               -1.7%     -1.0%     22.5%     0.0%      0.7%      0.3%

                         CY     Jan +                                 CY     Jan +                                                      CY       Jan +
                                        Mar     Apr    May    June                      Mar       Apr      May      June                                    Mar       Apr       May       June
                        2019     Feb                                 2019     Feb                                                      2019       Feb

                                                                                     1. Dollar-weighted average change across categories. Source: IRI POS data Total U.S. MULO+C ending 6/28/20.
                                                                                                                               © 2020 Information Resources Inc. (IRI). Confidential and Proprietary.   4
CAPTURING CPG AND RETAIL GROWTH IN 2020 AND 2021 AMID A COVID-19- ALTERED WORLD - COVID-19 and Navigating the Path Ahead - IRI
Consumer Shift to Larger Pantry-Stock Trips Continues; Online,
Dollar and Grocery Channels are the Winners
IRI CPG Demand Index: Total Store

                                          4 WE 1/26/20 4 WE 2/23/20 4 WE 3/22/20 4 WE 4/19/20 4 WE 5/17/20 4 WE 6/14/20
             Total US - All Outlets           101          105          125          95           101          98
              Total US – GroceryX             100          105          133          102          103          100
              Total US - Drug                  96           94          111           80           82           87
              Total US - MassX                 88           94          111           72           79           82
Trips

              Total US - Club                 104          106          127           94          104          100
              Total US - Dollar               103          105          136           99          105          100
              Total US - Walmart Total        103          106          115           86           90           89
              Total US - Dollar General       115          117          157          127          127          115
             Total US - All Outlets           99           99           109          122           121                    116
              Total US - GroceryX             99           98           109          126           124                    118
              Total US - Drug                 104          106          112          115           116                    111
$ per Trip

              Total US - MassX                105           93          112          118           112                    112
              Total US - Club                  96           97          106          119           119                    112
              Total US - Dollar               100          100          117          127           123                    114
              Total US - Walmart Total         99           98          109          121           123                    118
              Total US - Dollar General        99           99          113          118           121                    113
              eCommerce                       134          127          155          185           189                    175
$

                                                                                              Source: IRI Consumer Network Panel , IRI eMarketing Insights data ending 6/14/20.
                                                                                                            © 2020 Information Resources Inc. (IRI). Confidential and Proprietary.   5
CAPTURING CPG AND RETAIL GROWTH IN 2020 AND 2021 AMID A COVID-19- ALTERED WORLD - COVID-19 and Navigating the Path Ahead - IRI
In the U.S., Higher Price / Mix Is Partly Driven by Larger Packs,                                                                                                                           United
  While Volume Drives Majority of Increase vs. Pre-COVID-19                                                                                                                                   States

  U.S. Inflation Index (Price/Unit), Price/Volume, Unit Growth, Volume Growth – Index vs. YA
                                             Pre-COVID                                                                                                                                        06.14 vs. pre-
       Department           Measure                      4 WE 03.22    4 WE 04.19     4 WE 05.17            WE 05.24            WE 05.31             WE 06.07              WE 06.14
                                             8 WE 2.23                                                                                                                                         COVID-19
          Edible         Price/Unit Index
                                                                                                                                                                                                        +6
                         (Inflation Index)      102          103           107            109                   108                 108                  108                   108

   Positive delta       Price/Volume Index      102          102           104            105                   105                 105                  106                   105                      +3
signifies consumers
                         Price Index Delta       1            1             3              4                     3                    3                    2                     3                      +2
 buying larger pack
        sizes           Unit Growth Index       99           135           114            115                   110                 108                  106                   106                      +7
                         Volume Growth
                               Index            100          136           117            119                   113                 111                  108                   108                      +8
                         Price/Unit Index
                         (Inflation Index)      102          102           102            104                   104                 105                  105                   105                      +3

                        Price/Volume Index      103          103           104            107                   106                 106                  106                   106                      +3

        Nonedible        Price Index Delta      -1           -1            -2              -3                    -2                  -1                    -1                   -1                      -
                        Unit Growth Index       99           129           100            104                   102                  99                   97                   100                      +1
                         Volume Growth
                             Index              98           129           98             102                   100                  98                   96                   100                      +2

    Example / Cookies                                                                                    Pre-COVID-19                Post-COVID-19                     WE 06.14
    Cookies price per unit increased at a faster rate than    Price/Unit Index (Inflation Index)              103                         109                            108
    price per volume post-COVID-19, indicating a shift to           Price/Volume Index                        102                         102                            103
    large pack sizes. Shift decelerates slightly in recent           Price Index Delta                         1                           7                               5
    periods, while price per volume has risen slightly.              Unit Growth Index                         98                         103                             97
                                                                   Volume Growth Index                         99                         111                            101

                                                                                                   Source: IRI Inflation Tracker MULO+C, IRI POS Data week ending 6/14/20. IRI Consulting Analysis
                                                                                                                               © 2020 Information Resources Inc. (IRI). Confidential and Proprietary.        6
CAPTURING CPG AND RETAIL GROWTH IN 2020 AND 2021 AMID A COVID-19- ALTERED WORLD - COVID-19 and Navigating the Path Ahead - IRI
In the U.S., Increased Demand Is Benefiting Smaller
       Manufacturers More as They Pick Up Distribution                                                                                                                               Smaller manufacturers
                                                                                                                                                                                     are gaining distribution
       % Share of Total Store Sales by CPG Manufacturer Size /                                                                                                                        and velocity as larger
       Total U.S. Measured Channels (MULO+C)                                                                                                                                           manufacturers face
                                                                                                                                                                                       supply constraints
                                               vs. YA                             vs. YA                              vs. YA                                vs. YA                       and/or focus on
    Private Label                 15.6           +0.3                16.1                                16.7                               16.0
                                                                                                                                                                                      core lines in the face
                                                                                    +0.3                               +1.1                                 +0.7
                                                                                                                                                                                         of high demand.
       Extra Small                 8.6           +0.1                 8.6           +0.1                  8.3           -0.2                 9.2            +0.5
                Small             12.6           +0.1                12.6           +0.1                 12.7          +0.1                 13.2            +0.7                      Large manufacturers
                                                                                                                                                                                     see growth as they gain
            Medium                16.0           +0.1                16.0           -0.1                 15.9           -0.1                16.1            +0.1                         velocity, with a
                                                                                                                                                                                         slight decline in
                                                                                                                                                                                       distribution points.
                Large             47.1           -0.7                46.7           -0.4                 46.4           -0.9                45.5            -2.0
                                                                                                                                                                                    Greater growth seen for
                                                                                                                                                                                       small and medium
                                                                                                                                                                                    manufacturers in edible
                                 2019                        2020 Pre-Peak                          2020 Peak                       2020 Post-Peak                                 vs. nonedible categories.
Note: Large is $5.5B+ in L52W, Medium $1-$5.5B, Small $100M-$1B and Extra Small
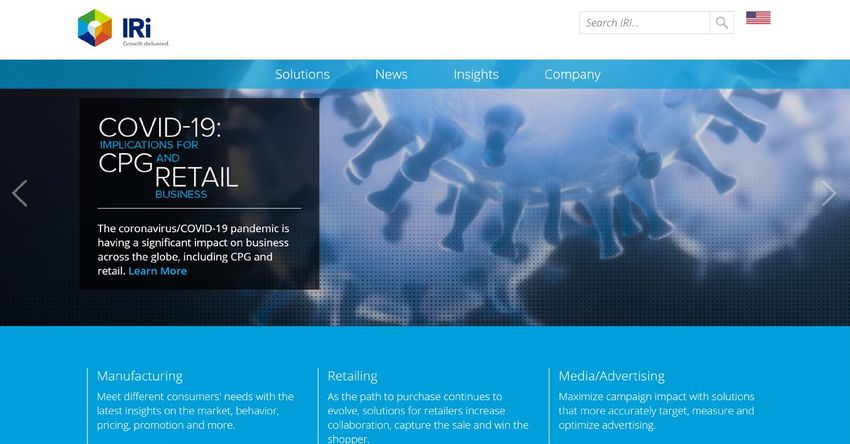
CAPTURING CPG AND RETAIL GROWTH IN 2020 AND 2021 AMID A COVID-19- ALTERED WORLD - COVID-19 and Navigating the Path Ahead - IRI
SECTION 2
Where We Are Now

                   © 2020 Information Resources Inc. (IRI). Confidential and Proprietary.   8
CAPTURING CPG AND RETAIL GROWTH IN 2020 AND 2021 AMID A COVID-19- ALTERED WORLD - COVID-19 and Navigating the Path Ahead - IRI
The U.S. Has Not Entered the Rapid-Recovery Phase
That Other Countries Have Experienced

                    Trajectory of World COVID-19 Confirmed Cases (2020-06-24)
     Some countries with rapid declines recently experienced small bounce-backs in new cases (HK, Australia,
       S. Korea, China). New cases in the U.S. have now put the country in a new phase of re-acceleration.

                                                                                  Source: RBC Biotechnology Equity Research, Dr. Aatish Bhatia
                                                                             © 2020 Information Resources Inc. (IRI). Confidential and Proprietary.   9
CAPTURING CPG AND RETAIL GROWTH IN 2020 AND 2021 AMID A COVID-19- ALTERED WORLD - COVID-19 and Navigating the Path Ahead - IRI
Across U.S. States, CPG Demand Is Growing at a High                                                                                                                                                                                 United
Rate Even in States Where Consumers Are More Mobile                                                                                                                                                                                 States

CPG Demand Index vs. Change in Mobility by State / 4 WE June 14, 2020
                            17%

                            16%                                                                                                                                                                Arizona
                                                                                                                                 New Mexico

                            15%
                                           Michigan
  CPG Demand Index vs. YA

                            14%
                                                                                     South Carolina                                              Rhode Island               Kentucky
                                                                                                                                     Indiana                  Pennsylvania
                            13%                                                                                             Arkansas
                                                                                                   North Carolina                                             Ohio                                    California
                                                                                     Virginia                                       West Virginia New Hampshire
                            12%                                                                                                                                      Maryland
                                                                                                                                         Georgia                                 Wisconsin                                Oregon
                            11%                                                                          Alabama                                       Louisiana      Vermont                       Oklahoma
                                                                                                                              Missouri
                                                                                Washington                                                                                                                               Nevada
                                               Massachusetts                                                                Connecticut                                                     Tennessee
                            10%                                                                 Colorado                                                                                                            Texas
                                                                                                                                                Utah                                  Minnesota
                            9%                                                                                         New York
                                                                                 Florida                                                                           Maine
                            8%                                                                                                                     Illinois                             South Dakota
                            7%

                            6%

                            5%                                                                                                                                                 Wyoming

                            4%
                             -12.5%   -12.0%   -11.5%       -11.0%       -10.5%       -10.0%        -9.5%        -9.0%        -8.5%        -8.0%         -7.5%       -7.0%         -6.5%        -6.0%        -5.5%         -5.0%        -4.5%

                                                                       Average Change in Mobility1 (June vs. Pre-COVID-19 baseline)
                                                                                                                                                                                                  Indicates more mobility

                                           1. Google Mobility Report -1*Residential (time spent at home) % Chg. from pre-COVID-19 baseline (Jan 3-Feb 6, 2020). Source: Google Mobility data, IRI Demand Index. IRI Consulting analysis.
                                                                                                                                                                     © 2020 Information Resources Inc. (IRI). Confidential and Proprietary.     10
Around 30 States Are Seeing
Increasing Case Counts
                                     WA
In some states, the                                                                                                                                                 ME
                                                        MT        ND
increases are moderate                                                                                                                                    VT
                                OR
(Colorado, Delaware,                                                             MN
                                                                                                WI
                                                                                                                                                               NH
                                          ID                      SD                                                                              NY            MA
Michigan), but most                                                                                               MI                                           CT        RI
                                                         WY
states, especially those
                                                                                      IA                                                   PA             NJ
in the south, including                                            NE
                                                                                                                          OH
                                     NV                                                                        IN                               MD
Texas, Florida, Arizona,                        UT
                                                                                                     IL
                                                                                                                                   WV
                                                                                                                                                               DE
                                                             CO
Louisiana, Nevada,         CA
                                                                       KS              MO
                                                                                                                                             VA
                                                                                                                       KY
Mississippi, South
                                                                                                                                           NC
Carolina, Arkansas, are                        AZ
                                                                                                                 TN
                                                                            OK
seeing surges.                                            NM                            AR
                                                                                                                                       SC

                                                                                                     MS          AL          GA

                                                                   TX                      LA

                                                                                                                                        FL

               DECREASE    FLAT                     INCREASE

                                                                                                      Source: New York Times, RBC Capital Markets
                                                                                 © 2020 Information Resources Inc. (IRI). Confidential and Proprietary.        11
Situations Vary By State
Several states in the South, Southeast, and Southwest have alarmingly high test positive rates, indicating
the states are either testing only the sickest patients (testing constrained) and/or high incidence of infection.

                                                                       The combined population of
                                                                       these states is over 80MM
                                                                       people, representing about
                                                                       a quarter of the U.S.

                                                                                    Source: The COVID Tracking Project, RBC Capital Markets
                                                                           © 2020 Information Resources Inc. (IRI). Confidential and Proprietary.   12
Several States Have Paused Reopening Plans or
Begun Reversing Them
                                     WA
Texas and Florida have                                                                                                                                            ME
                                                      MT        ND
re-closed bars after                                                                                                                                    VT
                                OR
cases surged; California                                                       MN
                                                                                              WI
                                                                                                                                                             NH
                                          ID                    SD                                                                              NY            MA
ordered bars closed in                                                                                          MI                                           CT        RI
                                                      WY
LA and seven other
                                                                                    IA                                                   PA             NJ
counties, with more than                                         NE
                                                                                                                        OH
                                     NV                                                                      IN                               MD
a handful of others                             UT
                                                                                                   IL
                                                                                                                                 WV
                                                                                                                                                             DE
                                                           CO
being watched for          CA
                                                                     KS              MO
                                                                                                                                           VA
                                                                                                                     KY
possible re-closure.
                                                                                                                                         NC
                                                                                                               TN
                                               AZ                         OK
                                                       NM                              AR
                                                                                                                                     SC

                                                                                                   MS          AL          GA

                                                                 TX                      LA

                                                                                                                                      FL

              REOPENED /
                           PAUSING              RE-CLOSING
              REOPENING

                                                                                                    Source: New York Times, RBC Capital Markets
                                                                               © 2020 Information Resources Inc. (IRI). Confidential and Proprietary.        13
As Cases Surge, Some Grocery Stores Are Putting
Product Limits Back in Place to Discourage Panic Buying
HEB in Texas is putting limits back in place for certain items, including paper
products and disinfectant wipes. Similar measures have happened in Australia,
where a second wave has sparked panic buying of toilet paper again.

                          Food Item Limits (all H-E-B Stores)
                          • Brisket – limit 2

Nonedible Item Limits (all H-E-B Stores)
• Bath Tissue Multi-Pack – limit 2              •   Trial and Travel Size Disinfecting and
• Bath Tissue Singles – limit 2                     Antibacterial Sprays / Wipes – 2 items
• Paper Towels                                  •   Hand Sanitizer – 4 items
• Acetaminophen – 2 items total (includes       •   Hand Soap – 2 items
  baby, trial, travel sizes, OTC)               •   Hydrogen Peroxide – 2 items
• H-E-B Acid Controller / Famotidine and        •   Rubbing (Isopropyl) Alcohol / Swabs –
  Pepcid 50ct and Larger – Limit 1                  2 items
• H-E-B Acid Controller / Famotidine and        •   First Aid and Cleaning Gloves – 2 items
  Pepcid Smaller than 50ct – Limit 1
• Disinfecting & Antibacterial Sprays – 2 items

                                                                                                                                            Source: HEB
                                                                                     © 2020 Information Resources Inc. (IRI). Confidential and Proprietary.   14
SECTION 3
Where We Stand
On a Vaccine

                 © 2020 Information Resources Inc. (IRI). Confidential and Proprietary.   15
Upcoming Clinical Trial
Readouts For COVID-19
Treatments / Vaccines

                                Source: RBC Capital Markets; Biomedtracker; Clinicaltrials.gov
                          © 2020 Information Resources Inc. (IRI). Confidential and Proprietary.   16
Vaccines in Development for COVID-19

                                             Source: RBC Capital Markets; Biomedtracker; Clinicaltrials.gov
                                       © 2020 Information Resources Inc. (IRI). Confidential and Proprietary.   17
Experts Say We Are One Third of the Way
to a Widely Available COVID-19 Vaccine

                                                                                          Source: USA Today
                                          © 2020 Information Resources Inc. (IRI). Confidential and Proprietary.   18
5-Layer Framework on Go-Forward CPG Consumption
                 History would suggest that changes in the way we work, live and play have the single-biggest impact on how we
      SOCIETAL   behave and interact with food. Our study takes a look at the evolution of eating patterns going back to the 1920s to
                 provide some context on how changes occurring due to COVID-19 could impact future behaviors.

                 A global survey found that almost half of all respondents chose ready-to-eat meals versus preparing a meal from
                 scratch due to not knowing how to cook, lack of confidence in cooking skills, or a dislike for cooking—on par with a lack
    EDUCATION    of time. Even schools have substantially scaled back student access to “home economics” where cooking was a central
                 part of the curriculum. We believe the proliferation of “education centers” for food preparation (Facebook, Instagram,
                 Google, YouTube, etc.) over the past 10 years has eliminated one of the biggest barriers to cooking at home.
                 Interestingly, economic downturns of the past have not created a significant surge in demand for package food
 RECESSIONARY    categories. We believe future recessions will have a more positive impact on package food consumption. Importantly,
      EFFECTS    we believe the purchasing patterns over the past several weeks have provided: 1) some transparency into how much it
                 costs to make a meal at home versus eating out; and 2) practice in preparing meals.

                 Pantry loading and more at-home consumption have created a trial surge that most observers thought we would never
UNPRECEDENTED    see. Importantly, big brands have fared very well due to a combination of supply-chain strength, brand recognition and
         TRIAL   consumers migrating to comfort/things with which they are familiar. Importantly, many packaged food companies have
                 “leaned into” trial, which should create a decent amount of repeat.

                 We believe the ramp in online grocery shopping over the past 3 months has created an advantage for “Big Food”. In
        ONLINE   many instances, the largest brands tend to dominate on the first page of any e-commerce portal. Importantly,
     MIGRATION   Numerator data suggests consumers that purchase online tend to be more brand loyal than consumers shopping in a
                 brick-and-mortar environment.

                                                                                        © 2020 Information Resources Inc. (IRI). Confidential and Proprietary.   19
SECTION 4
What Happens When
Things Start to Re-Open

                          © 2020 Information Resources Inc. (IRI). Confidential and Proprietary.   20
Expect Measured Channels CPG Sales
to Remain Elevated Through 2021, Driven                                                                                                                Key Factors
by Lingering Stay-at-Home Behaviors                                                                        Localized containment if the virus spikes again;
                                                                                                           no national shutdown
CPG $ Sales % Chg. vs. YA Actual & Forecast –                                                              Fatigued by quarantine, consumers are going out again;
Multi-Outlet (MULO)                                                                                        out-of-home consumption occasions begin to recover
                                                                                                           • Retail and recreation mobility improved to -17% vs.
                                                                                                              pre-COVID-19 vs. -50% at height of pandemic1
                         Actual     Forecast
   EDIBLE                                                                                                  • Restaurant spending improved to -33% vs. ~-70% at peak2
   NONEDIBLE                                                                                               • In-home cooking weariness
                       15.1                                                                                • Foodservice reshape with more delivery, take-out,
                                                    ~12-14
                                                                                                              drive throughs and outdoor eating
                                    ~9 to 11
                                                                                                           • Businesses and schools reopen
                              7.3
                                                              ~4-6                                         As economic stimulus and extra unemployment support run out /
                                         ~3 to 5
  2.3 2.5    2.6 1.8                                                                                       decrease, value seeking and in-home consumption increases
                                                                                                           Work-from-home will be the norm for higher-risk and
                                                                                   ~0 to -2                conscious segments and many white-collar workers (at least
                                                                       ~-4 to -6
                                                                                                           a few days / week)

                                                                                                                             2020-21 Sales Growth (2-Year CAGR)
 2015-2018     2019     2020          2020            2020                  2021
   CAGR                 YTD          Rest of        Full Year                                                   Exceeds 2019 growth due to elevated in-home consumption
                                      Year

                                                                        1. Google Mobility Report Total U.S. retail and recreation mobility as of June 12, 2020. 2. JP Morgan Chase Consumer Card Spending as of June 12, 2020.

                                      Assumes no major national quarantine event after March –May 2020 / Source: IRI Strategic Analytics proprietary forecasting models, IRI Growth Consulting analysis..
                                                                                                                                     © 2020 Information Resources Inc. (IRI). Confidential and Proprietary.     21
Grocery Growth Should Continue to Outpace
Other Channels in 2020 as Consumers
                                                                                                             Additional Factors
Continue Large, Edible-Centered Trips
CPG $ Sales % Chg. vs. YA Actual & Forecast – Grocery                                                     Continued preference for
                                                                                                           “one-stop-shop” (larger
                                                                                                          Edible baskets and more
                                                                                                           frequent purchasing of
                          Actual    Forecast                                                                 Nonedibles) to limit
   EDIBLE                                                                                                 exposure when shopping
   NONEDIBLE             20.6                                                                                will benefit Grocery
                             18.2                   ~16-18
                                    ~11 to 15
                                                              ~10-12                                     2020-21 Sales Growth
                                         ~6 to 8                                                            (2-Year CAGR)
   1.3 1.3     1.7 1.2                                                                                    Exceeds 2019 growth due
                                                                                                            to elevated in-home
                                                                                                                consumption
                                                                             ~-4 to -6
                                                                     ~-7 to -9
 2015-2018      2019      2020        2020             2020               2021
   CAGR                   YTD        Rest of         Full Year
                                      Year

                                       Assumes no major national quarantine event after March –May 2020 / Source: IRI Strategic Analytics proprietary forecasting models, IRI Growth Consulting analysis..
                                                                                                                                      © 2020 Information Resources Inc. (IRI). Confidential and Proprietary.   22
Expect More Muted CPG Growth in
Mass Even as Traffic Holds with
                                                                                                            Additional Factors
Value-Seeking Shoppers
                                                                                                         Increasing need for value
CPG $ Sales % Chg. vs. YA Actual & Forecast – Mass                                                        as stimulus lessens over
                                                                                                        time will drive trips to Mass
                                                                                                               However, Edible
   EDIBLE
                         Actual     Forecast                                                                  purchases shifting
   NONEDIBLE                                                                                                 more to Grocery and
                                                                                                                   Dollar in
                       13.4                                                                                  one-stop-shop pantry
                                                                                                                stocking habits
                                               ~9-10
                              6.8   ~6 to 8
 4.1 4.6                                ~4 to 6      ~5-6
             3.7 3.8
                                                                                                        2020-21 Sales Growth
                                                                                                           (2-Year CAGR)
                                                                            ~-0.5 to -1.5
                                                                                                          Lags 2019 growth due to
                                                                    ~-3 to -4
                                                                                                        likely shifts to Grocery and
                                                                                                               Dollar channels
 2015-2018      2019    2020          2020            2020                  2021
   CAGR                 YTD          Rest of        Full Year
                                      Year

                                      Assumes no major national quarantine event after March –May 2020 / Source: IRI Strategic Analytics proprietary forecasting models, IRI Growth Consulting analysis..
                                                                                                                                     © 2020 Information Resources Inc. (IRI). Confidential and Proprietary.   23
Convenience is Likely to See Mild
Recovery as Mobility Returns, But
                                                                                                            Additional Factors
Weak Income May Limit Growth
                                                                                                            People driving more
CPG $ Sales % Chg. vs. YA Actual & Forecast – Convenience                                                   starting to increase
                                                                                                           demand for gas; also,
                                                                                                          preference for car travel
                        Actual     Forecast                                                                  vs. air travel post
   EDIBLE                                                                                                        COVID-19
   NONEDIBLE
                                                                                                        Construction recovery and
                                                                                                         increased demand for
                                                                                                           home improvement
                                                                                                         projects will help sales
             3.9 2.8                  ~2.5 to 3.5 ~2.5-3                    ~3.5 ~3                              growth
 3.6 3.5                     2.6   ~2 to 3       ~1-2
                       0.4                                                                              Yet, higher unemployment
                                                                                                          and lower disposable
                                                                                                         income growth will limit
                                                                                                            Convenience store
                                                                                                              traffic and sales
 2015-2018     2019    2020          2020             2020                  2021
   CAGR                YTD          Rest of         Full Year
                                     Year

                                      Assumes no major national quarantine event after March –May 2020 / Source: IRI Strategic Analytics proprietary forecasting models, IRI Growth Consulting analysis..
                                                                                                                                     © 2020 Information Resources Inc. (IRI). Confidential and Proprietary.   24
Thinking Past the Pandemic
RBC Imagine 2025 Framework

      Calibrated & Augmented Self   The Artificial Intelligence Race              In Cloud We Trust

           Collective Action           Escalating Uncertainties                   Agility Imperative

                                                                                         Source: Sterling Rice Group, RBC Capital Markets
                                                                       © 2020 Information Resources Inc. (IRI). Confidential and Proprietary.   25
The Latest COVID-19 Reports and Insights from IRI
  LESSONS FROM THE GREAT RECESSION       THE CHANGING SHAPE OF THE CPG DEMAND CURVE

                                                      © 2020 Information Resources Inc. (IRI). Confidential and Proprietary.   26
Insights and Strategic
Guidance for Better Decisions
IRI’s Online Resources Include Real-Time
Updates and Weekly Reports That Track
the Impact of the Virus on CPG and Retail
The IRI COVID-19 Portal
Includes COVID-19 impact analyses, dashboards
and the latest thought leadership on supply chain,
consumer behavior and channel shifts for the U.S.
AND international markets.

IRI CPG Economic Indicators, Including
the IRI CPG Demand Index™, IRI CPG
Supply Index™ and IRI CPG Inflation
Tracker™
Accessible through the insights portal
to track the daily impact of COVID-19.
This includes top-selling and out-of-stock
categories across the country and
consumer sentiment on social media.

                                                     © 2020 Information Resources Inc. (IRI). Confidential and Proprietary.   27
Your Feedback is Important
Please Complete a Brief Survey

                                 © 2020 Information Resources Inc. (IRI). Confidential and Proprietary.   28
© 2020 Information Resources Inc. (IRI). Confidential and Proprietary.   29
CONTACT US
              IRI Global Headquarters
              150 North Clinton Street

   FOR MORE
              Chicago, IL 60661-1416
              IRI@IRIworldwide.com

INFORMATION
              +1 312.726.1221

              Follow IRI on Twitter: @IRIworldwide

                                                       © 2020 Information Resources Inc. (IRI).
                            © 2020 Information Resources Inc. (IRI). Confidential and Proprietary.   30 30
You can also read