MI COVID response Data and modeling update - October 19, 2021 - State of ...
←
→
Page content transcription
If your browser does not render page correctly, please read the page content below

MI COVID response
Data and modeling update
October 19, 2021
Executive Summary
Special Population Focus: Children
Cases are increasing from last week
There were 408 outbreaks and clusters in K-12 schools
Census of COVID+ pediatric patients (
COVID-19 and Pediatric
      Populations

                       National                        Public Health     Other      Science
Special Populations                Spread   Severity
                      Comparison                        Response       Indicators   Roundup
Overview of metrics for individuals < 12 and
Other states experienced a sharp increase in pediatric
  hospital admissions during the recent surge
   • States across the southern US saw
     extremely rapid and concerning surges in
     pediatric hospital admission rates
   • Highest pediatric COVID-19
     hospitalization rate seen so far in the
     pandemic for many areas
   • Many of these areas are now declining
     (still higher than current MI levels
     though)
   • Michigan is experiencing a delayed
     surge—potential for similar increases in
     Michigan as cases (and subsequently
     hospital admissions) rise
     Source: CDC COVID Data Tracker confirmed pediatric hospital admissions

                                     National                                                     Public Health     Other      Science
Special Populations                                                           Spread   Severity
                                    Comparison                                                     Response       Indicators   Roundup
Statewide Hospitalization Trends: Pediatric COVID+ Census
                                       The census of COVID+ Pediatric
                                       patients (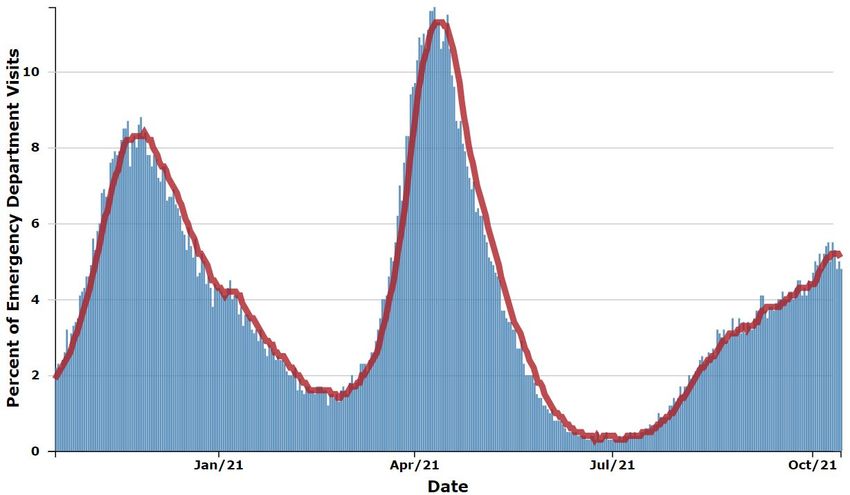
Majority of hospitalized children have no underlying conditions
      •     Children can experience severe health outcomes from COVID-19 including MIS-C and Hospitalization
               •    Nationally, nearly half of children hospitalized have no reported underlying conditions†
               •    In Michigan, 50.6% of children hospitalized have no reported underlying conditions
   U.S. Pediatric Hospitalizations | Underlying Medical Conditions                          MI Pediatric Hospitalizations | Underlying Medical Conditions
                                                                                                          100

                                                                                                          80

                                                                                                                                                       50.6%

                                                                                             Percentage
                                                                                                          60
                                                                                46.0%
                                                                                                          40

                                                                                                          20

                                                                                                           0

    Sources: *CDC COVID Data Tracker > New Hospital Admissions; † COVIDNET

                                   National                                                                     Public Health     Other      Science
Special Populations                                                    Spread    Severity
                                  Comparison                                                                     Response       Indicators   Roundup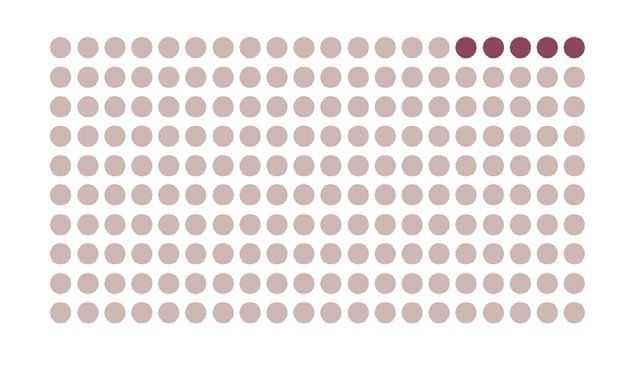
Multisystem Inflammatory Syndrome in Children (MIS -C)

    •    Multisystem Inflammatory Syndrome in Children (MIS-C) is a condition in children and adolescents under 21 years of age where
         multiple organ systems become inflamed or dysfunctional which occurs in association with illness.
    •    169 children and adolescents under 21 years have had MIS-C in Michigan
    •    70.2% of MIS-C cases were admitted to the ICU
    •    Black/African American children are over-represented among cases (42.6%)
    •    Cases are most frequent in preparedness regions 2 North, 2 South and 6
    Source: MDHHS and MIS-C Data and Reporting

                                   National                                         Public Health       Other             Science
Special Populations                              Spread           Severity
                                  Comparison                                         Response         Indicators         Roundup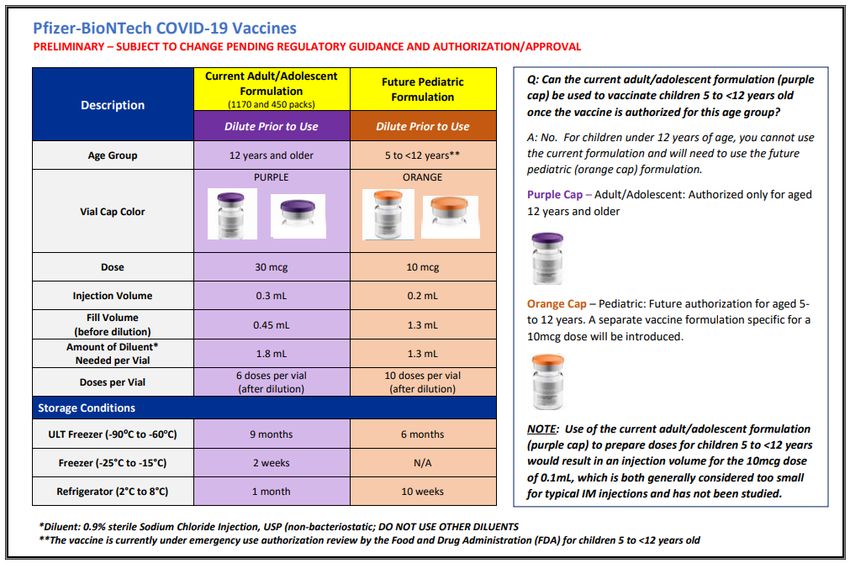
What do we know about
      COVID-19 impact on
      Michigan children and
      schools

                       National                        Public Health     Other      Science
Special Populations                Spread   Severity
                      Comparison                        Response       Indicators   Roundup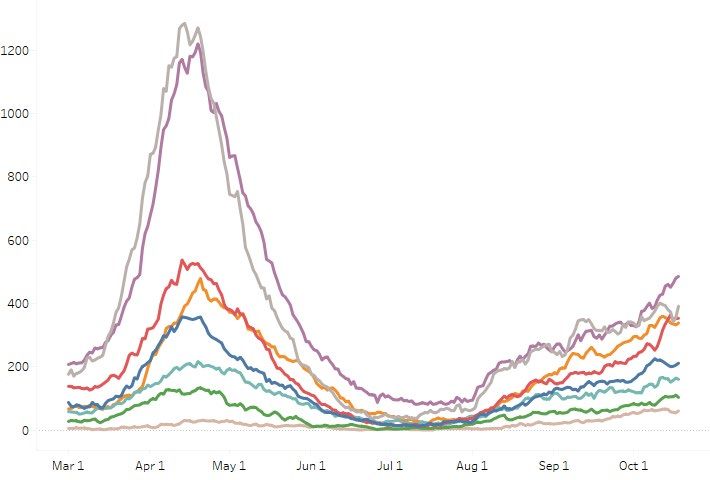
Number of Weekly Reported Outbreaks
Number of outbreak investigations by site type, week ending Oct 14
Visibility1 Easier to identify outbreak
Site type Outbreaks by ongoing/new classification, # Harder to identify outbreak
Ongoing New Total
K- 12 SCHO O L 308 100 408 Total number of active
SNF/L T C/ O T HE R A SSIS T E D LIV ING 114 34 148 outbreaks is up 3% from
MA NUF A CT UR IN G , CONS T R U CT IO N 35 11 46 previous week, with 190 new
CHIL DCA R E/Y O U T H PRO G RA M 22 15 37 outbreaks identified
*RETA IL 21 4 25
OTHER 16 4 20
K-12 schools reported the
*SOCIA L GA THER IN G 10 8 18
greatest number of new
CORRE C T I O N S 12 5 17
outbreaks and clusters (100)
HEA L T HCA R E 13 1 14
10 2 12
this week, and there were an
OFF ICE SET T IN G
11 1 12
additional 15 new outbreaks in
*RES TA U RA N T S A ND BA RS
COLL EG E/ U N IV E R S IT Y 7 0 7 childcare and youth programs
*SHEL T E RS 3 2 5 for a total of 115 outbreaks in
*REL I G I O U S SERV I CE S 2 1 3 settings primarily with 0-19-
*PER S O NA L SERV IC E S 2 1 3 year-olds. (61% of all known
*CO MMU N IT Y EXPO S UR E - INDO O R 2 0 2 new outbreaks)
*CO MMU N IT Y EXPO S UR E - OUT DO O R 0 1 1
A GRICU L T U RA L / F O O D PRO CE S S I NG 1 0 1 The next greatest number of
779 new outbreaks was among
TO TA L 589 190
SNF/LTC (34), followed by
1. Based on a setting’s level of control and the extent of time patrons/residents spend in the particular setting, different settings have differing levels of ability to ascertain whether a case derived from that setting manufacturing/construction
NOTE: Many factors, including the lack of ability to conduct effective contact tracing in certain settings, may result in significant underreporting of outbreaks. This chart does not provide a complete picture of (11), social gathering (8), and
outbreaks in Michigan and the absence of identified outbreaks in a particular setting in no way provides evidence that, in fact, that setting is not having outbreaks. 10 other settings with at least 1
NOTE (10/4): MDHHS adopted the new CSTE school cluster and outbreak definition which impacts how transmissions within school-sponsored settings are reported to the health department
new outbreak in the last week.
Source: LHD Weekly Sitreps
National Public Health Other Science
Special Populations Spread Severity 10
Comparison Response Indicators RoundupK-12 school clusters and outbreaks, recent and ongoing, week ending Oct 14
Number of reported outbreaks increased 4% since last week (393 to 408), including increases in High Schools (133 to 138), and Pre K-
Elementary (164 to 182). Middle/Jr High (92 to 85), and Administration declined (4 to 3) since last week.
Number of Range of cases
Region Number of reported cases, # # Ongoing - Excluding New # New outbreaks per outbreak
Region 1 344 57 57 2-26
Region 2n 245 502 74 2-53
Region 2s 139 64 26 2-27
Region 3 871 86 90 2-48
Region 5 121 25 21 3-52
Region 6 433 67 74 2-61
Region 7 132 40 32 2-14
Region 8 371 13 34 3-46
Total 2,656 854 408 2-61
Number of Range of cases
Grade level Number of reported cases, # # Ongoing - Excluding New # New outbreaks per outbreak
Pre-school - elem. 893 255 182 2-42
Jr. high/middle school 577 169 85 2-48
High school 1,179 427 138 2-61
Administrative 73 3 2-5
Total 2,656 854 408 2-61
Many factors, including the lack of ability to conduct effective contact tracing in certain settings, may result in significant underreporting of outbreaks. This chart does not provide a complete picture
of outbreaks in Michigan and the absence of identified outbreaks in a particular setting in no way provides evidence that, in fact, that setting is not having outbreaks.
NOTE (10/4): MDHHS adopted the new CSTE school cluster and outbreak definition which impacts how transmissions within school-sponsored settings are reported to the health department
Source: LHD Weekly Sitreps
National Public Health Other Science
Special Populations Spread Severity 11
Comparison Response Indicators RoundupPreparing for Pfizer-BioNTech COVID-19 Vaccines
Rollout for 5- to 11-year-olds
Vaccines and Related Biological Meeting October 26th
Products Advisory Committee
(VRBPAC) / Food and Drug
Administration (FDA)
Meeting November 2nd and 3rd
Advisory Committee on
Immunization Practice (ACIP)
Expected day on/after ACIP
Centers for Disease Control and
Prevention (CDC) Director
RecommendationFull Series
expected to
be two doses
three weeks
apart
https://downloads.aap.org/DOPCSP/PfizerPedsOnePagerForPlanning-10.14.21.pdfPreparing for Pfizer-BioNTech COVID-19 Vaccines
Rollout for 5- to 11-year-olds ~840,000 Michigan
• Communication to providers children aged 5 to 11
• Communication to the public
• Inclusive and equitable vaccine distribution
• Utilizing data to monitor progress and guide
decision making
• Working to prepare key partners to make
vaccine available to 5- to 11-year-olds: Number of 5- to 11-
year-olds by county
• Pediatric Provider Offices
• School-based health programs
• Pharmacies
• Federally Qualified Health Centers
• Local Health Departments
• Opportunity to co-administer on vaccines!MI School Districts and Mask Policy as of Oct 18, 2021
Yes – Any masking policy in some subset of school grades
No – No mask policies (includes unknown)
NUMBER OF SCHOOL DISTRICTS NUMBER OF STUDENTS* IN SCHOOL NUMBER OF SCHOOL
WITH MASK POLICIES IN K-12 DISTRICTS WITH MASK POLICIES DISTRICTS WITH MASK POLICY
SETTINGS REVERSAL
600
500
No,
502,451 400
Yes, 222
300
Yes, 200
No, 311 750,357
100
0
Mask Policy Present No Mask Policy Mask Policy Rescinded
• 42% (222/533) of K-12 school districts have mandatory mask policies
• School districts with mandatory mask policies cover 60% (750,357/1,252,808) of K-12 students*
• Not all K-12 grades or students may be covered by masks polices; examples include policies for those through K-6, or only during higher levels
of community transmission
• 7% of K-12 school districts have rescinded their mask policies
* Student size based on school enrollment numbers; Buses and public transportation are federally required to enforce mask mandates
Source: Executive Office of Governor School District Mask Policy Database
National Public Health Other Science
Special Populations Spread Severity
Comparison Response Indicators RoundupCase increases are largest in school aged children
(5-18 year-olds), followed by 31-50 year-olds
First days of school
in Michigan
Data source:
MDSS case
data through
10/8/21,
data as of
10/15/2021Districts without First days
of school in Few/no mask rules
mask requirements Michigan
are experiencing Partial mask rules
higher case rates Masks required
• 5–18-year-old school population case
rates are higher and rose faster in
districts without mask requirements
• Districts with complete or partial
7-day Avg
mask requirements have seen lower
case rates with slower increases
• Note districts may change categories Masks required Partial mask requirements Few/no mask requirements
as mask rules change
First days First days First days
• Note that districts with mask rules of school of school of school
may also have other prevention in
Michigan
in
Michigan
in
Michigan
measures (vaccination, testing, etc.)
that reduce transmission levels
Masks required = mask required for all grades; Partial
mask req. = tiered, some grades, based on vax status,
staff only; Few/no req. = no req. or buses only. Blue
line & shaded region is a linear trend fit. Data Sources:
MDSS/MDHHS case data through as of 10/15/21
geocoded to school district, EOG School District Mask
Policy Tracker data. Note: Cases are among all 5-18 year
olds, population is the school-enrolled population. Aug 01 Aug 15 Sep 01 Sep 15 Oct 01 Aug 01 Aug 15 Sep 01 Sep 15 Oct 01 Aug 01 Aug 15 Sep 01 Sep 15 Oct 01Global, National and Michigan Trends
Global and National Comparisons
  Globally, 240,786,306 cases and 4,900,724 deaths (Data* through
  10/18/21)
  •   Countries with the highest case count are U.S. (44,934,635), India                                               National and Michigan 7-day average New Cases per 100K†
      (34,081,315), and Brazil (21,644,464)                                                                            100

  United States: Nearly all US jurisdictions have High community
                                                                                                                        75
  transmission¶
  •   Nationally, the 7-day moving average of daily new cases decreased
      12.5% compared with previous 7-day moving average                                                                 50
  •   Percent positivity has decreased from the previous week, now at
      5.7%. The number of PCR tests performed has decreased.
                                                                                                                        25
  •   While national case rates are decreasing, Michigan case rates
      continue to increase and are higher than U.S. rate
                                                                                                                             0
  Midwest states maintain High transmission levels†                                                                              3/1   5/1   7/1    9/1    11/1     1/1     3/1      5/1   7/1   9/1
  •  Overall decline in Region 5 but some states (MI, MN) are seeing                                                                                   Michigan      United States
     increases

     Source: * Johns Hopkins Coronavirus Resource Center; ¶ CDC COVID Data Tracker Weekly Review; † CDC COVID Data Tracker

                                    National                                                                                           Public Health                Other                  Science
Special Populations                                                      Spread                           Severity
                                   Comparison                                                                                            Response                 Indicators               Roundup
State Comparison: Ohio and Indiana
Ohio Confirmed New Cases / 1M (7 days average) Indiana Confirmed New Cases / 1M (7 days average)
1000
1000
500
500
0 0
Jul 1, 20 Sep 1, 20 Nov 1, 20 Jan 1, 21 Mar 1, 21 May 1, 21 Jul 1, 21 Sep 1, 21 Jul 1, 20 Sep 1, 20 Nov 1, 20 Jan 1, 21 Mar 1, 21 May 1, 21 Jul 1, 21 Sep 1, 21
60K
60K Percent Positive (7 day average) New Tests
Percent Positive (7 day average) 11.2%
40K
40K
New Tests
9.5%
20K 20K
0K 0K
Jul 1, 20 Sep 1, 20 Nov 1, 20 Jan 1, 21 Mar 1, 21 May 1, 21 Jul 1, 21 Sep 1, 21 Jul 1, 20 Sep 1, 20 Nov 1, 20 Jan 1, 21 Mar 1, 21 May 1, 21 Jul 1, 21 Sep 1, 21
0 0
-50 Mobility retails and recreational -50 Mobility retails and recreational
400 400
Hospitalizations / 1M 254 Hospitalizations / 1M
200 200 201
0 0
Jul 1, 20 Sep 1, 20 Nov 1, 20 Jan 1, 21 Mar 1, 21 May 1, 21 Jul 1, 21 Sep 1, 21 Jul 1, 20 Sep 1, 20 Nov 1, 20 Jan 1, 21 Mar 1, 21 May 1, 21 Jul 1, 21 Sep 1, 21State Comparison: Wisconsin and Michigan
Wisconsin Confirmed New Cases / 1M (7 days average) Michigan Confirmed New Cases / 1M (7 days average)
800
1000
600
400
500
200
0 0
Jul 1, 20 Sep 1, 20 Nov 1, 20 Jan 1, 21 Mar 1, 21 May 1, 21 Jul 1, 21 Sep 1, 21 Jul 1, 20 Sep 1, 20 Nov 1, 20 Jan 1, 21 Mar 1, 21 May 1, 21 Jul 1, 21 Sep 1, 21
60K 90K
80K
Percent Positive (7 day average) New Tests
70K
40K 60K Percent Positive (7 day average)
50K
New Tests
8.8%
40K 10.3%
20K 30K
20K
10K
0K
Jul 1, 20 Sep 1, 20 Nov 1, 20 Jan 1, 21 Mar 1, 21 May 1, 21 Jul 1, 21 Sep 1, 21 Jul 1, 20 Sep 1, 20 Nov 1, 20 Jan 1, 21 Mar 1, 21 May 1, 21 Jul 1, 21 Sep 1, 21
0 0
-50 Mobility retails and recreational -50 Mobility retails and recreational
-100
400 400
300 Hospitalizations / 1M
Hospitalizations / 1M 204
200 195 200
100
0
Jul 1, 20 Sep 1, 20 Nov 1, 20 Jan 1, 21 Mar 1, 21 May 1, 21 Jul 1, 21 Sep 1, 21 Jul 1, 20 Sep 1, 20 Nov 1, 20 Jan 1, 21 Mar 1, 21 May 1, 21 Jul 1, 21 Sep 1, 21State Comparison: Illinois and Minnesota
Illinois Confirmed New Cases / 1M (7 days average) Minnesota Confirmed New Cases / 1M (7 days average)
1000 1000
500 500
0 0
Jul 1, 20 Sep 1, 20 Nov 1, 20 Jan 1, 21 Mar 1, 21 May 1, 21 Jul 1, 21 Sep 1, 21 Jul 1, 20 Sep 1, 20 Nov 1, 20 Jan 1, 21 Mar 1, 21 May 1, 21 Jul 1, 21 Sep 1, 21
100K
100K
Percent Positive (7 day average) New Tests
Percent Positive (7 day average)
9.5%
50K New Tests
50K
2.6%
0K 0K
May 1, 20 Jul 1, 20 Sep 1, 20 Nov 1, 20 Jan 1, 21 Mar 1, 21 May 1, 21 Jul 1, 21 Sep 1, 21 May 1, 20 Jul 1, 20 Sep 1, 20 Nov 1, 20 Jan 1, 21 Mar 1, 21 May 1, 21 Jul 1, 21 Sep 1, 21
0
0
-50 Mobility retails and recreational -50
Mobility retails and recreational
400
300
300 Hospitalizations / 1M
Hospitalizations / 1M 200 163
200
100 100
110
0
May 1, 20 Jul 1, 20 Sep 1, 20 Nov 1, 20 Jan 1, 21 Mar 1, 21 May 1, 21 Jul 1, 21 Sep 1, 21 May 1, 20 Jul 1, 20 Sep 1, 20 Nov 1, 20 Jan 1, 21 Mar 1, 21 May 1, 21 Jul 1, 21 Sep 1, 21Key Messages: COVID-19 Burden Among Younger Ages Remains High
Statewide positivity increased 11.3% (last week: 11.2%)
• This is a 1% increase in the past week (prior week: 9% increase)
• Positivity is increasing in most MERC regions
• Positivity in five regions is above 15%
Case rate has increased to 315.7 cases/million (last week: 304.4 cases/million)
• Increasing for three and a half months (June 26 low)
• Cases per million are plateaued or increasing in most MERC regions;
• 10-19-years-olds are experiencing the greatest case burden (648 daily cases; 516.3 cases/mil)
Michigan is at High Transmission level
• Nearly all counties in Michigan are at high transmission level
• CDC recommends all individuals, regardless of vaccination status, should mask indoors
• The U.S. is at high transmission level (142.9 cases/100,000 in last 7 days) with 52 states/territories in substantial or high transmission
Number of active outbreaks is up 3% from last week
• 190 new outbreaks were identified in the past week
• K-12 reported the most total outbreaks (308) and new outbreaks (100) this week
National Public Health Other Science
Special Populations Spread Severity
Comparison Response Indicators RoundupConfirmed and probable case indicators Risk levels
Table Date: 10/18/2021 (7 days from date table was produced: 10/11/2021) Low A B C D E
Cases Positivity
National Public Health Other Science
Special Populations Spread Severity 25
Comparison Response Indicators RoundupTime Trends – Positivity, Case Rates, Hospitalizations, Deaths
COVID-19 transmission remains high, and several indicators continue to show increases
Daily Positive Test Rate Daily Inpatient Beds Occupied by COVID patients
Daily Case Rate Daily Deaths
National Public Health Other Science
Special Populations Spread Severity 26
Comparison Response Indicators RoundupMichigan Lag adjusted new COVID cases by onset date
New confirmed cases by onset actual and adjusted as of October 18, 2021 (-2 days)
• The gray line is cases reported
3500
ADJUSTED as of 10/18 by onset date.
NEW_CASES
• The blue line is the expected
3000
adjustment for cases by onset
date as data is backfilled
2500
• The increasing delay between
onset of symptoms and date
2000
of testing means that recent
case numbers underestimate
1500
the true number of cases
1000
500
0
Jun 1 Jun 11 Jun 21 Jul 1 Jul 11 Jul 21 Jul 31 Aug 10 Aug 20 Aug 30 Sep 9 Sep 19 Sep 29 Oct 9 Oct 19Michigan at High Transmission Level
Dashboard | CDC | MI Start Map for most recent data by
reporting date
National Public Health Other Science
Special Populations Spread Severity 28
Comparison Response Indicators RoundupTime Trends – Annual Comparison
We are heading into the winter months (and holiday season) starting at higher cases rates than last
year
7- day rolling average of Rates 2020 vs 2021
800 2020 Holiday wave
Alpha (B.1.1.7) wave
700
600
500
400
Delta (B.1.617.2) wave
300
First wave
200
100
0
3/1 4/1 5/1 6/1 7/1 8/1 9/1 10/1 11/1 12/1 1/1 2/1
Weekly Case Rate 2020 Weekly Case Rate 2021
National Public Health Other Science
Special Populations Spread Severity 29
Comparison Response Indicators RoundupCase Rate Trends by Age Group
Daily new confirmed and probable cases per million by age group (7-day rolling average)
0-9 30-39 60-69
10-19 40-49 70-79
1000 20-29 50-59 80+ 600
750
400
500
200
250
0 0
3/1 5/1 7/1 9/1 11/1 1/1 3/1 5/1 7/1 9/1 6/26 7/10 7/24 8/7 8/21 9/4 9/18 10/2
• Case rate trends for all age groups are plateaued or increasing
• Case rates for all age groups are between 223 and 516 cases per million (through 10/10)
• Case rates are highest for 10-19-year-olds; case rate are increasing fastest for 80+ (+21%)
Note: Case information sourced from MDHHS and reflects date of onset of symptoms
Source: MDHHS – Michigan Disease Surveillance System
National Public Health Other Science
Special Populations Spread Severity 30
Comparison Response Indicators RoundupNumber of Cases and CaseRates by Age Group, data as of Oct 18
Daily new confirmed and probable cases per million by age group (7-day rolling average)
Age Average† Average† One Week • Trend numbers and comparisons are being
Group daily cases Daily Case % Change (Δ #)* impacted by longer backfill times – the data
Rate in this table are comparing the two time
0-9 316.7 274.7 -2% (-6) points from the most recent data file
10-19 647.9 516.3 2% (+12) • Average daily number of cases (647.9) and
20-29 409.7 297.0 -3% (-13) avg. daily case rate (516.3 case/mil) are
highest for those aged 10-19
30-39 476.7 293.0 -5% (-24)
• This week the highest growth was among
40-49 406.9 345.0 1% (+3)
those 80+ (21%)
50-59 366.3 271.3 -Case Rates by Reported Racial and Ethnic Group
Daily new confirmed and probable cases per million Daily new confirmed and probable cases per
(7 day rolling average) by race category million (7 day rolling average) by ethnicity category
400 American Indian/Alaska Native Black/African American 400 Hispanic or Latino Not Hispanic or Latino
Asian/Pacific Islander White
Race Case Rate
Race Case Rate
300 American Indian/ 325.8 300
Alaskan Native Hispanic/Latino 216.5
Asian/Pacific Islander 83.2 Non-Hispanic 224.0
200 Black/African American 144.9 200
White 239.8
100 100
0 0
6/26 7/10 7/24 8/7 8/21 9/4 9/18 10/2 6/26 7/10 7/24 8/7 8/21 9/4 9/18 10/2
Updates since last week:
• Cases per million are plateaued for most racial and ethnic groups but the delay in reporting is impacting trend analysis
• The high number of cases with missing race/ethnicity data, and those multiracial or other are impacting the case rates shown here
• American Indian/Alaskan Native have the highest case rates but are declining; Case rates for Non-Hispanic recently surpassed that
for Hispanics
• In the past 30 days, 23% (↓1%) of race data and 28% (↓1%) ethnicity data was either missing or reported as unknown
Note: Case information sourced from MDHHS and reflects date of death of confirmed and probable cases.
Source: MDHHS – Michigan Disease Surveillance System
National Public Health Other Science
Special Populations Spread Severity 32
Comparison Response Indicators RoundupIdentified COVID-19 Cases Caused by Variants of Concern (VOC) in
US and Michigan
SARS-CoV-2 Variants Circulating in the Variants of Concern in Michigan, Oct 18
United States, Oct 1 – Oct 9 (NOWCAST)
• CDC has reclassified other VOCs
as variants being monitored
• Variants are downgraded when
there has been a significant and
sustained reduction in
prevalence, or variant no longer
poses significant risk to public
health
• Currently, only Delta (B.1.617.2)
remains a VOC
154 cases in Wayne attributed to Detroit
Variant MI Reported Cases¶ # of Counties MDHHS Est. Prevalence
Data last updated Oct 18, 2021 B.1.617.2 (delta) 5,916 82 100%
Source: MDSS
National Public Health Other Science
Special Populations Spread Severity
Comparison Response Indicators RoundupKey Messages: Healthcare Capacity and COVID Severity
Emergency Department visits, Hospital Admissions, and Hospital Census are increasing
5.1% of ED visits are for COVID diagnosis (up from 4.9% last week)
Hospital admissions have plateaued for most age groups this week
The largest one week increase in number of admissions was among those 50-59 years of age
Hospital census has increased 4% (vs. up 18% week prior)
Three regions experienced increasing trends in hospital census this week (Regions 2S, 3, and 7)
Regions 2S, 3, 6, and 7 now have above 200/million population hospitalized, and Region 3 is above 300/million
Overall, volume of COVID-19 patients in intensive care has plateaued since last week (vs. 15% increase last week)
Death rate has increased to 3.4 daily deaths/million residents (up from 3.0 deaths/million last week)
Overall trends for daily average deaths are increasing for American Indian/Alaskan Natives, Blacks/African
Americans, Whites, Non-Hispanics, and Hispanics
Currently, American Indian/Alaskan Natives and Whites have the highest death rate (3.3 deaths/million)
In the past 30 days, there have been between 1 and 5 deaths among confirmed and probable COVID-19 cases under
the age of 20
National Public Health Other Science
Special Populations Spread Severity
Comparison Response Indicators RoundupMichigan Trends in Emergency Department (ED) Visits for
Diagnosed COVID-19
5.1%
• Trends for ED visits have increased to 5.1% since last week (4.9% week prior)
• Trends vary by age groups with most age groups seeing an increase
• Over past week, those 65-74 years saw highest number of avg. daily ED CLI visits (7.0%), but those between 40+ all above state average
Source: https://covid.cdc.gov/covid-data-tracker/#ed-visits; data extracted on 10/18/2021
National Public Health Other Science
Special Populations Spread Severity
Comparison Response Indicators RoundupAverage Hospital Admissions by Age Groups
75
60
45
30
15
0
9/12 9/19 9/26 10/3 10/10 10/17
0 - 11 12 - 17 18 - 19 20 - 29 30 - 39 40 - 49 50 - 59 60 - 69 70 - 79 80+ Age
Unkn
• Trends for daily average hospital admissions have decreased 4% since last week (vs. 22% increase prior week)
• Most age groups experienced a one week decrease in daily hospital admissions
• Over the past week, those 60-69 years have seen the highest number of avg. daily hospital admissions (53 admissions)
Source: CHECC & EM Resource
National Public Health Other Science
Special Populations Spread Severity 36
Comparison Response Indicators RoundupAverage Hospital Admissions Are Increase for all Age Groups
60-69
Peds
• Trends for daily average hospital admissions have decreased 4% since last week (vs. 22% increase prior week)
• Most age groups experienced a one week decrease in daily hospital admissions
• Over the past week, those 60-69 years have seen the highest number of avg. daily hospital admissions (53 admissions)
Source: CHECC & EM Resource
National Public Health Other Science
Special Populations Spread Severity 37
Comparison Response Indicators RoundupNumber of Hospital Admissions and Admission Rates are Increasing for Most
Age Groups
Daily new hospital admission per million by age group (7 -day rolling average)
Age Average† daily Average† Daily One Week • Through October 18, there were an average of 252
Group number of hospital Hospital % Change (Δ #) hospital admissions per day due to COVID-19, which
admissions Admission Rate* is 10 (-4%) fewer than last week
0-11 4.6 3.3 39% (+1) • Most age groups saw a decline but several continued
12-17 2.4 3.2 -29% (-1) to increase
18-19 2.0 7.6 27% (+Average and total new deaths, by age group
Daily COVID-19 deaths in confirmed and probable Total COVID -19 deaths in confirmed and probable
cases per million by age group (7 day rolling average) cases by age group (past 30 days, ending 10/11/2021)
30 0-19 40-49 70-79 • 23% of deaths below age sixty
287
20-29 50-59 80+ 271
30-39 60-69 Total
20 194
133
10
55
29
9
1-5
0
7/22 8/5 8/19 9/2 9/16 9/30 10/14 0-19 20-29 30-39 40-49 50-59 60-69 70-79 80+
• Through 10/11, the 7-day avg. death rate is more than 10 daily deaths per million people for those over the age of 70
• In the month, there have been between 1-5 deaths among confirmed and probable COVID-19 cases under the age of 20
• 30-day proportion of deaths among those under 60 years of age is steady from the prior week
Note: Death information sourced from MDHHS and reflects date of death of confirmed and probable cases.
Source: MDHHS – Michigan Disease Surveillance System (MDSS)
National Public Health Other Science
Special Populations Spread Severity 39
Comparison Response Indicators Roundup30-day rolling average daily deaths per million people by race and
ethnicity
Average daily deaths per million people by race Average daily deaths per million people by
ethnicity
6 American Indian/Alaska Native Black/African American 6 Hispanic or Latino Not Hispanic or Latino
Asian/Pacific Islander White
4 4
2 2
0 0
7/22 8/5 8/19 9/2 9/16 9/30 10/14 7/22 8/5 8/19 9/2 9/16 9/30 10/14
• Overall trends for daily average deaths are increasing for American Indian/Alaskan Natives, Blacks/African American, Whites, Non-
Hispanics, and Hispanics
• Currently, American Indian/Alaskan Natives and Whites have the highest death rate (3.3 deaths/million)
• In the past week, Hispanics have seen the largest increase in death rates (+22%)
Note: Death information sourced from MDHHS and reflects date of death of confirmed and probable cases.
Source: MDHHS – Michigan Disease Surveillance System
National Public Health Other Science
Special Populations Spread Severity 40
Comparison Response Indicators RoundupStatewide Hospitalization Trends: Total COVID+ Census
Hospitalization Trends 3/1/2021 – 10/18/2021
The COVID+ census in hospitals has
Confirmed Positive & Persons Under Investigation (PUI) increased 4% from the previous week
(previous week’s increase was 18%)
Confirmed Positive
Hospitalized COVID Positive Long Term
Trend (beginning March 2020)
PUIStatewide Hospitalization Trends: Regional COVID+ Census
The census of COVID+ patients has increased in
Hospitalization Trends 3/1/2021 – 10/18/2021 3 regions and decreased slightly in the other
Confirmed Positive by Region regions of the state. Regions 2S and 3 show the
largest increases this week.
Region 1
Region 2N
Region 2S Regions 3 is over 300/M population hospitalized
Region 3 and Regions 2S, 6 and 7 have greater than 200
Region 5
Region 6 hospitalizations/M.
Region 7
Region 8 Region COVID+ Hospitalizations (% COVID+
Δ from last week) Hospitalizations /
MM
Region 1 211 (-5%) 195/M
Region 2N 391 (-2%) 177/M
Region 2S 485 (14%) 218/M
Region 3 353 (23%) 311/M
Region 5 160 (-2%) 168/M
Region 6 338 (-5%) 230/M
Region 7 103 (10%) 206/M
Region 8 60 (-5%) 193/MStatewide Hospitalization Trends: ICU COVID+ Census
Overall, the census of COVID+ patients in ICUs is flat
Hospitalization Trends 3/1/2021 – 10/18/2021 from last week. ICU census in Regions 2S, 3, 5, and 7
Confirmed Positive in ICUs has increased from last week.
Regions 1, 2S, and 3 have overall adult ICU
occupancy greater than or equal to 85% .
Regions 6 and 7 have >35% of ICU beds occupied
with COVID+ patients.
Region Adult COVID+ in Adult ICU % of Adult ICU beds
ICU (% Δ from last Occupancy COVID+
week)
Region 1 54 (-4%) 89% 29%
Region 2N 95 (0%) 72% 17%
Region 2S 123 (6%) 85% 18%
Confirmed Region 3 82 (4%) 93% 24%
Positive in ICU
Region 5 36 (9%) 72% 19%
Region 6 81 (-10%) 79% 36%
Region 7 53 (18%) 82% 38%
Region 8 17 (-15%) 65% 27%• `
Key Messages: Public Health Response
COVID-19 Vaccination
• 3,733 first doses administered each day (7-day rolling average*); total administrations increasing
• Most administered frequently by pharmacies, local health departments, and hospitals
• More than 357,471 third doses administered as of 10/14, may include additional dose or booster dose
• Nearly 5.3 million people (53.0% of the population) in the state are fully vaccinated
Breakthrough
• Less than 1% of people who were fully vaccinated experienced vaccine breakthrough
• Trends over time show that both case and death rates among the Fully Vaccinated are lower than the Not Fully
vaccinated rates in Michigan
• Rate of cases and deaths in unvaccinated individuals is much higher (499 vs 85 and 3.0 vs 0.9, respectively) than
those who are fully vaccinated
*Source: https://covid.cdc.gov/covid-data-tracker/#vaccination-trends_vacctrends-onedose-daily
National Public Health Other Science
Special Populations Spread Severity
Comparison Response Indicators Roundup`
Potential COVID-19 Vaccination Breakthrough Cases
Michigan part of CDC’s nationwide investigation (COVID-19 Breakthrough Case Investigations and Reporting | CDC)
Michigan Data (1/1/21 through 10/12/21):
• 39,685 cases met criteria based on a positive test 14 or more days after being fully vaccinated
• Less than 1% of people who were fully vaccinated met this case definition
• Includes 625 deaths (549 in persons ages 65 years or older)
• 1,448 cases were hospitalized
• Vaccine breakthrough cases are expected. COVID-19 vaccines are effective and are a critical tool to bring the pandemic under control;
however, no vaccine is 100% effective at preventing illness. Some fully vaccinated people will get sick, and some will even be
hospitalized or die from COVID-19. However, there is evidence that vaccination may make illness less severe for those who are
vaccinated and still get sick. The risk of infection, hospitalization, and death are all much lower in vaccinated people compared to
unvaccinated.
• More than 187 million people in the United States have been fully vaccinated as of October 12, 2021. CDC is monitoring these cases
among vaccinated persons and evaluating trends in order to better understand who is at risk for severe COVID-19 following vaccine
breakthrough infection. Vaccinated people have also experienced asymptomatic infections.
• Current data suggest that COVID-19 vaccines authorized for use in the United States offer protection against most SARS-CoV-2 variants
circulating in the United States.
National Public Health Other Science
Special Populations Spread Severity
Comparison Response Indicators RoundupCumulative COVID-19 Cases by Vaccination Status, Michigan, Jan 15 – Oct 12
Fully Vaccinated People (4,983,732)
Cases Hospitalization Deaths
Percent of Cases In People Not Percent of Hospitalizations In People Percent of Deaths In People Not
Fully Vaccinated Not Fully Vaccinated Fully Vaccinated
(534,171 /573,856) (14,049 / 15,497) (5,924 / 6,549)
93.1% 90.7% 90.5%
534,171 14,049 5,924
Total Cases Not Fully Vaccinated Total Hospitalized Not Fully Vaccinated Total Deaths Not Fully Vaccinated
Total Breakthrough Cases Total Breakthrough Hospitalizations Total Breakthrough Deaths
39,685 1,448 625
0.796% 0.029% 0.013%
Percent of Fully Vaccinated People who Percent of Fully Vaccinated People Who Were Percent of Fully Vaccinated People Who Died of
Developed COVID-19 (39,685 / 4,983,732) Hospitalized for COVID-19 (1,448 / 4,983,732) COVID-19 (625 / 4,983,732)
6.9% 9.3% 9.5%
Percent of Cases Who Were Fully Vaccinated Percent of Hospitalizations Who Were Fully Percent of Deaths Who Were Fully Vaccinated
(39,685 / 573,856) Vaccinated (1,448 / 15,497) (625 / 6,549)
Total Cases: 573,856 Total Hospitalizations: 15,497 Total Deaths: 6,549
Michigan Disease Surveillance System may underestimate the frequency of COVID-19 hospitalizations:
- Case investigation and follow-up is more difficult for individuals who get vaccinated (e.g., they are too ill to speak to investigators, don’t answer their phone, or otherwise).
- These hospitalizations include individuals who are hospitalized for issues other than COVID19 (the same as breakthrough COVID-19).
- Individuals who get hospitalization will lag after infection and may occur after case investigation.
National Public Health Other Science
Special Populations Spread Severity
Comparison Response Indicators RoundupTrends in Breakthrough Cases, Hospitalizations, and Deaths
100%
• 53% of the population is fully
90%
vaccinated yet only account for ~20-
25% of cases, hospitalizations, and 80%
deaths in September 70%
• As the fully vaccinated population 60%
has increased, so have the percent
50%
of breakthrough incidents; but
breakthrough burden remains lower 40%
29%
30% 25% 25% 25%
24% 23%
22% 21% 22%
20% 20%
In the last 30 days (Sep 13 – Oct 12), 20% 18%
15%
13%
10,132 (10.6%) of 95,990 cases, 199 11% 12%
11%
10% 5% 6%
(15%) of 1,329 hospitalizations, and 92
5%
1% 2% 2% 2%
0% 0% 0% 0% 0% 0%
(20%) of 460 deaths were among fully 0%
vaccinated individuals
Cases Hospitalizations Deaths
Michigan Disease Surveillance System may underestimate the frequency of COVID-19 hospitalizations:
- Case investigation and follow-up is more difficult for individuals who get vaccinated (e.g., they are too ill to speak to investigators, don’t answer their phone, or otherwise).
- These hospitalizations include individuals who are hospitalized for issues other than COVID19 (the same as breakthrough COVID-19).
- Individuals who get hospitalization will lag after infection and may occur after case investigation.
National Public Health Other Science
Special Populations Spread Severity
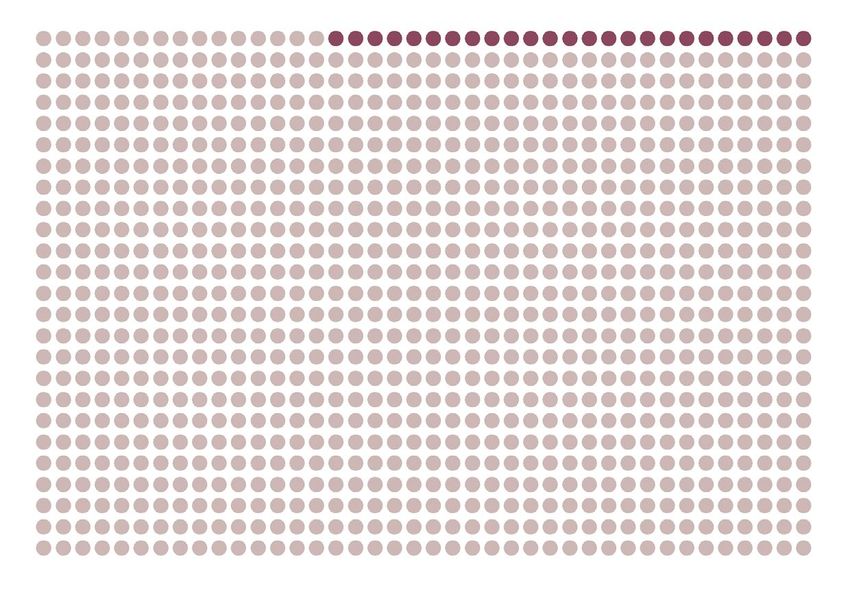
Comparison Response Indicators RoundupWhen more people are vaccinated, more cases will
come from the vaccinated population
50% Vaccinated 90% Vaccinated
25 5
At this Now more
vaccination Unvaccinated
cases are
level, most vaccinated! But
Unvaccinated cases are the vaccine is 9
unvaccinated still working
36 would have
been infected,
5 stopped by
20 would have vaccination
been infected, Vaccinated
stopped by
vaccination
Vaccinated
Both Scenarios: Vaccine reduces disease by 80%, 2.5% infection level, 2000 total peopleWhen more people are vaccinated, more cases will
come from the vaccinated population
100% Vaccinated
Now all cases • As vaccine coverage increases,
10 are vaccinated! more cases will be vaccinated
But the vaccine
is still working • Until at 100% coverage, all
cases are vaccinated
40 would have • However, the proportion of
Vaccinated been infected,
stopped by vaccinated people who get sick
vaccination is much smaller than the
proportion of unvaccinated
people who get sick
Scenario setup: Vaccine reduces disease by 80%, 2.5% infection level, 2000 total people`
COVID-19 Vaccination Breakthrough Cases and Deaths
1200 Breakthrough Case Rate vs. Not Fully Vaccinated Breakthrough Death Rate vs. Not Fully Vaccinated
Case Rate Death Rate
1000 Case Rate among Fully Vaccinated
12
Case Rate among Not Fully Vaccinated
800 10
8
600
6
400
4
200
2
0 0
1/25 2/25 3/25 4/25 5/25 6/25 7/25 8/25 9/25 1/25 2/25 3/25 4/25 5/25 6/25 7/25 8/25 9/25
• Trends over time show that both case and death rates among the Fully Vaccinated are lower than the Not Fully vaccinated rates in Michigan
• The proportion of breakthrough cases and deaths among all cases and deaths has shown some increases as more people become fully
vaccinated
• However, the risk of infection and death remains significantly lower among the fully vaccinated
National Public Health Other Science
Special Populations Spread Severity
Comparison Response Indicators Roundup• `
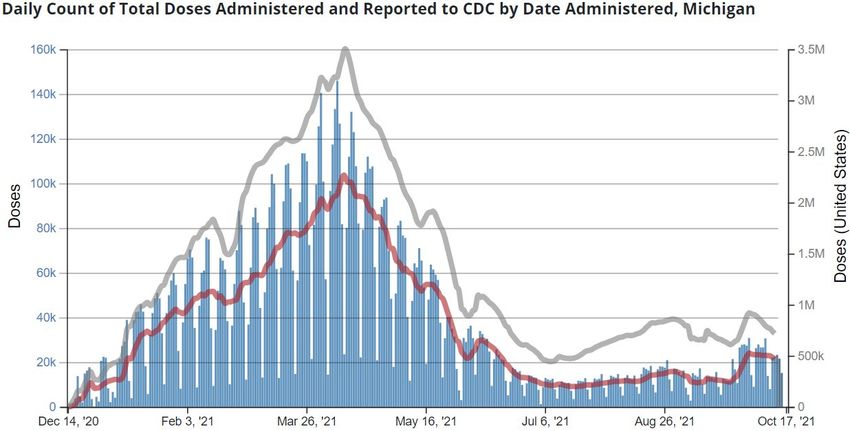
Average daily doses administered declining (data through 10/18/2021)
14,035,320 doses delivered to providers and
11,099,066 doses administered*
MI 7-day rolling average ending October 12th
• 21,403 total doses/day on average† (23,349 on 10/5)
• 3,733 first doses/day on average † (4,200 on 10/5)
Total primary series doses in month of September were
most frequently administered¶ by:
Pharmacies (209,095)
LHD (17,244) and hospitals (15,3846)
Family practice (10,733) and FQHCs (8,874)
Third Doses
• 357,471 third doses administered as of 10/18
Source: *CDC COVID Data Tracker > Vaccinations in the US, † CDC COVID Data Tracker > Vaccination Trends; ¶ MCIR COVID-19 Vaccine Dashboard
National Public Health Other Science
Special Populations Spread Severity
Comparison Response Indicators RoundupNearly 5.3 Million Michiganders fully vaccinated and 53.0% of total population fully
vaccinated
Vaccination Coverage in Michigan as of 10/17/21
Nearly 5.3 million people in the state are Age Group % At Least % Fully Number Fully
fully vaccinated*
One Dose Vaccinated Vaccinated
84.2% of people aged 65 and older have
completed the series (↑0.2%)* Total Population 57.5% 53.0% 5,289,008
57.5% of total population initiated (↑0.2%)* ≥ 12 years 66.8% 61.5% 5,288,886
Race/Ethnicity¶ for those 12 years and
older: ≥ 18 years 69.0% 63.6% 4,989,715
• Initiation coverage highest among those ≥ 65 years 89.4% 84.2% 1,486,659
of Non-Hispanic (NH) Asian, Native
Hawaiian or Pacific Islander Race
(56.6%), then NH American Indian
(55.2%), NH White (50.0%), NH Black or
African American Races (40.1%).
• Initiation is at 53.7% for those of Hispanic
ethnicity
• Completion follows the same pattern
• 16.2% data missing or unknown
Source: *CDC COVID Data Tracker > Vaccinations in the US, ¶ MCIR COVID-19 Vaccine Dashboard
National Public Health Other Science
Special Populations Spread Severity
Comparison Response Indicators Roundup• `
Key Messages: Science Round Up
National Dashboards (Updates to CDC COVID Data Tracker)
• Getting vaccinated for COVID-19 reduces the risk of getting COVID-19 illness and helps protect
from severe illness even when COVID-19 illness occurs
• CDC continues to monitor how well the vaccines are working
• Studies show that COVID-19 vaccines reduce the risk of COVID-19, especially severe illness, among people who
are fully vaccinated
• CDC now displays rates of COVID-19 cases or deaths by vaccination status
• These data can be stratified by vaccine product or age group
• In August, unvaccinated individuals had 6.1 times greater risk of testing positive for COVID-19 and 11.3
times greater risk of dying form COVID-19 than for vaccinated individuals
• CDC also displays several figures showing weekly, population-based rates of COVID-19-associated
hospitalizations among people who were fully vaccinated and those unvaccinated
• For all adults aged 18 years and older, the cumulative COVID-19-associated hospitalization rate was about
12-times higher in unvaccinated persons
National Public Health Other Science
Special Populations Spread Severity
Comparison Response Indicators RoundupCOVID-19 National Vaccination Breakthrough Cases, Hospitalizations
`
and Deaths
For all adults aged 18 years and older,
the cumulative COVID-19-associated
hospitalization rate was about 12-
times higher in unvaccinated persons
• These data compare risk of infection, hospitalization, and death for those who are unvaccinated to those fully vaccinated and excludes those partially vaccinated
• Breakthrough cases are those vaccinated persons who had SARS-CoV-2 RNA or antigen detected 14-days after completing their primary vaccine series
• COVID-19-associated deaths occurred among people with documented COVID-19 diagnosis & who died; verified by public health staff reviewing vital records & epi data
• COVID-19-associated hospitalizations are for those 18 and older from the COVIDNET database, a network of 250 acute care hospitals in 14 states, including Michigan
• 16 health departments, including Michigan, currently submit case, death, and immunization data to CDC and represent 30% of total U.S. population
Source: CDC COVID Data Tracker > Rates of Cases and Deaths; CDC COVID Data Tracker > Hospitalizations by Vaccination Status
National Public Health Other Science
Special Populations Spread Severity
Comparison Response Indicators RoundupYou can also read