Historical International Macro-Finance Data Sources - Chenzi ...
←
→
Page content transcription
If your browser does not render page correctly, please read the page content below
Historical International Macro-Finance Data Sources
Stanford Big Data Initiative in International Macro Finance

Chenzi Xu, Stanford
August 2021

                                                              1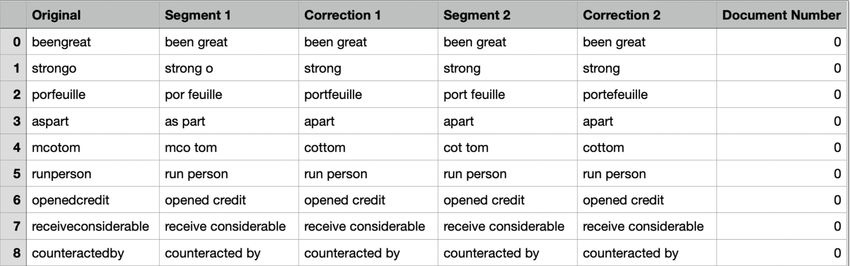
Agenda

   Readily available data
      1. Trade
      2. Capital Flows
      3. Crises, disasters, major events
      4. Macro-data across countries

   Creating your own datasets

   Historical (international) papers

   These slides with active links available on my website: chenzi-xu.com

                                                                           2
Historical perspective
“GOOD DATA”
1850-1914: 1914-1970: 1970-present:
First age of WWI, Interwar, WWII, Second age of
Globalization Bretton Woods Globalization
• First globalization: huge increases in goods & capital integration around the world
• Led by UK on pound sterling/gold standard
• Technologies like steam ships, railroads, telegraph helped to integrate information & real markets
• WWI–Bretton Woods: collapse in international trade & private capital flows
• Transition from £ to $
• Second globalization: broadly very similar to first globalization
• Led by US $ with (mostly) freely floating exchange rates
• ICT revolution, GATT, WTO, regional trade agreements
“Good data” period: 25% of years since First globalization—we have a lot to learn from history!
3Readily available data
Types of data

     1. Trade

                4
1. Trade data overview
A. Bilateral country-level aggregate trade panels: most complete
B. Bilateral country-industry trade panels: a lot of work in progress
C. Other measures:
51A. Country-level bilateral panels
Ultimate sources: government reports, either compiled into Statistical Abstracts (done by the UK,
US, France, etc) or by individual contry. These often contain lots of undigitized, unexplored data (!)
1. TRADHIST database 1827–2014: (link)
• Data structure: contemporary borders/entities, values standardized to nominal £, other country
characteristics such as GDP and bilateral connections like colonial ties
2. RICardo project 1800–1938: (link)
• Data structure: imports and exports; nominal values in different currencies; thousands of geographical
entities (directly copied from publications)
3. Pascali (AER 2017) 1850–1900: (link)
• Data structure: imports and exports; standardized to nominal £; different measures of distance by
transport technology
6Constructing a comprehensive country-level panel
No single source has comprehensive coverage & each source has unique data
• Overlapping source material but often differences in exchange rates chosen, borders, observations
included, other covariates, etc.
• Europe & North America generally well-covered; big differences are in coverage of the ROW
Researcher decisions:
• Country entities/borders:
• Disaggregated entities example: provinces of Australia reported separately
• Aggregated entities example: Norway-Sweden combined
• Conflicts:
• Known issue where often exports from A → B 6= imports in B ← A
• Sources do not always agree, even before standardizing borders
• Constructing data:
• Missing bilateral resistance measures need to be created
• Inverting the imports data to create additional exports data
7Constructing a comprehensive country-level panel
No single source has comprehensive coverage & each source has unique data
• Overlapping source material but often differences in exchange rates chosen, borders, observations
included, other covariates, etc.
• Europe & North America generally well-covered; big differences are in coverage of the ROW
Researcher decisions:
• Country entities/borders:
• Disaggregated entities example: provinces of Australia reported separately
• Aggregated entities example: Norway-Sweden combined
• Conflicts:
• Known issue where often exports from A → B 6= imports in B ← A
• Sources do not always agree, even before standardizing borders
• Constructing data:
• Missing bilateral resistance measures need to be created
• Inverting the imports data to create additional exports data
Xu (2019) deals with these issues for global trade from 1850–1914 at pre-WWI borders (link)
71B. Within-country bilateral panels: industry composition
Various researchers have constructed industry-level bilateral panels of trade by country. There has been
no systematic effort to collect these data for the world.
• Italy 1862–1950 (imports & exports at 4-digit SITC, annual): Bank of Italy (link)
• UK 1700–1899 (exports at 2-digit SITC, annual): Jacks O’Rourke Taylor (2020) (link)
• USA 1866–1914 (imports & exports at 5-digit SITC, annual): work in progress by Xu & Meissner
• Belgium 1870–1910 (manufactured imports & exports at 3-digit SITC, every 5 years): Huberman
Meissner Oosterlinck (2017) (link)
• Germany 1880–1913 (imports & exports at 5-digit SITC, annual): Hungerland Wolf (2021) (link)
• Japan 1880–1910 (exports at 5-digit SITC, every 5 years): Meissner Tang (2018) (link)
Norm is to use SITC revision 2 for better coverage of historical products (link)
81C. Other measures
• Federico-Tena database 1800–1938: (link)
• Data: aggregate country-level trade NOT bilateral
• Unique for: product composition (manufactured vs commodities) for total exports
• Lloyd’s List 1700s–today
• Data: Juhasz (2018) and Xu (2019) digitize parts. Otherwise available as scans of original
newspapers:
• link to scans from 1741–1800s
• link to scans from 1800–1912
• Unique for: daily, within-country trade flows + weather conditions, marine casualties
Major changes in trade costs:
• Sail → Steam: Pascali (2017) estimates sailing times using weather & current patterns; validates
with historical log books
• Canals: historical maritime guides print port-to-port matrices of travel times using routes
including/excluding canals
• Telegraph: Steinwender (2019) & Juhasz Steinwender (2019) provide historical telegraph
connection dates
9Types of data
1. Trade
2. Capital flows
102A. Bonds & equities prices
Main historical international financial centers: London, Paris, New York
All databases from Yale’s International Center for Finance unless otherwise noted
• London 1869–1930: Investor’s Monthly Manual (IMM) monthly records of prices, dividends for
all bonds/stocks (link)
• Source for sovereign & international corporate debt/equity (and domestic UK securities)
• Before 1869: Course of the Exchange (CoE)–similar source to IMM that is not digitized
• Paris 1795–1976: DFIH database from PSE (link)
• Work in progress; data access available by request + some downloadable–much more comprehensive
than IMM (spot, forward, option, repo prices as well)
• New York, 1815–1915: monthly NYSE prices; daily afterward from CRSP (link)
• Shanghai, 1870–1940: annual, abolished afterward (link)
• St. Petersburg, 1865–1914: monthly, abolished afterward (link)
• Amsterdam, 1796–1980: in progress (link)
Non-digitized sources: for higher frequencies, need to return to original sources. Subsets have been
digitized by different scholars but nothing systematic because of the scale
• Scans accessible through Gale newspaper databases; bulk purchases from libraries also possible
and not too expensive
112B. Sovereign & bank debt
Sovereign debt:
• Meyer Reinhart Trebesch (2019) database (link)
• 1815–2016: All foreign-currency bonds traded in London & NY; 91 sovereigns
• Unique for having monthly prices (note: a large subset of price data come from the IMM & tracking
bonds through defaults/restructuring)
• Xu ○
r Indarte (2021): in progress
• 1815–1939: bonds traded in London
• Text-based measures of issuance & default characteristics/severeity from 3 major newspapers
(Economist, FT, London Times)
International banks:
• Kisling Meissner Xu (2021) (link)
• 1850–1914: bank-city-year operations around the world, linked to bank nationality
• Bank size and operations inferred from annual aggregate bank-level balance sheet (1890 onward)
12ROW reliance on banks from advanced economies
(.9,1]
(.8,.9]
(.7,.8]
(.6,.7]
(.5,.6]
(.4,.5]
(.3,.4]
(.2,.3]
(.1,.2]
[0,.1]
No data
Data: Kisling Meissner Xu (2021)
13Types of data
1. Trade
2. Capital flows
3. Crises, disasters, major events
143. Major events are rare and only history provides data
Financial crises: varying definitions of crises leads to different dates
• Reinhart Rogoff: Banking, sovereign debt, and currency crises, 1800-2008, all countries (link)
• MACROHISTORY database: systemic financial crises, 1870–2017, 18 advanced economies (link)
• Bordo Eichengreen Klingebiel Martinez-Peria (2001): banking and crises, 1880–1997, 21 countries
• Bordo Meissner (2006) adds 9 EM countries to pre-1914 period + debt crises (link)
• Many papers study particular crises:
• US crises: Kelly Grada (2000) for 1857; Benmelech Bordo (2007) for 1873; Carlson (2005) for 1893;
Frydman Hilt (2015) for 1907
• UK crises: Xu (2019) for 1866; Paolera Taylor (2001) for 1890
• Latin American crises: Kaminsky Vega-Garcia (2014)
Wars and military conflicts:
• Correlates of War (COW) project: (link)
• Formal alliances, territorial changes, land borders (useful for bilateral trade), colonial dependencies,
intergovernmental organizations
• Bilateral trade (1870–2014) subsumed by previously mentioned datasets
15Types of data
1. Trade
2. Capital flows
3. Crises, disasters, major events
4. Macro-data across countries
164. List of resources
• Maddison Project Database: (link)
• More detailed national accounts (industry-level): (link)
• Global Financial Database: financial indicators (market cap, market rates, central bank indicators)
• Pre-WWI variables much more limited and mostly for UK, France, Germany, US (big overlap with
availability on NBER)
• Indices often constructed from a few stocks, not the market
• MACROHISTORY database: 1870 onwards, 18 advanced economies (link)
• Housing, equities, other macro measurements
• Central bank websites: Bank of England/Italy/France/FRED
• Often have the best/most detailed historical series for that country
• Example: Bank of England’s “Millennium of macrodata” (link)
• Center for Financial Stability (link)
• Annual data series covers many countries, but better for unusual series rather than a panel
17Creating your own datasets
Types of historical data & sources

    Types of data:

      • Quantitative
      • Text/narrative

    Ultimate sources:

      • Archives & libraries
      • Digitial respositores: Hathitrust, google books, library databases
      • Huge volumes of untapped historical textual data: newspapers, government reports, declassified
        files, etc.

                                                                                                         18
Examples of ultimate sources
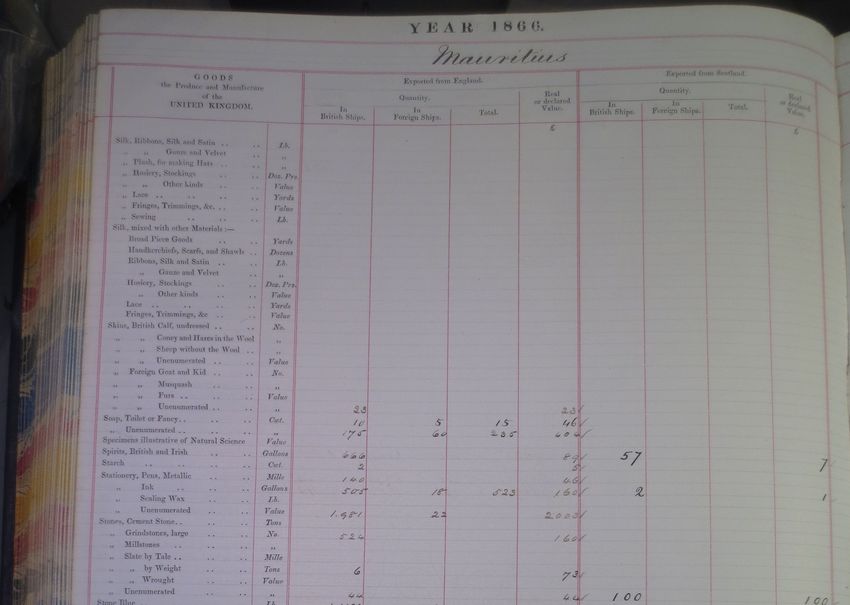
Archival source: CUST 8 ledgers for the United Kingdom are the source for bilateral-industry
imports/exports
National Archives documentation: (link)
19Examples of ultimate sources
Archival source: CUST 8 ledgers for the United Kingdom are the source for bilateral-industry
imports/exports
National Archives documentation: (link)
19Examples of ultimate sources
Best references for sources (as a starting point) are in the documentation of existing databases. Many
have been digitized and are on Hathitrust
Below: Statistical Abstract for the several colonial and other possessions of the UK, 1864–1883 ; (link)
20Processing
Quantitative data:
• Manual digitization (outsource outsource outsource! lots of firms)
• Create a template → check the sample output!
• Consider double-entry for handwriting or low quality
• Figure out the necessary data precision beforehand
• OCR is improving significantly, but table structure can make this untenable
• pytesseract and layout parser are tools to explore
Text data:
• OCR: manual digitization not feasible + textual data errors are observable
• Post-OCR processing
21Post-OCR processing
The problem:
• Most OCR’d text of historical sources have significant noise
• Need 80%+ accuracy for topic models & language models (van Strien et al 2020)
• Luckily, most issues are with segmentation and misspelling
The steps:
1. Find a relevant corpus (Google Web Trillion Word Corpus, or custom ones for the historical period)
2. Segmentation: wordsegment
3. Spelling correction: Norvig algorithm
4. Fix incorrectly segmented words: symspell
More detail about these steps in the appendix of these slides
22Historical (international) papers
Papers written by PhD students

     • Hanlon (2015), ”Necessity is the mother of invention: Input supplies and directed technological
       change” (Econometrica)
     • Koudijs (2016): ”The boats that did not sail: Asset price volatility in a natural experiment” (JF)
     • Juhasz (2018), ”Temporary protection and technology adoption: Evidence from the Napoleonic
       Blockade” (AER)
     • Steinwender (2018), ”Real effects of information frictions: When the States and the Kingdom
       became United” (AER)
     • Xu, G (2018), ”The costs of patronage: Evidence from the British Empire” (AER)
     • Giorcelli (2019), ”The long-term effects of management and technology transfers” (AER)
     • Xu, C (2019): ”Reshaping global trade: The immediate & long-run effects of bank failures” (R&R
       QJE)
     • Van Patten & Mendez-Chacon (2021) ”Multinationals, monopsony, and local development:
       Evidence from the United Fruit Company” (R&R Econometrica)
     • Indarte (2019): ”Bad news bankers: Underwriter reputation & contagion in pre-1914 sovereign
       debt markets”
     • Olmstead-Rumsey (2019) ”Country banks and the Panic of 1825”
                                                                                                            23
Questions/comments welcome!
chenzixu@stanford.edu
24APPENDIX
25Steps
0. Clean with regular expressions
1. Segment words
2. Correct words
3. Further refine spelling
4. Append words that should not be split
26Step 0: Regular Expressions
• Should there be known consistent errors in the text, these can be easily dealt with in the
pre-processing phase via regular expressions
27Step 1: Word Segmentation
• Segment using wordsegment Python package (Segaran and Hammerbacher, 2009)
P(W1:n ) = Πk=1:n P(Wk )
• If the product is higher than any other candidate c’s product, that is the best answer, which
satisfies:
best = arg maxc∈candidates P(c)
• Default Corpus: Google Web Trillion Word Corpus.
• Other corpuses can also be used to improve the quality of segmentation (i.e. Hansard Corpus)
28Step 2: Word Correction
• Norvig Algorithm
P(w |c)P(c)
arg maxc P(c|w ) = arg maxc
P(w )
= arg maxc P(w |c)P(c)
• Uses Levenshtein Distance to find permutations of edit distance n from the original word
• i.e. n = 3
• Compares permutation to words in a word frequency list.
• Words that are found more often in the frequency list are more likely the correct results.
• Corpus examples:
• Word2Vec model from Hosseini et al. (2021)
• Hansard Corpus
29Step 3: Further refine corrections
• Depending on the necessity, we further refined words detected initially incorrect and refine them
with continued iterations of Step 0, 1 and 2 until a steady state is achieved.
30Step 4: Append missplit words
• symspell algorithm (Garbe, 2018)
• symspell only requires deletes, no transposes, replacements, inserts, etc – reducing the complexity of
edit candidate generation and dictionary lookup
• Levenshtein distance (i.e. of 2)
• Properly segments text as well.
• Default (bigram) dictionary is sourced from Google Books Ngram data and SCOWL.
• User-generated corpuses are also fine
31Examples
32You can also read