MI COVID response Data and modeling update - January 11, 2022 - State of ...

Page created by Nathan Watkins
 
CONTINUE READING
MI COVID response Data and modeling update - January 11, 2022 - State of ...
MI COVID response
Data and modeling update
January 11, 2022
MI COVID response Data and modeling update - January 11, 2022 - State of ...
Executive Summary
Current statistics and where we may be going
In 2021, more than 1 in 10 Michiganders were reported with COVID-19, and approximately 1 in 650 Michiganders died from COVID-19
Exponential growth and the highest case numbers of entire pandemic: 20–29-year-olds currently have the highest case rate of any age group
Omicron reported in 41 counties in Michigan; Models project cases & hospitalizations to peak by the end of Jan 2022 (latest end of Feb)

Preventing Death and Severe Outcomes
•   Deaths rates have decreased over the last week for all age groups
•   Cases in long term care facilities are increasing, crucial to get LTC residents and staff up to date on vaccination
•   More than 200 Children have had Multiple Inflammatory Syndrome; Pediatric vaccination reduces risk of MIS-C

Protect Health Care Capacity
•   COVID+ census in hospitals has set another pandemic record; Pediatric COVID+ census down slightly from last week’s record high
•   More hospitals in Michigan are reporting critical staff shortages than ever reported during the pandemic (n=59)
•   Federal support teams and changes in healthcare work force guidance

Keep Vital Infrastructure Functioning
 Community transmission is impacting schools; Changes in School Guidance for Isolation and Quarantine
 Vaccination, Masking, Testing and Therapeutics are critical tools in our fight against the impact of COVID-19
MI COVID response Data and modeling update - January 11, 2022 - State of ...
Year in Review – Pandemic in Numbers
       Data 1/1/2021 through 12/31/2021 (as of 1/10)

       • Approximately 1 in every 10 Michiganders (1.1) were reported with COVID-19 in 2021
         • More than 1 in every 10 people aged 30-39 (1.5) reported COVID-19 infection in 2021 which was the
           highest of any age group
         • 5.1 times more children 0-9 were reported with COVID-19 in 2021 compared to 2020, the highest
           relative increase of any age group
         • Enough cases in 2021 to fill the Big House 9 times

       • In 2021, nearly 1 in every 100 Michiganders (0.9) had been admitted to the hospital with COVID-19
         positive test

       • More than 1 in every 650 Michiganders died from COVID-19 in 2021
         • 4.5 times more children 0-19 died from COVID-19 in 2021 compared to 2020, the highest relative
           increase of any age group
         • More than 1 in every 100 Michiganders over 80 years old (1.2) died from COVID-19 in 2021
Source: Michigan Disease Surveillance System (MDSS); these number include confirmed and probable

                                                        Prevent Death and Severe                                                 Keep Vital Infrastructure
  Current Trends and Projections                                                                   Protect Healthcare Capacity
                                                               Outcomes                                                                Functioning
MI COVID response Data and modeling update - January 11, 2022 - State of ...
Global and National Trends
                                                                                                                              New cases of COVID-19, reported to CDC in Region 5,
                                                                                                                              Michigan, and the United States
                                                                                                                              7-day moving average of new case per 100,000
                                                                                                                            250

                                                                                                                            200

                                                                                                                            150

                                                                                                                            100

                                                                                                                              50

                                                                                                                               0
                                                                                                                                   7/1             8/1              9/1             10/1       11/1          12/1     1/1
                                                                                                                                                    Michigan              Region 5 (Midwest)          United States

   Globally, 307,450,630 cases and 5,490,360 deaths (Data* through 1/10)
   •    Globally, the highest number of cases ever reported on a single day on 1/10 (3.26 million); & cases in many countries are increasing exponentially with Omicron variant
   United States: 1.4% of Americans have been infected with COVID-19 in last week¶
   •    The U.S. is at High transmission level (1,409.5 cases/100,000 in last 7 days) (666.9 cases/100,000 week prior)
   Midwest states are increasing exponentially
   •    Illinois and Michigan have the highest case rates in Midwest; New York City and Rhode Island have highest case rates in U.S.
Source: * Johns Hopkins Coronavirus Resource Center; ¶ CDC COVID Data Tracker Weekly Review; † CDC COVID Data Tracker – CDC recently updated their methodology for reporting case rates

                                                                    Prevent Death and Severe                                                                                               Keep Vital Infrastructure
  Current Trends and Projections                                                                                              Protect Healthcare Capacity
                                                                           Outcomes                                                                                                              Functioning
MI COVID response Data and modeling update - January 11, 2022 - State of ...
Cases         2020        2021               Omicron (B.1.1.529) Wave
 Year-over-year                               Alpha (B.1.1.7) wave
 comparisons:
                                                                      Delta (B.1.617.2) wave
 cases and
 hospitalizations                                                                                2020 Holiday wave
 are higher than                            First wave

 last year                          Hospitalizations                     2020      2021        Omicron

                                                    Alpha
 • Cases are showing a                                                                Delta
   sharp increase
                                                                                                         2020 Holiday
   compared to last year                                                                                 wave
 • Hospitalizations are
   higher than last year            Deaths                               2020      2021
                                                 First wave
 • Deaths are currently
   similar to last year                                                                    Delta

                                                              Alpha                                  2020 Holiday
                                                                                                     wave

Source: MDSS and EM Resource data
MI COVID response Data and modeling update - January 11, 2022 - State of ...
Cases, hospitalizations and deaths change together—but lagged by up to 3
  weeks
  • Because deaths lag cases, we will not be able to tell whether deaths will follow the case trends for another
    couple of weeks
  • Hospitalizations appear to be following case trends thus far but may be clearer in a week

                  Cases per million
                  1.5x Hospitalizations per million – shifted 2 weeks
                  50x Deaths per million – shifted 3 weeks

Source: MDSS and EM Resource data

                                         Prevent Death and Severe                                     Keep Vital Infrastructure
  Current Trends and Projections                                        Protect Healthcare Capacity
                                                Outcomes                                                    Functioning
MI COVID response Data and modeling update - January 11, 2022 - State of ...
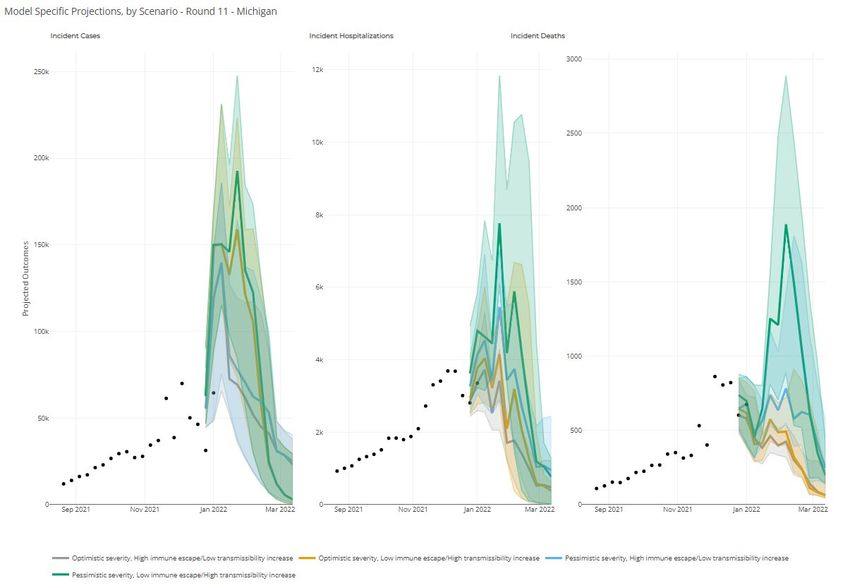
Case Rate Trends by Age Group
  Daily new confirmed and probable cases per million by age group (7-day rolling average)
     2500                    0-9                 30-39              60-69                                        2500
                             10-19               40-49              70-79
                                                                                                                                                                    20-29
                             20-29               50-59              80+
     2000                                                                                                        2000                                               30-39

                                                                                                                                                                     40-49

     1500                                                                                                        1500                                                10-19

     1000                                                                                                        1000

      500                                                                                                         500

          0                                                                                                         0
              3/1    5/1       7/1      9/1     11/1      1/1      3/1      5/1         7/1   9/1   11/1   1/1          7/1   8/1     9/1       10/1     11/1     12/1       1/1

 •      Case rate trends for most age groups saw exponential increases over the past week and are expected to increase
 •      Case rates by onset date for all age groups are between 586 and 2,082 cases per million (through 1/3)
 •      Case counts and case rates are highest for 20-29-year-olds this week
     Note: Case information sourced from MDHHS and reflects date of onset of symptoms
     Source: MDHHS – Michigan Disease Surveillance System

                                                                 Prevent Death and Severe                                                              Keep Vital Infrastructure
Current Trends and Projections                                                                                    Protect Healthcare Capacity                                      7
                                                                        Outcomes                                                                             Functioning
MI COVID response Data and modeling update - January 11, 2022 - State of ...
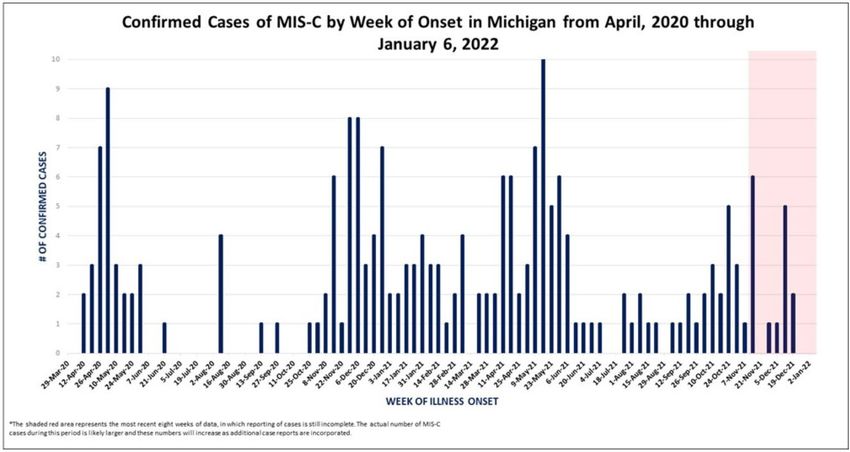
Case Rates by Reported Racial and Ethnic Group
         Daily new confirmed and probable cases per million                                                       Daily new confirmed and probable cases per
         (7 day rolling average) by race category                                                                 million (7 day rolling average) by ethnicity category
                       American Indian/Alaska Native                     Black/African American                                 Hispanic or Latino         Not Hispanic or Latino
           1500                                                                                                    1500
                       Asian/Pacific Islander                            White
                          Race                      Case Rate                                                                                          Race               Case Rate

           1200           American Indian/          771.2                                                          1200                                Hispanic/Latino    917.6
                          Alaskan Native                                                                                                               Non-Hispanic       754.9
                          Asian/Pacific Islander    725.6
             900          Black/African American    1,377.3                                                         900
                          White                     682.2

             600                                                                                                    600

             300                                                                                                    300

                0                                                                                                     0
                    7/1            8/1             9/1          10/1          11/1           12/1          1/1            7/1         8/1        9/1           10/1         11/1      12/1    1/1

   Updates since last week:
   •    Cases per million are exponentially increasing for all reported racial and ethnic groups and are highest for Blacks/African Americans
   •    The high number of cases with missing race/ethnicity data, and those multiracial or other are also impacting the case rates shown here
   •    In the past 30 days, 30% (↔) of race data and 41% (↑1%) ethnicity data was either missing or reported as unknown
   Note: Case information sourced from MDHHS and reflects date of death of confirmed and probable cases.
   Source: MDHHS – Michigan Disease Surveillance System

                                                                Prevent Death and Severe                                                                                 Keep Vital Infrastructure
Current Trends and Projections                                                                                   Protect Healthcare Capacity                                                         8
                                                                       Outcomes                                                                                                Functioning
MI COVID response Data and modeling update - January 11, 2022 - State of ...
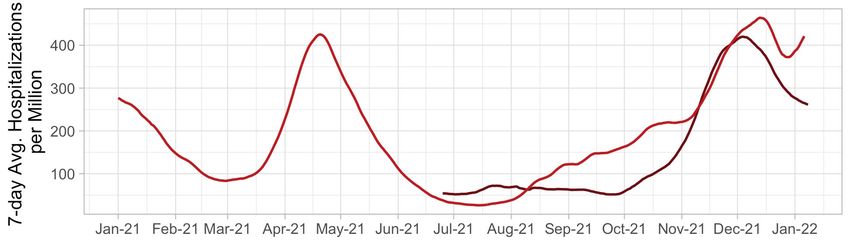
Identified COVID-19 Cases Caused by Variants of Concern (VOC) in
  US and Michigan
      SARS-CoV-2 Variants Circulating in the Variants of Concern in Michigan, Jan 10
      United States, Dec 4 – Jan 8 (NOWCAST)

                                                                                                                                                                    •     CDC reclassifies variants as
                                                                                                                                                                          epidemiology shifts
                                                                                                                                                                    •     Variants are downgraded when
                                                                                                                                                                          there has been a significant and
                                                                                                                                                                          sustained reduction in
                                                                                          Currently, CDC is reporting                                                     prevalence, or variant no longer
                                                                                          rapid increase in prevalence                                                    poses significant risk to public
                                                                                          of B.1.1.529 (i.e., Omicron)                                                    health
                                                                                          over past 6 weeks                                                         •     Cumulative numbers of Delta
                                                                                                                                                                          are no longer included in county
                                                                                                                                                                          counts; solely counts of Omicron
                                                                                                                                                                          cases are listed here

                                                                                                                                                               88 Omicron cases in Wayne County attributed to Detroit City

                                                                                                                  Variant               MI Reported Cases   # of Counties      MDHHS VOC Sequenced Prev. ¶
                                                                                                                  B.1.617.2 (delta)           30,295              83                          30.3%
Data last updated Jan 10, 2022
Source: MDSS                                                                                                      B.1.1.529 (omicron)           617               41                          69.7%
¶ Sequence specimens are from the most recent week by onset date which may change as more specimens are sent in

                                                                    Prevent Death and Severe                                                                            Keep Vital Infrastructure
   Current Trends and Projections                                                                                           Protect Healthcare Capacity
                                                                           Outcomes                                                                                           Functioning
MI COVID response Data and modeling update - January 11, 2022 - State of ...
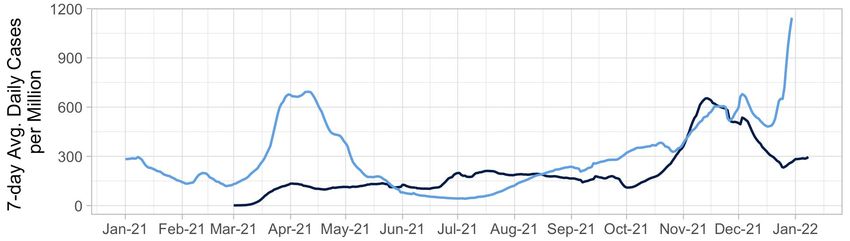
Where are we headed: models project further increases in cases,
   hospitalizations, and deaths for Michigan
   The omicron surge is expected to hit
   us sharp and fast                                           Cases                               Hospitalizations                 Deaths

   •     Models project cases &                                                                                                                         Pessimistic
         hospitalizations to peak by the
         end of Jan 2022 (latest end of
         Feb) in every state
   •     The projected peaks represent
         the highest cases,                                          Current
         hospitalizations, and deaths thus                        weekly case
         far over the entire pandemic                                  levels

   •     The number of hospitalizations at
         the peak could put further strain
         on an already stressed healthcare
         system
   •     Actions taken swiftly and in the                                                                                                               Optimistic
         short term could prevent health
         system from becoming further                           Sep 2021 Nov 2021 Jan 2021 Mar 2021 Sep 2021 Nov 2021 Jan 2021 Mar 2021 Sep 2021 Nov 2021 Jan 2021 Mar 2021
         overwhelmed
Source: COVID Modeling Scenario Hub. Uncertainty levels: 50%
                                                   Prevent Death and Severe                                                         Keep Vital Infrastructure
  Current Trends and Projections                                                        Protect Healthcare Capacity
                                                          Outcomes                                                                        Functioning
Average and total new deaths, by age group
   Daily COVID-19 deaths in confirmed and probable cases per million by age group (7 day rolling average)

      200                                                                                                                                            0-19           40-49           70-79
                                                                                                                                                     20-29          50-59           80+
                                                                                                                                                     30-39          60-69           Total

      150

      100

      50

        0
            3/1     4/1       5/1       6/1       7/1       8/1       9/1      10/1      11/1     12/1     1/1   2/1   3/1   4/1   5/1   6/1   7/1   8/1     9/1   10/1     11/1   12/1     1/1

  •     Deaths are a lagging indicator
  •     Through 1/3, the 7-day avg. death rate is 40 daily deaths per million people for those over the age of 80
  •     Deaths rates have decreased over the last week for all age groups
  Note: Death information sourced from MDHHS and reflects date of death of confirmed and probable cases.
  Source: MDHHS – Michigan Disease Surveillance System (MDSS)

                                                                Prevent Death and Severe                                                                     Keep Vital Infrastructure
Current Trends and Projections                                                                                     Protect Healthcare Capacity                                         11
                                                                       Outcomes                                                                                    Functioning
30-day rolling average daily deaths per million people by race and
   ethnicity
           Average daily deaths per million people by race                                                         Average daily deaths per million people by
                    American Indian/Alaska Native                     Black/African American                       ethnicity
                    Asian/Pacific Islander                            White
              15                                                                                                    15         Hispanic or Latino   Not Hispanic or Latino

              12                                                                                                    12

               9                                                                                                     9

               6                                                                                                     6

               3                                                                                                     3

               0                                                                                                     0
                   7/1           8/1             9/1           10/1           11/1           12/1           1/1          7/1      8/1       9/1     10/1     11/1       12/1   1/1

   •     Deaths are lagging indicator of other metrics
   •     Trends for daily average deaths are decreasing for all reported races and ethnicities
   •     Currently, American Indian/Alaskan Native have the highest death rate (9.4 deaths/million)

   Note: Death information sourced from MDHHS and reflects date of death of confirmed and probable cases.
   Source: MDHHS – Michigan Disease Surveillance System

                                                                Prevent Death and Severe                                                                      Keep Vital Infrastructure
Current Trends and Projections                                                                                    Protect Healthcare Capacity                                           12
                                                                       Outcomes                                                                                     Functioning
Reported Outbreaks within Long Term Care Facilities: Adult Foster Care,
      Homes for the Aged, and Skilled Nursing Cases
                                      Number of AFC/HFAs with 3 or more Confirmed                                                                 Number of SNFs with 3 or more Confirmed Cases
                                                        Cases                                                                          80
                              70
                                                                                                                                       70
                              60
                                                                                                                                       60

                                                                                                                Number of Facilities
                              50
       Number of Facilities

                                                                                                                                       50
                              40
                                                                                                                                       40
                              30
                                                                                                                                       30
                              20
                                                                                                                                       20

                              10                                                                                                       10

                              0                                                                                                        0
                                   3/24   4/24   5/24   6/24   7/24    8/24   9/24   10/24 11/24 12/24                                     3/26   4/26   5/26   6/26   7/26   8/26   9/26 10/26 11/26 12/26

  •      The number of Long-Term Care Facilities reporting 3 or more cases within a single reporting period increased in both AFC/HFA (42, up from
         20 last week) and SNF (71, up from 31 last week) in most recent data

COVID-19 outbreaks within Long-Term Care Facilities are defined as three or more cases with an epidemiological linkage by place and time indicating a shared exposure outside of a household
(https://www.michigan.gov/coronavirus/0,9753,7-406-98163_98173_102057---,00.html and https://www.michigan.gov/coronavirus/0,9753,7-406-98163_98173-526911--,00.html)

The data is from w eekly reporting by facilities w ith bed occupancy of at least 13 beds.

                                                                      Prevent Death and Severe                                                                                   Keep Vital Infrastructure
Current Trends and Projections                                                                                   Protect Healthcare Capacity                                                               13
                                                                             Outcomes                                                                                                  Functioning
Reported Cases within Long Term Care Facilities: Adult Foster Care, Homes
 for the Aged, and Skilled Nursing Cases for Residents and Staff
                                  STATE OF MICHIGAN WEEKLY TOTAL CONFIRMED COVID-19 CASES IN                                             STATE OF MICHIGAN WEEKLY TOTAL CONFIRMED COVID-19 CASES IN
                                                  AFC/HFA RESIDENTS AND STAFF                                                                              SNF RESIDENTS AND STAFF
                                                    03/24/2021 TO 01/05/2022                                                                               03/26/2021 TO 01/07/2022
                    1800                                                                                                              1800

                    1600                                                                                                              1600

                    1400                                                                                                              1400

                                                                                                                    Number of Cases
  Number of Cases

                    1200                                                                                                              1200

                    1000                                                                                                              1000

                     800                                                                                                               800

                     600                                                                                                               600

                     400                                                                                                               400

                     200                                                                                                               200

                       0                                                                                                                 0
                           3/24      4/24     5/24     6/24     7/24      8/24       9/24    10/24 11/24 12/24                               3/26     4/26     5/26     6/26     7/26       8/26    9/26    10/26 11/26 12/26
                                  Weekly Total Confirmed Cases Resident          Weekly Total Confirm Cases Staff                                   Weekly Total Confirmed Cases Resident      Weekly Total Confirm Cases Staff

 •                  Case counts in residents and staff are increasing and have peaked to an annual high of 1,730 cases in SNF staff (971 last week) and 954 cases
                    in AFC/HFA staff (471 last week)
 •                  Case counts in LTCF continue record more cases among staff than residents
The data is from w eekly reporting by facilities w ith bed occupancy of at least 13 beds.

                                                                          Prevent Death and Severe                                                                                           Keep Vital Infrastructure
Current Trends and Projections                                                                                                Protect Healthcare Capacity                                                              14
                                                                                 Outcomes                                                                                                          Functioning
Reported Staff Shortages within Skilled Nursing Facilities
                                             100%

                                             90%
        % SNFs reporting staffing shortage

                                             80%

                                             70%

                                             60%

                                             50%

                                             40%

                                             30%

                                             20%

                                             10%

                                              0%
                                                    11/1   12/1   1/1   2/1   3/1     4/1      5/1    6/1     7/1    8/1     9/1      10/1   11/1     12/1     1/1
                                                                                               AIDE   NURSE

•    More Skilled Nursing Facilities (SNF) in Michigan are reporting staff shortages now than ever previously reported during the pandemic
•    40% of SNF report staffing shortages for aides
•    38% of SNF report staffing shortages for nurses
These data are from w eekly reporting by facilities w ith bed occupancy of at least 13 beds.

                                                                        Prevent Death and Severe                                             Keep Vital Infrastructure
Current Trends and Projections                                                                          Protect Healthcare Capacity                                    15
                                                                               Outcomes                                                            Functioning
Completed vaccination among Skilled Nursing Cases for Residents and Staff
    85.6% of SNF residents are fully vaccinated; 40 of 53           69.5% of SNF staff are fully vaccinated, 49 of 53 states/territories
    states/territories                                                   7.5% on SNF staff have initiated primary series

https://data.cms.gov/covid-19/covid-19-nursing-home-data
https://www.cdc.gov/nhsn/covid19/ltc-vaccination-dashboard.html
                                         Prevent Death and Severe                                         Keep Vital Infrastructure
  Current Trends and Projections                                      Protect Healthcare Capacity
                                                Outcomes                                                        Functioning
Multisystem Inflammatory Syndrome in Children (MIS-C) is Increasing
     Michigan Surveillance
          •    Higher community transmissions is followed by
               higher incidence of MIS-C cases

          •    208 cases identified in Michigan

          •    More than 60% of those children are elementary
               and pre-school aged

          •    Black/African American children are
               disproportionately impacted

          •    70.7% children with MIS-C are treated in the ICU

          •    Vaccines have been shown to
               prevent MIS-C, including MIS-C
               that results in ICU admission1,2
Sources: MDHHS and MIS-C Data and Reporting; Data through 1/6; 1. Levy et al. Multisystem Inflammatory Syndrome in Children by COVID-19 Vaccination Status of Adolescents in France 2021 JAMA doi:10.1001/jama.2021.23262; 2. Zambrano et al.
Effectiveness of BNT162b2 (Pfizer-BioNTech) mRNA Vaccination Against Multisystem Inflammatory Syndrome in Children Among Persons Aged 12–18 Years — United States, July–December 2021. MMWR Morb Mortal Wkly Rep. ePub: 7 January 2022. DOI:
http://dx.doi.org/10.15585/mmwr.mm7102e1

                                                                  Prevent Death and Severe                                                                                                Keep Vital Infrastructure
  Current Trends and Projections                                                                                            Protect Healthcare Capacity                                                             17
                                                                         Outcomes                                                                                                               Functioning
Vaccinations and Boosters
   •   Nearly 14.3 million COVID-19 vaccine doses have been administered in Michigan
        •   Over 6.4 million Michiganders have received at least one dose (64.1%)
        •   Over 5.7 million Michiganders have completed a primary series (57.3%)
        •   Over 2.5 million additional/booster doses have been administered in Michigan
              •   44.6% of the fully vaccinated population has received a booster
              •   69.3% of the fully vaccinated population 65 years of age or older has received a booster

                                                                                    Initiation and Completion Trends in
                                                                                                  5–11-year-olds

https://covid.cdc.gov/covid-data-tracker/#vaccinations
https://www.michigan.gov/coronavirus/0,9753,7-406-98178_103214_103272-547150--,00.html
                                    Prevent Death and Severe                                            Keep Vital Infrastructure
Current Trends and Projections                                      Protect Healthcare Capacity                                   18
                                           Outcomes                                                           Functioning
Average Hospital Admissions Are Increasing for all Age Groups

  •   Trends for daily average hospital admissions have increased 20% since last week (vs. 5% decrease prior week)
  •   Overall, many age groups saw increases this week following the holiday
  •   More than 70 daily hospital admissions was seen for each of the age groups of 50-59, 60-69, 70-79, and 80+
  Source: CHECC & EM Resource

                                   Prevent Death and Severe                                         Keep Vital Infrastructure
Current Trends and Projections                                     Protect Healthcare Capacity                                19
                                          Outcomes                                                        Functioning
Hospital Admissions and Admission Rates by Age Group
  Daily new hospital admission per million by age group (7 -day rolling average)
        Age                  Average† daily                          Average† Daily                        One Week              •   Through Jan 10, there were an average of 562.4
       Group               number of hospital                          Hospital                          % Change (Δ #)              hospital admissions per day due to COVID-19; an
                              admissions                            Admission Rate*                                                  increase from last week (+16%, +76)
    0-11                                 18.0                                   12.9                               -2% (-
Statewide Hospitalization Trends: Total COVID+ Census
         Hospitalization Trends 3/1/2021 – 1/10/2022          The COVID+ census in hospitals has
     Confirmed Positive & Persons Under Investigation (PUI)   increased by 16% over the past week and
                                                              has set another pandemic record.
                                                      4556

                  Confirmed Positive

                                                                   Hospitalized COVID Positive Long Term
                                                                      Trend (beginning March 2020)

            PUI

                                                                                                           21
Statewide Hospitalization Trends: Regional COVID+ Census
      Hospitalization Trends 7/1/2021 – 1/10/2022   The COVID+ hospital census has increased in all
              Confirmed Positive by Region          regions since last week. The fastest growth was
                                                    seen in Regions 2N, 3 and 7.
               Region 1
               Region 2N                            Regions 2N and 2S now have greater than 600
               Region 2S                            COVID+ patients hospitalized per Million
               Region 3
               Region 5                             Population.
               Region 6
               Region 7                                 Region   COVID+ Hospitalizations       COVID+
               Region 8                                           (% Δ from last week)     Hospitalizations /
                                                                                                 MM
                                                    Region 1            354 (17%)                327/M
                                                    Region 2N          1391 (26%)                628/M
                                                    Region 2S           1364 (3%)                612/M
                                                    Region 3            514 (22%)                453/M
                                                    Region 5            328 (16%)                344/M
                                                    Region 6            532 (11%)                363/M
                                                    Region 7            117 (22%)                234/M
                                                    Region 8            75 (15%)                 241/M

                                                                                                         22
Statewide Hospitalization Trends: ICU COVID+ Census
                                                    The census of COVID+ patients in ICUs has increased
      Hospitalization Trends 3/1/2021 – 1/10/2022   7% from last week. Census in ICUs has increased in
                Confirmed Positive in ICUs          all regions except for Regions 3 and 6.

                                                    Regions 1, 2S, and 3 have ICU occupancy greater
                                                    than 85%. All regions except for Regions 5 and 8
                                                    have 30% or more ICU beds filled with COVID+
                                                    patients.
                                                       Region   Adult COVID+ in   Adult ICU   % of Adult ICU
                                                                 ICU (% Δ from    Occupancy   beds COVID+
                                                                   last week)
                                                    Region 1        76 (12%)         86%           37%
                                                    Region 2N      174 (16%)         79%           31%
                                                    Region 2S       234 (5%)         87%           34%

     Confirmed                                      Region 3       111 (-5%)         93%           34%
     Positive in ICU                                Region 5        48 (17%)         78%           28%
                                                    Region 6        128 (0%)         81%           43%
                                                    Region 7        45 (36%)         81%           34%
                                                    Region 8        17 (6%)          76%           27%

                                                                                                         23
Statewide Hospitalization Trends: Pediatric COVID+ Census
     Hospitalization Trends 1/1/2021 – 1/10/2022   Pediatric COVID+ Hospital census remains high
        Pediatric Hospitalizations, Confirmed      although it is down slightly from last week’s record
                                                   high.

                                                               Pediatric Hospitalizations by Region
                                                                       (Nov 2021-Jan 2022)

                                                                                                      24
Hospital, ICU, Ventilator Utilization, and Staffing Trends

                      Available hospital beds      A                                                                                       C
                                                                Available ICU beds              A

                      Occupied hospital beds                   Occupied ICU beds

                                                  B

   •      Utilization for hospitals, ICUs, and mechanical ventilators are all increasing (Ventilators not shown)
   •      The number of available hospital and ICU beds is decreasing (shown in A)
             •        Compared to this time last year, we currently have 1,091 less staffed beds this year (5% decrease)
             •        Compared to this time last year, we currently have 151 fewer ICU staffed beds this year (6% decrease)
   •      At the start of the current Omicron surge, we have already peaked for COVID hospitalizations (shown in B) and near peak
          for ICU; these numbers are expected to rise
   •      Sufficient staffing remains the most critically limited resource within healthcare, and is at a pandemic high (shown at C)
Source: EM Resource

                                                Prevent Death and Severe                                       Keep Vital Infrastructure
   Current Trends and Projections                                              Protect Healthcare Capacity
                                                       Outcomes                                                      Functioning
Michigan Strategy to Allocate Federal Staffing Resources
       The regional strategy addresses:
                                                                        •   North Central has seen an elevated level of COVID
        COVID hotspots                                                     cases and hospitalizations.
        Challenges with increased admissions                                 •   DoD team allocated to Covenant Saginaw in R3
        Facilitating regional decompression and patient transfers            •   Current request for Sparrow Hospital would
                                                                                  support a second facility in R1
                                                                              •   Both facilities provide for regional
                                                                                  decompression allowing for transfers of
                                                                                  patients from outlying areas to the appropriate
                                                                                  level of care.

  •   The West side of the state saw the                                            •   SE Michigan increased hospitalizations in the
      highest initial COVID burden in the                                               current surge and is now experiencing the highest
      current surge.                                                                    number of cases and positivity in the state.
        •   DoD teams allocated to Spectrum                                               •   DoD team allocated to Beaumont Dearborn
            and Mercy Muskegon in R6                                                          in R2S
                                                                                    •   Disaster Medical Assistance Team (DMAT) assigned
                                                                                        to Henry Ford – Wyandotte in R2S
Source: Emergency Preparedness and Response

                                            Prevent Death and Severe                                       Keep Vital Infrastructure
  Current Trends and Projections                                       Protect Healthcare Capacity                                   26
                                                   Outcomes                                                      Functioning
CDC Work Restrictions for Healthcare Providers
       Exposed to or Infected with COVID-19

https://www.cdc.gov/coronavirus/2019-ncov/hcp/guidance-risk-assesment-hcp.html
                                 Prevent Death and Severe                                  Keep Vital Infrastructure
Current Trends and Projections                               Protect Healthcare Capacity
                                        Outcomes                                                 Functioning
Vital Infrastructure: K-12 school clusters and outbreaks, week ending Jan 6
   Number of reported outbreaks/clusters decreased since last week (365 to 211), with decreases in Pre K-Elementary (195 to 114), and High
   Schools (102 to 64), and Middle/Jr High (68 to 33). Administration (0 to 0) remained the same.
                                                                                                        Number of            Range of cases
   Region          Number of reported cases, #                         # Ongoing - Excluding New # New  outbreaks            per outbreak
     Region 1                                 545   6                                                                                                                                                 29                               3-82
     Region 2n                       333       11                                                                                                                                                     23                               3-54
     Region 2s                  175       8                                                                                                                                                           32                               3-17
     Region 3                                                                             2,318      5                                                                                                82                              3-100
     Region 5                  56     0                                                                                                                                                               12                                3-9
     Region 6                  125        9                                                                                                                                                           16                               3-54
     Region 7                   159       0                                                                                                                                                             7                              3-52
     Region 8                  140        0                                                                                                                                                           10                               3-37
     Total                                                                        3,851                                                         39                                                  211                               3-100

                                                                                                                                                                                            Number of                            Range of cases
   Grade level                   Number of reported cases, #                                                                # Ongoing - Excluding New                # New                  outbreaks                            per outbreak
   Pre-school - elem.                               1,459                    22                                                                                                                      114                               3-62
   Jr. high/middle school                     792          0                                                                                                                                          33                               3-82
   High school                                          1,600                     17                                                                                                                  64                              3-100
   Administrative                00                                                                                                                                                                    0                                 4
   Total                                                                               3,851                                                     39                                                  211                              3-100
   Many factors, including the lack of ability to conduct effective contact tracing in certain settings, may result in significant underreporting of outbreaks. This chart does not provide a complete picture of outbreaks in
   Michigan and the absence of identified outbreaks in a particular setting in no way provides evidence that, in fact, that setting is not having outbreaks. Week of 12/16 98% LHDs reporting due to technical difficulties.
   NOTE (10/4): MDHHS adopted the new CSTE school cluster and outbreak definition which impacts how transmissions within school-sponsored settings are reported to the health department

   Source: LHD Weekly Sitreps

                                                                     Prevent Death and Severe                                                                                                               Keep Vital Infrastructure
Current Trends and Projections                                                                                                        Protect Healthcare Capacity                                                                     28
                                                                            Outcomes                                                                                                                              Functioning
MI School Districts and Mask Policy as of Jan 10, 2023
       Yes – Any masking policy in some subset of school grades
       No – No mask policies (includes unknown)

            NUMBER OF SCHOOL DISTRICTS                                      NUMBER OF STUDENTS* IN SCHOOL                                   NUMBER OF SCHOOL
             WITH MASK POLICIES IN K-12                                      DISTRICTS WITH MASK POLICIES                               DISTRICTS WITH MASK POLICY
                     SETTINGS                                                                                                                    REVERSAL
                                                                                                                                 600

                                                                                                                                 500
                                                                Yes, 184
                                                                              No                                                 400
                                                                            562,491                                              300
                                                                                                                      Yes
                                                                                                                    690,317 200
              No, 349                                                                                                            100

                                                                                                                                   0
                                                                                                                                       Mask Policy Present   No Mask Policy   Mask Policy Rescinded

  •     35% (184/533) of K-12 school districts have mandatory mask policies
  •     School districts with mandatory mask policies cover 55% (690,317/1,252,808) of K-12 students*
  •     Not all K-12 grades or students may be covered by mask policies; examples include policies for those through K-6, or only during higher levels of
        community transmission
  •     14% of K-12 school districts have rescinded their mask policies
        * Student size based on school enrollment numbers; Buses and public transportation are federally required to enforce mask mandates
Source: Executive Office of Governor School District Mask Policy Database

                                                                  Prevent Death and Severe                                                              Keep Vital Infrastructure
  Current Trends and Projections                                                                    Protect Healthcare Capacity
                                                                         Outcomes                                                                             Functioning
New guidance info graphic on isolation and quarantine

                                                        30
MDHHS COVID-19 testing Support to Schools
  •   MDHHS supplies rapid antigen tests to schools through the MI Safe Schools Testing program to support students testing to stay in the
      classroom after an exposure in the school setting.
  •   These tests are performed at the school
  •   Schools and individual school districts can request antigen test kits through the Mi Safer Schools: School Antigen COVID Test Ordering form
        •   So far in calendar year 2022 MDHHS has distributed over 72,000 rapid antigen tests to schools
        •   Throughout the pandemic, MDHHS has distributed over 2.7 million antigen test to schools
  •   The MI Backpack Home Test program supplements school-
      based testing by providing over the counter or at home tests
      to students
  •   These tests are intended to be taken home with the student
      and used in the household when there is an exposure or
      when someone in the household has symptoms
  •   Currently, 337 school districts have participated in the
      program with nearly 175,000 OTC tests distributed this
      school year
  •   School districts can indicate their interest in participating in
      this program by completing the following survey:
      https://forms.office.com/g/is9FYDMRzn

                                           Prevent Death and Severe                                                Keep Vital Infrastructure
Current Trends and Projections                                              Protect Healthcare Capacity                                      31
                                                  Outcomes                                                               Functioning
Nine K-12 Schools returning to virtual learning due to COVID-19
   Schools can reduce in-school transmission, but community transmission impacts learning as well

    Week of Jan 3:
    • 9 school districts with over 98,000 children enrolled
       o Genesee County: Flint
       o Ingham County: Lansing
       o Oakland County: Oak Park, Pontiac, Southfield
       o Washtenaw County: Ann Arbor
       o Wayne County: Detroit, Hamtramck, Romulus

    Week of Jan. 10:
    • Lansing and Ann Arbor districts returned to in person
    • Remaining 7 school districts are still virtual

                                   Prevent Death and Severe                                 Keep Vital Infrastructure
Current Trends and Projections                                Protect Healthcare Capacity                             32
                                          Outcomes                                                Functioning
Guiding principles and tools

To prioritize equity in each of the objectives listed below
1. Prevent death and severe outcomes

2. Protect healthcare capacity (from first responders to hospitals
   to Long Term Care Systems)

3. Keep vital infrastructure (schools, corrections) functioning,
   while planning for recovery
Therapeutics
      Antibodies   Antivirals
Vaccines                                                       Tests
Protect against                                        Prevent spread
severe outcomes                                   We encourage testing
Boosters are more                                before gatherings, with
important than ever,                               symptoms, and after
and available for                                              exposure
individuals 12+              Protect Yourself,
                               Protect Your
                               Community
Masks, Distancing                                     Treatment
& Ventilation                                          Protect against
Prevent spread                                       severe outcomes
Well-fitting, high-quality                           Oral antivirals and
masks in all indoor public                        monoclonal antibody
or crowded settings are                          infusions are available
more important than ever
APPENDIX
State Comparisons: Ohio and Indiana
Ohio Confirmed New Cases / 1M (7 days average)                                                               Indiana Confirmed New Cases / 1M (7 days average)
2000                                                                                                         2000
1500                                                                                                         1500

1000                                                                                                         1000

 500                                                                                                          500
   0                                                                                                            0
       May 1, 20   Aug 1, 20     Nov 1, 20         Feb 1, 21   May 1, 21   Aug 1, 21   Nov 1, 21 Feb 1, 22          May 1, 20   Aug 1, 20     Nov 1, 20       Feb 1, 21   May 1, 21   Aug 1, 21      Nov 1, 21 Feb 1, 22

                                                                                                             60K
60K
           Percent Positive (7 day average)                         New Tests
                                                                                                                                                                                                                28.0%
                                                                                                                          Percent Positive (7 day average)
                                                                                                             40K
40K
                                                                                                   18.8%
                                                                                                                                                                                         New Tests

20K                                                                                                          20K

 0K                                                                                                           0K
       May 1, 20   Aug 1, 20     Nov 1, 20         Feb 1, 21   May 1, 21   Aug 1, 21   Nov 1, 21 Feb 1, 22          May 1, 20   Aug 1, 20     Nov 1, 20       Feb 1, 21   May 1, 21   Aug 1, 21      Nov 1, 21 Feb 1, 22

   0                                                                                                            0

 -50           Mobility retails and recreational                                                                          Mobility retails and recreational
                                                                                                              -50

 600                                                                                                  566                                                                                                           457
                                                                                                              400
 400
                    Hospitalizations / 1M                                                                                          Hospitalizations / 1M
 200                                                                                                          200

   0                                                                                                            0
       May 1, 20   Aug 1, 20     Nov 1, 20         Feb 1, 21   May 1, 21   Aug 1, 21   Nov 1, 21 Feb 1, 22          May 1, 20   Aug 1, 20     Nov 1, 20       Feb 1, 21   May 1, 21   Aug 1, 21      Nov 1, 21 Feb 1, 22

                                                                                                                                                                                                                  37
State Comparisons: Wisconsin and Michigan
Wisconsin Confirmed New Cases / 1M (7 days average)                                                          Michigan Confirmed New Cases / 1M (7 days average)
2000                                                                                                         2000
1500                                                                                                         1500

1000                                                                                                         1000

 500                                                                                                          500
   0                                                                                                            0
       May 1, 20   Aug 1, 20     Nov 1, 20         Feb 1, 21   May 1, 21   Aug 1, 21   Nov 1, 21 Feb 1, 22          May 1, 20   Aug 1, 20     Nov 1, 20       Feb 1, 21   May 1, 21   Aug 1, 21      Nov 1, 21 Feb 1, 22

60K                                                                                                29.2%                                                                                                         33.1%
           Percent Positive (7 day average)                                                                  80K
                                                                    New Tests
                                                                                                             70K
40K                                                                                                          60K          Percent Positive (7 day average)
                                                                                                             50K
                                                                                                                                                                                         New Tests
                                                                                                             40K
20K                                                                                                          30K
                                                                                                             20K
                                                                                                             10K
 0K
       May 1, 20   Aug 1, 20     Nov 1, 20         Feb 1, 21   May 1, 21   Aug 1, 21   Nov 1, 21 Feb 1, 22          May 1, 20   Aug 1, 20     Nov 1, 20       Feb 1, 21   May 1, 21   Aug 1, 21      Nov 1, 21 Feb 1, 22

   0                                                                                                            0

 -50           Mobility retails and recreational                                                              -50
                                                                                                                          Mobility retails and recreational

                                                                                                             -100
 400                                                                                                  402                                                                                                           450
                                                                                                              400
 300                                                                                                                            Hospitalizations / 1M
                    Hospitalizations / 1M
 200                                                                                                          200
 100
                                                                                                                0
       May 1, 20   Aug 1, 20     Nov 1, 20         Feb 1, 21   May 1, 21   Aug 1, 21   Nov 1, 21 Feb 1, 22          May 1, 20   Aug 1, 20     Nov 1, 20       Feb 1, 21   May 1, 21   Aug 1, 21      Nov 1, 21 Feb 1, 22

                                                                                                                                                                                                                  38
State Comparisons: Illinois and Minnesota
Illinois Confirmed New Cases / 1M (7 days average)                                                                Minnesota Confirmed New Cases / 1M (7 days average)

 2K                                                                                                                2K

 1K                                                                                                                1K

 0K                                                                                                                0K
       May 1, 20     Aug 1, 20      Nov 1, 20      Feb 1, 21       May 1, 21   Aug 1, 21    Nov 1, 21 Feb 1, 22          May 1, 20    Aug 1, 20     Nov 1, 20       Feb 1, 21   May 1, 21   Aug 1, 21      Nov 1, 21 Feb 1, 22

                                                                                                                  100K                                                                                            25.2%

150K        Percent Positive (7 day average)                             New Tests                     19.6%
                                                                                                                                Percent Positive (7 day average)
100K
                                                                                                                  50K                                                                          New Tests

50K

 0K                                                                                                                0K
       May 1, 20      Aug 1, 20      Nov 1, 20         Feb 1, 21   May 1, 21    Aug 1, 21   Nov 1, 21 Feb 1, 22          May 1, 20     Aug 1, 20     Nov 1, 20      Feb 1, 21   May 1, 21   Aug 1, 21      Nov 1, 21 Feb 1, 22

   0                                                                                                                 0
                   Mobility retails and recreational                                                                            Mobility retails and recreational
 -50                                                                                                               -50
                                                                                                                  -100
                                                                                                           522
                                                                                                                   300
 400                                                                                                                                   Hospitalizations / 1M                                                              250
                        Hospitalizations / 1M                                                                      200
 200
                                                                                                                   100
   0                                                                                                                 0
        May 1, 20     Aug 1, 20      Nov 1, 20         Feb 1, 21   May 1, 21    Aug 1, 21   Nov 1, 21 Feb 1, 22           May 1, 20    Aug 1, 20     Nov 1, 20      Feb 1, 21   May 1, 21   Aug 1, 21      Nov 1, 21 Feb 1, 22

                                                                                                                                                                                                                          39
Michigan Lag-adjusted new COVID cases by onset date
 New confirmed cases by onset actual and adjusted as of January 10, 2022 (-2 days)

   20K
                      ADJUSTED
                      NEW_CASES

   15K

   10K

    5K

    0K
         Feb 1, 20   Apr 1, 20    Jun 1, 20   Aug 1, 20   Oct 1, 20   Dec 1, 20   Feb 1, 21   Apr 1, 21   Jun 1, 21   Aug 1, 21   Oct 1, 21   Dec 1, 21   Feb 1, 22

                                                                                                                                                                  40
Michigan continuing to experience high
    daily case count during the pandemic

    Dashboard | CDC | MI Start Map for most recent data by
    reporting date

•    All counties at High Transmission level
•    Referrals sharply rose over New Year holiday weekend

                                         Prevent Death and Severe                                 Keep Vital Infrastructure
Current Trends and Projections                                      Protect Healthcare Capacity                             41
                                                Outcomes                                                Functioning
Time Trends – Annual Comparison
    •     Case rates (by onset date) are the highest of the pandemic
    •     Current increases after holidays due to spread of the Delta and Omicron variants

    7- day rolling average of Rates 2020 vs 2021

        1600                                                                                             Omicron (B.1.1.529) Wave

        1400

        1200

        1000
                                                                                         2020 Holiday wave
                Alpha (B.1.1.7) wave
         800

         600
                                                     Delta (B.1.617.2) wave
         400
                     First wave
         200

           0
               3/1     4/1        5/1     6/1      7/1      8/1          9/1      10/1        11/1    12/1      1/1       2/1
                                                                  2020     2021

                                        Prevent Death and Severe                                                Keep Vital Infrastructure
Current Trends and Projections                                             Protect Healthcare Capacity                                    42
                                               Outcomes                                                               Functioning
Confirmed and probable case indicators                                                              Risk levels
           Table Date: 1/10/2022 (7 days from date table was produced: 1/3/2022)                    Low    A    B      C      D      E

             Cases                                               Positivity

                       National                                               Public Health     Other                      Science
Special Populations                   Spread          Severity                                                                           43
                      Comparison                                               Response       Indicators                Roundup
Time Trends – Positivity, Case Rates, Hospitalizations, Deaths
        Most COVID-19 indicators are at all-time highs, and burden remains high in MI
       Daily Positive Test Rate                                                                Daily Inpatient Beds Occupied by COVID patients

       Daily Case Rate                                                                         Daily Deaths

Source: Michigan Disease Surveillance System and https://www.mistartmap.info/mism-indicators

                                 National                                                                Public Health      Other          Science
Special Populations                                            Spread                     Severity                                                   44
                                Comparison                                                                Response        Indicators      Roundup
Number of Cases and CaseRates by Age Group, data as of Jan 10
    Daily new confirmed and probable cases per million by age group (7-day rolling average)

                   Age                 Average†                    Average†                  One Week
                  Group               daily cases                 Daily Case               % Change (Δ #)*        •   Trend numbers and comparisons are
                                                                     Rate                                             being impacted by longer backfill times –
               0-9                          964.9                      837.0                     +69% (+395)          the data in this table are comparing the
                                                                                                                      two time points from the most recent data
               10-19                      1,560.7                     1,243.7                    +59% (+580)
                                                                                                                      file
               20-29                      2,872.6                     2,082.2                    +38% (+793)
                                                                                                                  •   Average daily number of cases (2,872.6) and
               30-39                      2,361.9                     1,946.9                    +37% (+642)          average daily case rate (2,082 case/mil) are
               40-49                      1,880.0                     1,594.1                    +46% (+589)          highest for those aged 20-29
               50-59                      1,729.4                     1,280.8                    +60% (+647)      •   Case rates for all age groups have increased
               60-69                      1,081.6                      847.8                     +64% (+422)          between the weeks of Dec 27 and Jan 3.
                                                                                                                      These increases are continuing after Jan 3
               70-79                        532.0                      693.8                     +84% (+243)
                                                                                                                      for all age groups.
               80+                          242.9                      586.3                     +93% (+117)
               Total¶                    13,244.3                     1,315.0                    +50% (+4,434)
              † Rolling 7-day average; ¶ Total may not reflect state due to missing age data
              Note: Case information sourced from MDHHS and reflects date of onset of symptoms
              Source: MDHHS – Michigan Disease Surveillance System

                             National                                                                            Public Health         Other             Science
Special Populations                                                 Spread                           Severity                                                      45
                            Comparison                                                                            Response           Indicators         Roundup
Overview of metrics for individuals < 12 and
Cumulative COVID-19 Cases by Vaccination Status, Michigan, 1/15/21 – 1/3/22
                                                                                 Fully Vaccinated People (5,374,144)
                                         Cases                                                      Hospitalization                                                            Deaths
                   Percent of Cases In People Not                                 Percent of Hospitalizations In People                                   Percent of Deaths In People Not
                          Fully Vaccinated                                                Not Fully Vaccinated                                                   Fully Vaccinated
                                 (856,449 / 1,077,856)                                                 (19,659 / 22,862)                                                   (10,916 / 13,178)
                                         79.5%                                                               86.0%                                                              82.8%
                                       856,449                                                              19,659                                                              10,916
                         Total Cases Not Fully Vaccinated                                Total Hospitalized Not Fully Vaccinated                                Total Deaths Not Fully Vaccinated

                        Total Breakthrough Cases                                    Total Breakthrough Hospitalizations                                        Total Breakthrough Deaths
                                 221,407                                                           3,203                                                                 2,262
                                         4.12%                                                              0.060%                                                             0.042%
                   Percent of Fully Vaccinated People who                           Percent of Fully Vaccinated People Who Were                       Percent of Fully Vaccinated People Who Died of
                  Developed COVID-19 (221,407 / 5,374,144)                          Hospitalized for COVID-19 (3,203 / 5,374,144)                              COVID-19 (2,262 / 5,374,144)

                                         20.5%                                                               14.0%                                                              17.2%
                 Percent of Cases Who Were Fully Vaccinated                           Percent of Hospitalizations Who Were Fully                        Percent of Deaths Who Were Fully Vaccinated
                             (221,407 /1,077,856)                                            Vaccinated (3,203 / 22,862)                                               (2,262 /13,178)

                          Total Cases: 1,077,856                                         Total Hospitalizations: 22,862                                             Total Deaths: 13,178
Michigan Disease Surveillance System may underestimate the frequency of COVID-19 hospitalizations:
- Case investigation and follow-up is more difficult for individuals who get hospitalized (e.g., they are too ill to speak to investigators, don’t answer their phone, or otherwise).
- These hospitalizations include individuals who are hospitalized for issues other than COVID19 (the same as breakthrough COVID-19).
- Individuals who get hospitalization will lag after infection and may occur after case investigation.

                                                               Prevent Death and Severe                                                                                           Keep Vital Infrastructure
  Current Trends and Projections                                                                                      Protect Healthcare Capacity
                                                                      Outcomes                                                                                                          Functioning
National Age-Standardized Rates of COVID-19 Cases and Deaths by                              `

  Vaccination Status

Footnotes: Incidence rates were age-standardized using the 2000 U.S. Census standard population; and rates are not adjusted for time since vaccination, underlying conditions, or other demographic factors
besides age. | Incidence rate ratios for the past one month were calculated by dividing the average weekly incidence rates among unvaccinated people by that among fully vaccinated people.

                                                             Prevent Death and Severe                                                                                    Keep Vital Infrastructure
   Current Trends and Projections                                                                                Protect Healthcare Capacity
                                                                    Outcomes                                                                                                   Functioning
Michigan Age-Standardized Rates of COVID-19 Cases and Deaths by                              `

  Vaccination Status

                                              In October, unvaccinated persons had:
                                                                    4.3 X                                AND                            13.2 X
                                                    Risk of Testing Positive for COVID-19                                      Risk of Dying from COVID-19
                                              compared to fully vaccinated persons
Footnotes: Incidence rates were age-standardized using the 2000 U.S. Census standard population; and rates are not adjusted for time since vaccination, underlying conditions, or other demographic factors
besides age. Incidence rate ratios for the past one month were calculated by dividing the average weekly incidence rates among unvaccinated people by that among fully vaccinated people.

                                                             Prevent Death and Severe                                                                                    Keep Vital Infrastructure
   Current Trends and Projections                                                                                Protect Healthcare Capacity
                                                                    Outcomes                                                                                                   Functioning
Risk of becoming ill or dying much higher in unvaccinated individuals
                                                                                                   Age-Adjusted Case and Death Rates per 100,000 People
        In October 2021:                                                                                    by Vaccination Status, October 2021
        Unvaccinated persons in Michigan had 4.3
        times the risk of testing positive for COVID-19
        compared to fully vaccinated persons
        •    566.2 cases per 100,000 unvaccinated
             persons compared to 130.9 cases per
             100,000 fully vaccinated persons

        Unvaccinated persons in Michigan had 13.2
        times the risk of dying from COVID-19
        compared to fully vaccinated persons
        •    10.6 deaths per 100,000 unvaccinated
             persons compared to 0.8 deaths per
             100,000 fully vaccinated persons

Footnotes: Incidence rates were age-standardized using the 2000 U.S. Census standard population; and rates are not adjusted for time since vaccination, underlying conditions, or other demographic factors
besides age. Incidence rate ratios for the past one month were calculated by dividing the average weekly incidence rates among unvaccinated people by that among fully vaccinated people.

                                                             Prevent Death and Severe                                                                                    Keep Vital Infrastructure
   Current Trends and Projections                                                                                Protect Healthcare Capacity
                                                                    Outcomes                                                                                                   Functioning
National Age-Standardized Rates of COVID-19 Cases and Deaths by                              `

  Vaccination + Booster Status

Footnotes: Incidence rates were age-standardized using the 2000 U.S. Census standard population; and rates are not adjusted for time since vaccination, underlying conditions, or other demographic factors
besides age. | Incidence rate ratios for the past one month were calculated by dividing the average weekly incidence rates among unvaccinated people by that among fully vaccinated people.

                                                             Prevent Death and Severe                                                                                    Keep Vital Infrastructure
   Current Trends and Projections                                                                                Protect Healthcare Capacity
                                                                    Outcomes                                                                                                   Functioning
Average and total new deaths, by age group
   Daily COVID-19 deaths in confirmed and probable                                                                   Total COVID -19 deaths in confirmed and probable
   cases per million by age group (7 day rolling average)                                                            cases by age group (past 30 days, ending 1/3/2022)

      100              0-19                40-49               70-79                                             •       22% of deaths below age sixty
                       20-29               50-59               80+
                                                                                                                                                                                 826
                       30-39               60-69               Total

      75
                                                                                                                                                                        680
                                                                                                                                                                643

      50
                                                                                                                                                     371

      25
                                                                                                                                             144
                                                                                                                                      57
                                                                                                                     0        20
        0
            7/1            8/1             9/1            10/1            11/1           12/1              1/1    0-19       20-29   30-39   40-49   50-59     60-69   70-79     80+
  •     Through 1/3, the 7-day avg. death rate is more than 40 daily deaths per million people for those over the age of 80
  •     In the past 30 days, the proportion of deaths among those over 60 is steady

  Note: Death information sourced from MDHHS and reflects date of death of confirmed and probable cases.
  Source: MDHHS – Michigan Disease Surveillance System (MDSS)

                                                                Prevent Death and Severe                                                                   Keep Vital Infrastructure
Current Trends and Projections                                                                                   Protect Healthcare Capacity                                         52
                                                                       Outcomes                                                                                  Functioning
Michigan Trends in Emergency Department (ED) Visits for
       Diagnosed COVID-19
                                                                                                                                      15.2%

 •    Trends for ED visits have increased to 15.2% since last week (last week: 11.7%) but are down from the recent peak of 15.5% (on Jan 4)
 •    Over past week, those 40-49 years saw highest number of avg. daily ED CLI visits (16.8%), but those between 25-64 all above state average

Source: https://covid.cdc.gov/covid-data-tracker/#ed-visits; data extracted on 10/18/2021

                                   National                                                            Public Health     Other        Science
Special Populations                                                 Spread                  Severity
                                  Comparison                                                            Response       Indicators    Roundup
You can also read