MIAMI-SOUTH FLORIDA National Weather Service Forecast Office
←
→
Page content transcription
If your browser does not render page correctly, please read the page content below
MIAMI-SOUTH FLORIDA
                                               National Weather Service
                                                    Forecast Office
                                                 http://www.weather.gov/miami

             SOUTH FLORIDA WINTER 2018-2019 SUMMARY

     Another Very Warm February Results in Warmer than
                      Normal Winter
                     Precipitation Mainly Above Normal
March 5, 2019: Following on the footsteps of 2018’s warmest February on record,
February 2019 was the second warmest on record at Miami, Fort Lauderdale, and
Naples, with West Palm Beach ending up as the 4th warmest February on record.

After a December and January with a fair number of cold frontal passages, subtropical
high pressure dominated in February and blocked most fronts from moving through
South Florida. This resulted in a warm and humid air mass over South Florida for almost
the entire month.

Therefore, despite a near-normal January and a slightly warmer than normal December,
the 2018-2019 meteorological winter season (December – February) ended up among
the top 25 warmest on record. See temperature table and graphics below for specific
values.

The slow and late-developing El Niño episode likely played a small role in keeping our
temperatures close to normal for most of the first 2 months, due at least in part to more
frequent frontal passages and a few more cloudier days relative to normal. However,
the weak nature of this winter’s El Niño meant that it was overridden by other factors
such as the North Atlantic Oscillation (NAO) and Arctic Oscillation (AO), which resulted
in the abnormally warm February pattern.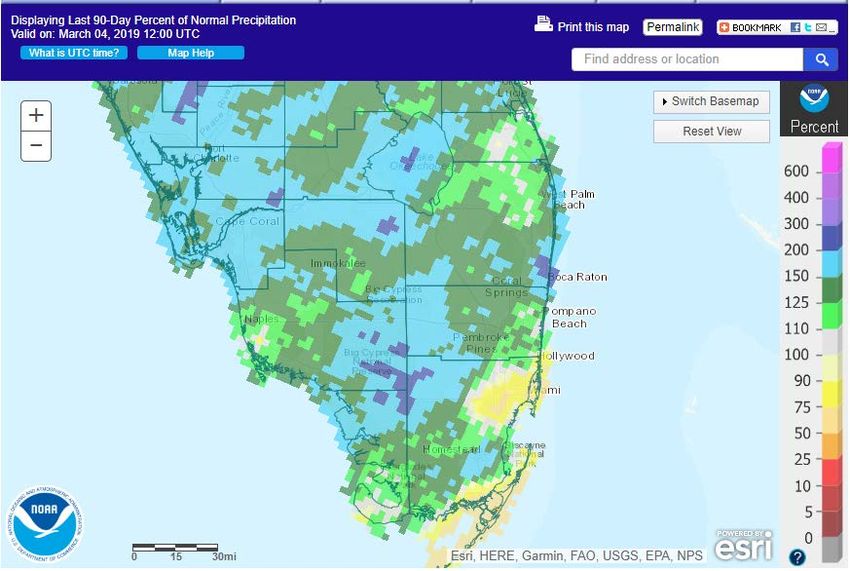
Temperatures
Driven by the warm February, average winter temperatures ended up about 2 to 3
degrees above normal across most of South Florida (Figure 1). The 2018-2019 winter
was the 8th consecutive warmer-than normal winter in South Florida (Figure 2), with the
last cooler-than-normal winter being 2010-2011.

      Figure 1: Temperature Departure from Normal across the U.S. for December 2018-February 2019
Figure 2: Average winter 2018-2019 temperatures

The lowest temperatures of the winter occurred on the heels of a strong cold front that
swept through South Florida on Sunday, January 20th. Low temperatures on the morning
of January 21st dipped into the 30s over most of interior South Florida, with a lowest
reading of 32F at Ortona in western Glades County. Lows over metro sections of both
the Atlantic and Gulf coasts were in the lower to mid 40s. No significant freezes were
noted in South Florida.

In contrast, the temperature reached or exceeded 80F on anywhere from 19 to 21 days
in February, with the highest temperatures during the second half of the month when
readings reached the upper 80s on a couple of days, and even hitting 90F in Naples on
February 19th which established a new record for the highest February temperature on
record.
Below are graphics with additional temperature data for the four main climate sites in
South Florida:
Figure 3: Number of days of sub-70F degree highs and/or sub-50F degree lows.
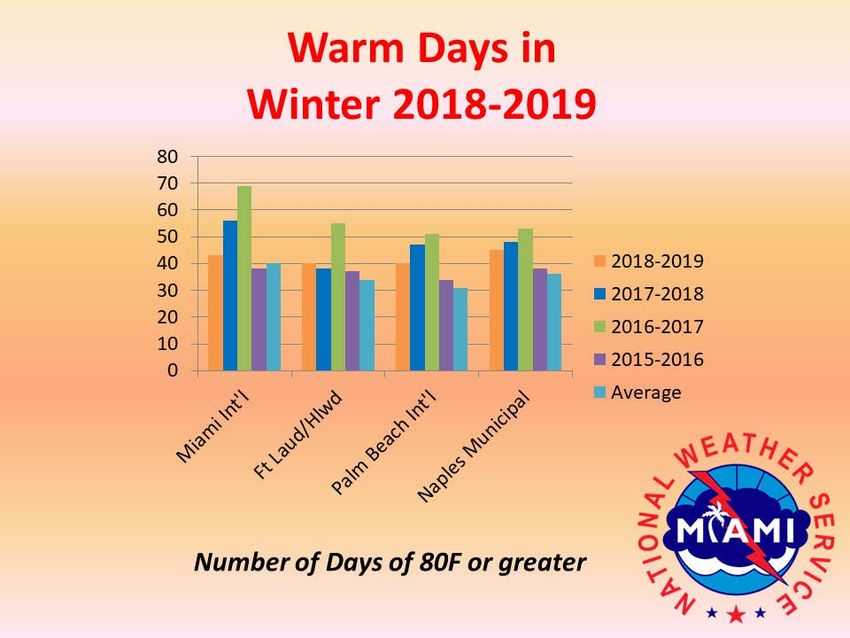
Figure 4: Number of days greater than or equal to 80 degrees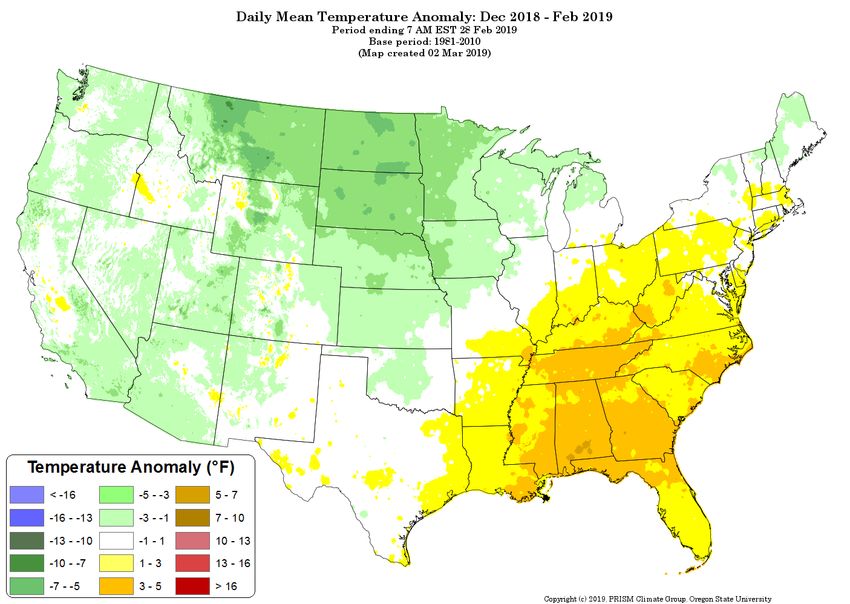
Here are average December 2018-February 2019 temperatures, departure from normal
in degrees F and ranking for the four main South Florida climate sites:

Location (beginning of         Dec 2018-    Departure From     Top 25 Rank
period of historical record)   Feb 2019       Normal (F)
                               Avg Temp
Miami (1911)                     71.5            +1.9         T-15th warmest
Fort Lauderdale (1912)           71.5            +1.2         T-11th warmest
West Palm Beach (1888)           69.4            +2.2         T-22nd warmest
Naples (1942)                    69.1            +3.0          T-8th warmest

Other noteworthy statistics and data:

- Miami International Airport: The highest temperature recorded was 87 degrees set on
December 3rd and the lowest temperature recorded was 46 degrees on January 21st. The
temperature reached or exceeded 80 degrees on 43 days, slightly above the average of
40 days. The number of days below 50 degrees was one (1) which is well below the 30-
year mean of 8.

- Palm Beach International Airport: The highest temperature recorded was 86 degrees
on December 8th and the lowest temperature recorded was 38 degrees on January 4th.
The temperature reached or exceeded 80 degrees on 40 days, above the average of 31
days. The number of days below 50 degrees was 11 which is below the 30-year mean of
16.

- Fort Lauderdale/Hollywood International Airport: The highest temperature recorded
was 85 degrees on December 8th and the lowest temperature recorded was 39 degrees
on January 4th. The temperature reached or exceeded 80 degrees on 40 days, above the
average of 34 days. The number of days below 50 degrees was two (2) which is slightly
below the 30-year mean of 11.

- Naples Municipal Airport: The highest temperature recorded was 89 degrees on
February 12th and 21st and the lowest temperature recorded was 36 degrees on January
18th. The temperature reached or exceeded 80 degrees on 45 days, well above the
average of 36 days. The number of days below 50 degrees was 9 which is well below the
30-year mean of 21.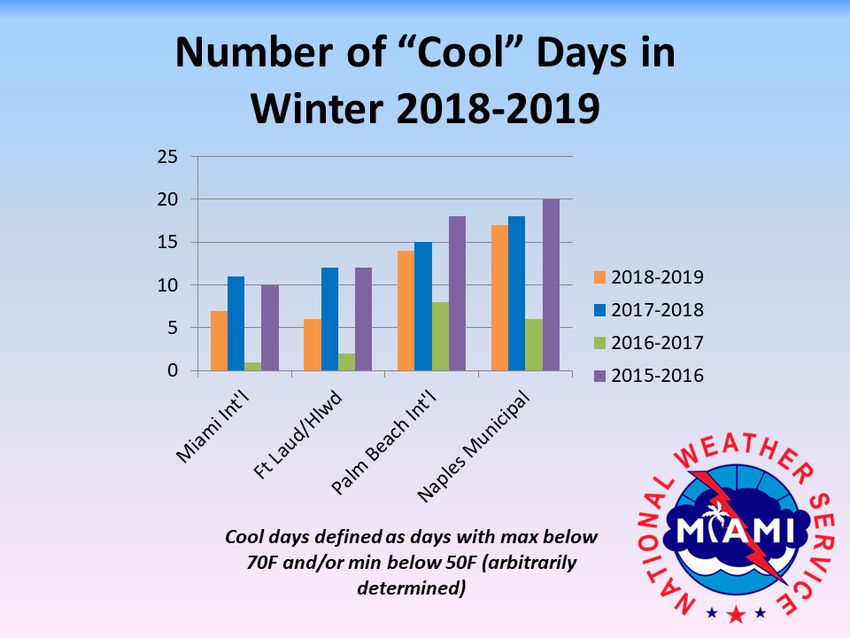
Precipitation
After a dry December and first week of January, rainfall picked up across South Florida
as cold fronts moved through the region with more regularity during the middle to late
part of the month. The relatively wet pattern continued in February, especially along the
coast of Palm Beach County where a stalled front on the 26th produced anywhere from 7
to 10 inches of rain in the Boca Raton and Delray Beach areas. February was also
noticeably wet over interior sections of the peninsula from the Big Cypress Preserve to
the western shore of Lake Okeechobee. The end result was a wetter than normal winter
over most of South Florida, with the exceptions being metro Miami-Dade County, far
southern metro Broward County, and small pockets of western Collier County south of
Naples. Most areas recorded at least 6 inches of rain this winter, with a maximum
observed amount of 14.72 inches in Juno Beach and an estimated total of around 20
inches in southern Palm Beach County. Most of Miami-Dade County recorded between
5 and 6 inches of rain, and Naples Municipal Airport recorded the lowest observed
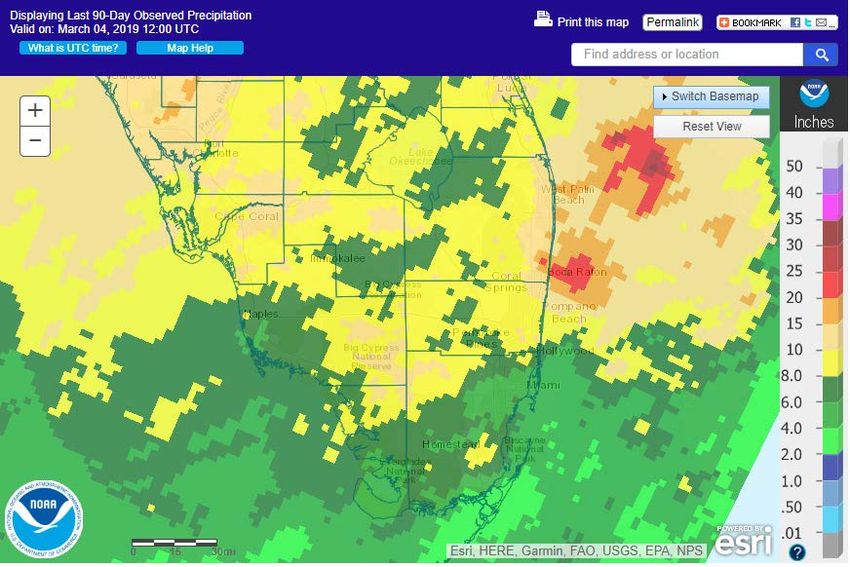
amount of 4.67 inches. The wet January and February led to the elimination of drought
conditions across South Florida, with only a small area of abnormally dry conditions left
over across parts of Southeast Florida.
Figure 5: Observed precipitation for winter 2018-2019
Figure 6: Percent of normal precipitation for winter 2018-2019

Following are December 2018-February 2019 rainfall totals, departure from normal in
inches and ranking for selected locations:

                                                  Dec 2017-
                                                                     Departure       Top 20
Location (Beginning of Period of                  Feb 2018
                                                                       from          Rank
Record)                                            Rainfall
                                                                      Normal
                                                   (inches)
Brighton Reservation (Glades Co.)                    7.78               +1.80
Canal Point (1941)                                   8.84               +2.40
Cape Florida                                         4.95
Devils Garden (1957)                                 11.28              +5.40       6th Wettest
Flamingo (1952)                                      5.52               +0.42
Fort Lauderdale/Hollywood Int'l (1912)               8.10               -0.95
Fort Lauderdale Executive Airport                    8.24               +1.67
Fort Lauderdale Dixie Water Plant                    9.77               +1.52
Fort Lauderdale Beach                                11.09              +2.68
Hialeah (1940)                                 5.05           -1.86
Hollywood (1963)                               12.17          +3.12
Homestead General Airport (1990)               5.92           +0.75
Immokalee (1970)                               8.42           +1.97       12th Wettest
Juno Beach (2003)                              14.72          +4.95       5th Wettest
LaBelle (1929)                                 9.58           +3.43       9th Wettest
Loxahatchee NWR (1991)                         10.53          +1.45
Marco Island                                   6.55           +0.33
Miami Beach (1928)                             5.34           -1.13
Miami International Airport (1895)             5.11           -0.80
Moore Haven (1918)                             9.25           +3.71       11th Wettest
Muse                                           10.27
North Miami Beach                              8.94           +1.59
Naples East/Golden Gate                        11.74
Naples Municipal Airport (1942)                4.67           -0.73
NWS Miami                                      5.38           -0.47
Oasis Ranger Station (1978)                    9.99           +4.81        4th Wettest
Opa-Locka Airport                              6.70           -0.29
Palm Beach International Airport (1888)        12.75          +3.42       20th Wettest
Pembroke Pines – North Perry Airport           7.66           -0.13
Pompano Beach Airpark                          10.24          +3.01
Miami Executive Airport – W. Kendall           6.14           -0.27
The Redland (1942)                             5.45           -0.67
South Bay (15S)                                9.88

Severe Weather
The only severe weather events of note this winter occurred with the following weather
events:

- December 20th & 21st: a strong cold front swept through South Florida, spreading
showers and thunderstorms across the area during the afternoon and evening of the
20th. Following the passage of the front, strong and gusty west winds as high as 50-60
mph affected all of South Florida during the day of the 21st. Power lines and trees were
damaged in some areas due to these high wind gusts, and some coastal flooding was
reported on Naples Beach

- January 24th and 27th: two strong cold fronts moved through South Florida as low
pressure areas in the Gulf of Mexico and a strong subtropical jet stream aided in
producing an unstable atmosphere. A tornado was sighted on the morning of the 24th
just west of U.S. 27 in Palm Beach County, and another tornado of EF-0 intensity
touched down in sections of Hialeah during the evening of the 27th

In addition, a stalled front over Palm Beach County on February 26th led to rainfall of 7
to 10 inches over parts of Boca Raton and Delray Beach, resulting in the flooding of
several streets in both cities.

Outlook for March-May
The outlook by the NOAA Climate Prediction Center for the period from March through
May (Figures 7 and 8) calls for an increased likelihood of above normal temperatures
and precipitation, essentially a continuation of the pattern observed in February.

The mostly wetter than normal winter and the outlook indicating chances for a wetter
pattern continuing through May would help mitigate the wildfire threat across South
Florida. However, only a couple of weeks of drier than normal conditions during the
spring months would increase the wildfire threat during what is typically the peak of
wildfire season. All persons are urged to take measures to reduce the chance of
wildfires. Visit the Florida Forest Service web site for more information on how to help
prevent wildfires.

March and April also bring an increase in easterly winds to the area along with an
increase in beach-goers. This significantly increases the risk of rip currents along the east
coast beaches. A sharp increase in rip current-related drowning deaths and rescues
occurs during the spring months due in part to this shift in the wind patterns and more
people in the water. All residents and visitors visiting area beaches are strongly urged to
heed the advice of Ocean Rescue lifeguards and swim near a lifeguard. Visit the National
Weather Service Rip Current Awareness page for more information.
For the latest south Florida weather information, including the latest watches,
advisories and warnings, please visit the National Weather Service Miami Forecast
Office’s web site at weather.gov/southflorida.

               Figures 7 and 8: NOAA Climate Prediction Center outlook for March-May.
You can also read