MMSA And the Saga Continues for Capital Cost Overruns in the Mining Industry - Denver, Colorado

Page created by Kathy Schultz
 
CONTINUE READING
MMSA And the Saga Continues for Capital Cost Overruns in the Mining Industry - Denver, Colorado
And the Saga
Continues for Capital
Cost Overruns in the
  Mining Industry

          MMSA
     Denver, Colorado

Presented by: Al Kuestermeyer

        November 8, 2019
MMSA And the Saga Continues for Capital Cost Overruns in the Mining Industry - Denver, Colorado
PRESENTATION DISCLAIMER

                                          This presentation is based on experience and knowledge gained over decades
                                          and is intended for informational and educational purposes only. This
                                          presentation does not replace the need for professional, legal, investment,
                                          technical or financial advice or independent professional judgement by the
                                          attendees.

                                          Samuel Engineering, Inc. does not assume any responsibility for the use,
                                          content, accuracy or completeness of the information presented. Please
                                          contact Samuel Engineering for further assistance.

Copyright © 2019 Samuel Engineering, Inc. All rights reserved.
MMSA And the Saga Continues for Capital Cost Overruns in the Mining Industry - Denver, Colorado
PRESENTATION OBJECTIVES

Copyright © 2019 Samuel Engineering, Inc. All rights reserved.
MMSA And the Saga Continues for Capital Cost Overruns in the Mining Industry - Denver, Colorado
RECAP HISTORY OF CAPITAL COST OVERRUNS

                              Capital Cost Overrun Definition: The amount by which the actual construction cost of project
                              exceeds its Engineering Study budget.
                              •       Robert Merton (1988): Average Mining = 1.99; Process Plants = 1.67; Oil Refineries = 1.63.
                              •       Average Capital Cost Overrun = 60% (1.60); Survey of 40+ mining projects in last 10 years versus metrics stated in
                                      Feasibility Study; Only 20% of surveyed mining and metals projects were completed within parameters predicted
                                      during feasibility study. Published by McKinsey & Company, “Optimizing mining feasibility studies: The $100 billion
                                      opportunity”. August 2019.
                              •       Median Overrun = 1.28; Average = 1.38; Internal study by RCF of Mining projects advancing from Feasibility Study
                                      stage through Construction based on evaluating 107 projects. Presented at SME’s 7th Annual Current Trends in
                                      Mine Finance by Ross Bhappu, RCF, April 28, 2019.
                              •       Average = 1.25 with Standard Deviation of 30%; of 63 projects, 44 with cost overruns, 7 with cost underruns; and
                                      12 on-budget. Published in The Engineering Economist June 2008. Authored by Jasper Bertisen and Graham A.
                                      Davis.
                              •       Average Cost Overrun = 1.37 (37%). Projects 2005 onwards. Budgeted capital cost of $1.2 billion – Actual capital
                                      cost of $1.6 billion. “Managing Capital Cost Overrun Risks in the Mining Industry,” presented at 2017 AACE®
                                      International Technical Paper© (OWN.2657.2). Authored by Lwin, Tin (P.Eng.) and Jose Lazo, Export Development
                                      Bank Canada.

Copyright © 2019 Samuel Engineering, Inc. All rights reserved.
MMSA And the Saga Continues for Capital Cost Overruns in the Mining Industry - Denver, Colorado
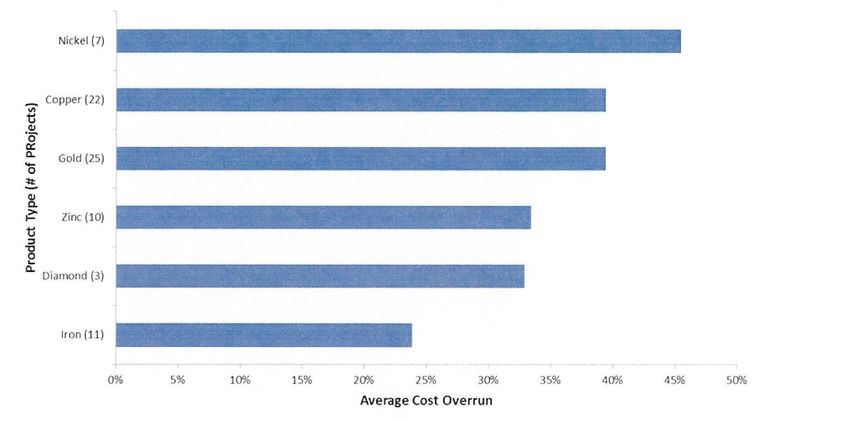
MINING PROJECT CAPITAL COST OVERRUN TREND

                                                       Source: Lwin, Tin (P.Eng.) and Jose Lazo, “Managing Capital Cost Overrun Risks in the Mining
                                                       Industry,” presented at 2017 AACE® International Technical Paper© (OWN.2657.2).

Copyright © 2019 Samuel Engineering, Inc. All rights reserved.
MMSA And the Saga Continues for Capital Cost Overruns in the Mining Industry - Denver, Colorado
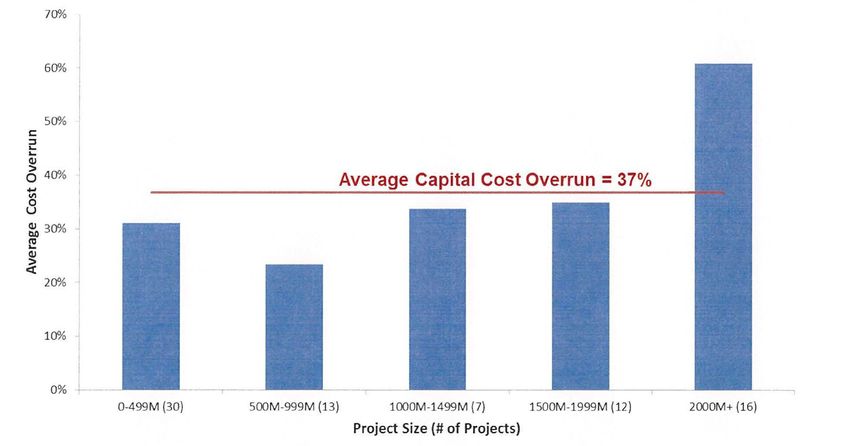
MINING PROJECT CAPITAL COST OVERRUNS BY PROJECT SIZE

                                                       Source: Lwin, Tin (P.Eng.) and Jose Lazo, “Managing Capital Cost Overrun Risks in the Mining
                                                       Industry,” presented at 2017 AACE® International Technical Paper© (OWN.2657.2).

Copyright © 2019 Samuel Engineering, Inc. All rights reserved.
MMSA And the Saga Continues for Capital Cost Overruns in the Mining Industry - Denver, Colorado
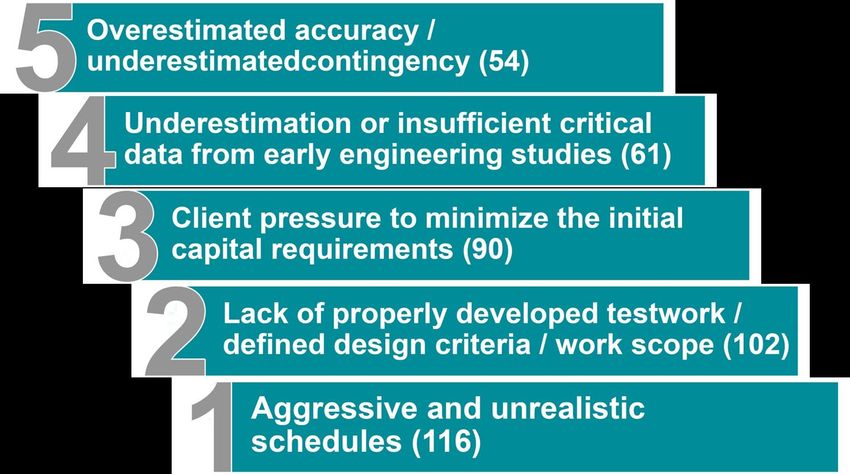
MINING PROJECT CAPITAL COST OVERRUNS BY COMMODITY TYPE

                                                       Source: Lwin, Tin (P.Eng.) and Jose Lazo, “Managing Capital Cost Overrun Risks in the Mining
                                                       Industry,” presented at 2017 AACE® International Technical Paper© (OWN.2657.2).

Copyright © 2019 Samuel Engineering, Inc. All rights reserved.
MMSA And the Saga Continues for Capital Cost Overruns in the Mining Industry - Denver, Colorado
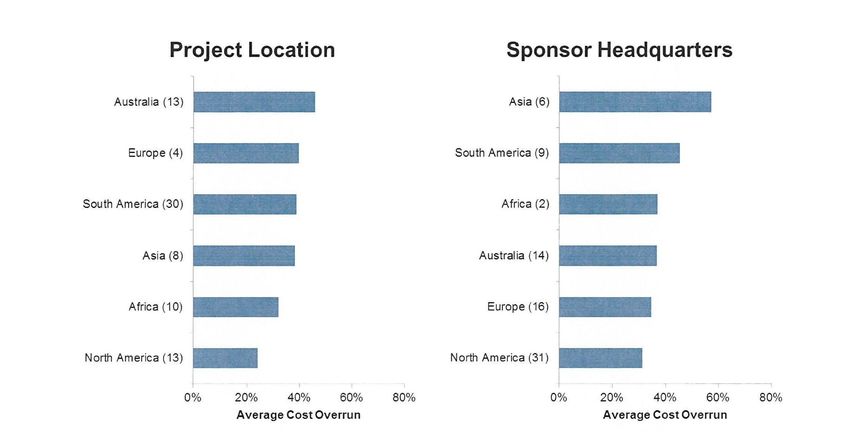
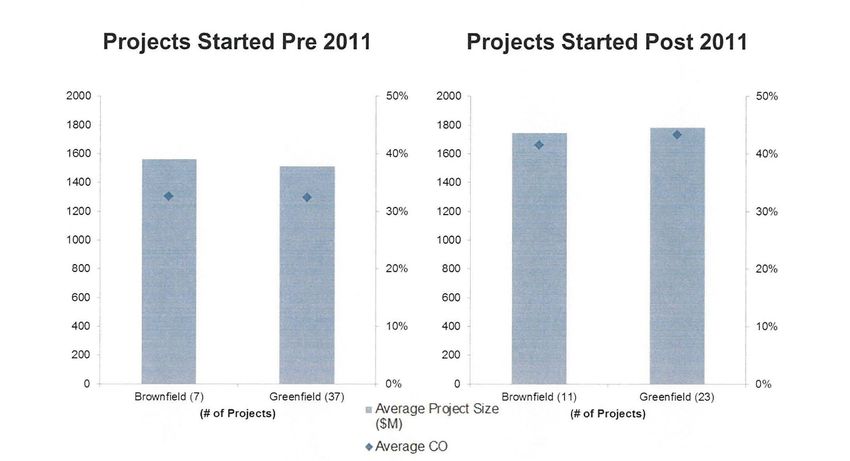
MINING PROJECT CAPITAL COST OVERRUNS BY PROJECT TYPE

                                                       Source: Lwin, Tin (P.Eng.) and Jose Lazo, “Managing Capital Cost Overrun Risks in the Mining
                                                       Industry,” presented at 2017 AACE® International Technical Paper© (OWN.2657.2).

Copyright © 2019 Samuel Engineering, Inc. All rights reserved.
MMSA And the Saga Continues for Capital Cost Overruns in the Mining Industry - Denver, Colorado
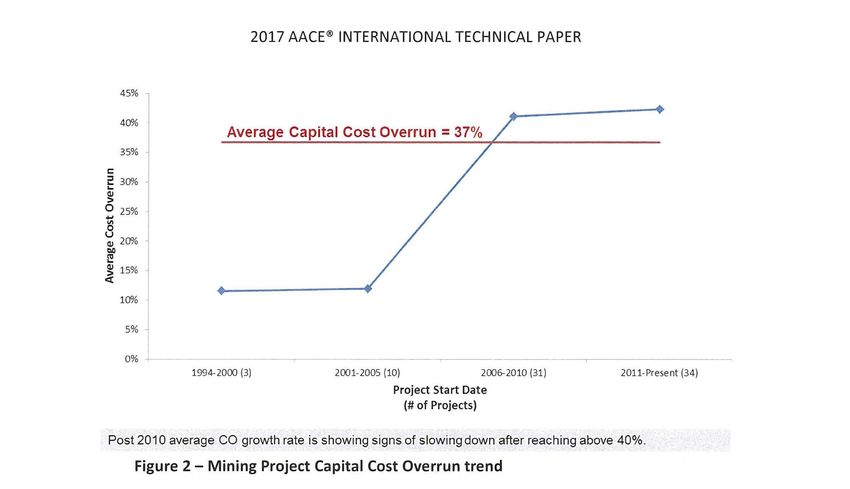
MINING PROJECT CAPITAL COST OVERRUNS BY PROJECT LOCATION AND SPONSOR HEADQUARTERS

                                                 Source: Lwin, Tin (P.Eng.) and Jose Lazo, “Managing Capital Cost Overrun Risks in the Mining Industry,” presented at 2017
                                                 AACE® International Technical Paper© (OWN.2657.2).

Copyright © 2019 Samuel Engineering, Inc. All rights reserved.
MMSA And the Saga Continues for Capital Cost Overruns in the Mining Industry - Denver, Colorado
KEY AREAS OF CONCERN FOR FEASIBILITY STUDIES

                                                 Source: McCarthy Peter. “Why Feasibility Studies FAIL” AusIMM Melbourne Branch, 2013.

Copyright © 2019 Samuel Engineering, Inc. All rights reserved.
STUDIES OF MINE PRODUCTIVITY PERFORMANCES

                                                                 Start-up performance of nine Australian underground base metal mines
                                    McCarthy and Ward (1999)     showed that only 50% achieved design throughput by Year 3 and 25%
                                                                 never achieved it at all.
                                                                 Results of 15 year study of 56 mines with Feasibility Studies showed that
                                    McCarthy (2004)
                                                                 only 20% were successful in achieving the design production capacity.
                                                                 Study of 41 underground mines showed that 60% of ore reserves were
                                    Tatman (2003)
                                                                 outside of expected range, some very seriously in error.
                                                                 Study showed that Finalv Feasibility Study production rates of 60 steeply-
                                    Tatman (2004)
                                                                 dipping tabular deposits did not achieve planned production rate.
                                                                 Study of 63 mines and smelters worldwide completed between 1980 and
                                                                 2001 showed that Feasibility Study capital cost estimates averaged
                                    Bertisen and Davis (2008)
                                                                 overruns of 25% on an as-built in actual (nominal) dollars and 14% after
                                                                 as-built costs when adjusted for inflation.
                                                                 Summary of eight studies of mining projects from 1965 to 2002 showed a
                                                                 weighted average capital cost overrun of +25% with 58 of 73 projects
                                    Bullock (2011)
                                                                 having cost overruns of greater than 15% but less than 100%, and eight
                                                                 with capital cost overruns greater than 100%.

Copyright © 2019 Samuel Engineering, Inc. All rights reserved.
5 STEPS FOR ENHANCEMENT OF FEASIBILITY STUDIES

                                            1. Set standardized criteria, such as AACE.
                                            2. Enforce project value improvement process to avoid design
                                               changes.
                                            3. Stress test the FS to cost benchmarks.
                                            4. Incentivize the FS contractors to maximize project values
                                               early in the project to establish a strong contracting strategy.
                                            5. Build a rigorous integrated master schedule and construction
                                               planning, marketing strategy and digital aspiration at every
                                               step of the FS development.
                                                      Source: McKinsey & Company. “Optimizing mining feasibility studies: The $100 billion opportunity,” August 2019.

          1/16/2020                                                                                                                                                     Mining & Minerals
                                                                                                           12
Copyright © 2019 Samuel Engineering, Inc. All rights reserved.
SURVEY QUESTIONS

                                    •       Aggressive and unrealistic schedules
                                    •       Costs escalated and/or factored from historic studies; no first
                                            principle estimates
                                    •       Lack of properly developed testwork/defined design criteria/work
                                            scope
                                    •       Inflation and/or changes in exchange rates
                                    •       Poor estimating methods (missing data/information)
                                    •       Overestimated accuracy/under-estimated contingency
                                    •       Client pressure to minimize the initial capital requirements
                                    •       Client pressure to quickly complete work

Copyright © 2019 Samuel Engineering, Inc. All rights reserved.
SURVEY QUESTIONS (CONTINUED)

                             •         Selection of wrong mining method and/or processing flow sheet
                             •         Underestimation of transportation and logistics
                             •         Underestimation and/or insufficient critical data from early engineering
                                       studies
                             •         Unrepresentative samples for geotechnical, environmental and/or
                                       metallurgical testing
                             •         Unexpected social, cultural, political and/or environmental issues
                             •         Estimates based on incomplete/insufficient bid packages
                             •         Owner and/or Engineer that is not experienced in pragmatic delivery
                                       of projects
                             •         Major changes in the funding and/or ownership of projects

Copyright © 2019 Samuel Engineering, Inc. All rights reserved.
TOP 5 CONTRIBUTING FACTORS

Copyright © 2019 Samuel Engineering, Inc. All rights reserved.
TOTAL POINTS FOR RESPONSES

Copyright © 2019 Samuel Engineering, Inc. All rights reserved.
CITED REASONS FOR CAPITAL COST OVERRUNS
                                          Various Documents Have Cited Reasons for Capital Cost Overruns including the
                                          following examples:

                                          •     Poor engineering/planning/costing (studies completed by unqualified engineering firms
                                                who do not have the required knowledge/expertise by mine or process type, or by
                                                project area/location/conditions).
                                          •     Poor/inexperienced management (internal and external) during engineering,
                                                construction and Owner’s team.
                                          •     Owner’s costs during preproduction period; especially if project is delayed for
                                                permitting, and Owner is attempting to show in-house costs to Analysts, Board and
                                                Budget Committees.
                                          •     Change orders as a result of inadequate engineering/design studies and not identified
                                                during due diligence process (internal and external).
                                          •     Forecasting high labor productivity during construction, especially in skilled labor
                                                areas and countries where legislated laws specify labor requirements.
                                          •     Indirects where percentages are used versus actual engineered estimates/quotes
                                          •     Site remoteness/location
                                          •     Weather
                                          •     Exchange rate
                                          •     Inflation

Copyright © 2019 Samuel Engineering, Inc. All rights reserved.
PROJECT CHARACTERISTICS FOR CAPITAL COST OVERRUNS

                                         No or Weak Association                                                                    Strong Association
                                     • Financing (internal or                                                             • Commodity Market (hot)
                                       external)                                                                          • Integrated Design/Build
                                     • Company Size (market cap)                                                            Team
                                     • Project Size (capex/capacity)                                                      • Project Quality
                                     • Mining Method
                                     • Project Location (continent)
                                     • Primary Commodity
                                     • Processing Method
                                     • Project History (greenfield
                                       vs brownfield)
                                                                 Source: Haubrich, Christopher. “Why Building A Mine On Budget Is Rare,” CIM MES 16 October 2014.

          1/16/2020                                                                                                                                                 Mining & Minerals
                                                                                                                     18
Copyright © 2019 Samuel Engineering, Inc. All rights reserved.
COST OVERRUNS BY PERCENT
                                                                         OVERRUN AREAS                                                   PERCENT (1)
                                                                         Owner Labour                                                           58%
                                                                         Other Indirects                                                        58%
                                                                         Direct Labour                                                          50%
                                                                         Materials                                                              50%
                                                                         Escalation                                                             42%
                                                                         External                                                               42%
                                                                         EPCM Labour                                                            42%
                                                                         Equipment                                                              42%
                                                                         Delay                                                                  25%
                                                                         Foreign Exchange                                                       17%
                                                                         Scope Changes                                                          17%
                                                                     (1) Figure shown for each driver represents % of projects that
                                                                         encountered overrun for that drive.
                                                      Source: Lwin, Tin (P. Eng) and Jose Lazo, “Export Development Canada: Managing Capital Cost Overrun Risks in the mining industry,”
                                                      2017 AACE® International Technical Paper© (OWN.2657.2).

Copyright © 2019 Samuel Engineering, Inc. All rights reserved.
CAPITAL COST OVERRUNS BY SOURCE

                                                                     SOURCES OF OVERRUNS                                             NUMBER
                                                                     Scope of Changes                                                      2
                                                                     Delay                                                                 3
                                                                     Equipment                                                             5
                                                                     Material (2)                                                          6
                                                                     Labour (3)                                                            7
                                                                     External (1)                                                         12

                                                                  (1) Permitting, escalation, custom clearances, logistics and
                                                                      foreign exchange.
                                                                  (2) Bulk quantities and unit prices.
                                                                  (3) Engineering, Owner’s, camp, training, commissioning and
                                                                      construction.

                                                                 Source: Tin Lwin, Export Development Canada. ‘’Managing Mine Development Risk: Capital Cost
                                                                 Overruns,’’ Mining Business Risks Summit 2012, Toronto, Canada.

Copyright © 2019 Samuel Engineering, Inc. All rights reserved.
CASE STUDY: NEMASKA LITHIUM, INC.
                      As a case study, the Nemaska Project, Quebec, Canada, was reviewed. The Nemaska Project is comprised of the Whabouchi open pit
                      mine-process plant and Shawinigan electrochemical plant. Whabouchi will produce a spodumene concentrate from open pit and
                      underground mining using conventional processes. Spodumene concentrate will be shipped to Nemaska’s electrochemical plant at
                      Shawinigan, Quebec, for producing lithium products. The following NI 43-101 Technical Reports were completed for Nemaska starting
                      in 2014:
                      •       “NI 43-101 Technical Report; Feasibility Study on the Whabouchi Lithium Deposit and Hydromet Plant” Prepared for Nemaska
                              Lithium Inc. by Met-Chem Canada, Inc. Issue Date: June 26, 2014.
                      •       “NI 43-101 Technical Report; Feasibility Study Update on the Whabouchi Lithium Deposit and Hydromet Plant (Revised)” Prepared
                              for Nemaska Lithium Inc. by Met-Chem Division of DRA Americas Inc. Revised Date: June 8, 2016.
                      •       “NI 43-101 Technical Report -- Feasibility Study on the Whabouchi Lithium Mine and Shawinigan Electrochemical Plant” Prepared
                              for Nemaska Lithium Inc. by Met-Chem, a division of DRA Americas Inc. Issue Date: February 21, 2018.
                      •       “NI 43-101 Technical Report; Report on the Estimate to Complete for the Whabouchi Lithium Mine and Shawinigan
                              Electrochemical Plant” Prepared for Nemaska Lithium by a consortium of companies (DRA Met-Chem, SGS, Hatch, BRA, SNC-
                              Lavalin and Noram). Effective Date: May 31, 2019.

                      In February 2019, Nemaska Lithium announced in a press release that there would be a C$375 million capital cost overrun on the 2018
                      Technical Report estimate, of which C$150 million would be for the mine-process plant. Nemaska’s explanations for this overrun were
                      for: (1) new, higher estimates for indirects, and (2) lower labor productivities and higher unit costs for construction labor. On October
                      15, 2019, Nemaska Lithium announced that due to delays in financing the laying off of 64 employees, ceasing of operations at the
                      Phase 1 Plant at the end of December 2019, and slowing down of work at Whabouchi until the winterization of the site is complete.

                      This case study focuses on the capital cost estimates in the 2016-2019 studies.

Copyright © 2019 Samuel Engineering, Inc. All rights reserved.
SELECTED DATA COMPARISON: TECHNICAL REPORTS 2016-2018

                                                                                                                               Technical Reports
                                          Descriptions                                            Units               2016                          2018
                                          Open Pit Reserves                                 P & P M tonnes            20.0                          24.0
                                          Open Pit Grade                                          %Li2O               1.53                          1.53
                                          Underground Reserves                              P & P M tonnes             7.3                          12.7
                                          Underground Grade                                       %Li2O               1.28                          1.16
                                          Cut-Off Grade Open Pit                                  %Li2O               0.43                          0.34
                                          Cut-Off Grade Underground                               %Li2O               0.80                          0.63
                                          Ore Production                              Tonnes Processed/Year (000s)    1,031                         1,031
                                          LOM Ore Production                                 Million Tonnes           27.3                          36.7
                                          Li Concentrate Design                               Tonnes/Year            261,485                       215,022
                                          LOM Concentrate                                    Tonnes (000s)            5,590                         7,105
                                          Process Recovery                                         %                  83.8                          85.2
                                          Concentrate Grade                                       %Li2O                6.0                          6.25
                                          Price Li-OH                                         US$/Tonne               9,500                        14,000
                                          Price Li2CO3                                        US$/Tonne               7,000                   9,500-12,000
                                          IRR (After-Tax)                                          %                  30.3                          30.5
                                          Pay-Back (After-Tax)                                    Years                2.7                           2.9
                                          LOM Financial Model                                     Years                26                            33
                                          Sources: Nemaska Technical Reports for 2016 and 2018.

Copyright © 2019 Samuel Engineering, Inc. All rights reserved.
COMPARISON OF NEMASKA CAPITAL COSTS

                                                                 Cost Descriptions                            Capital Costs (M C$)                  % Change
                                                                 Direct Costs                        2016 TR        2018 TR   2019 Update      2016-2019    2018-2019
                                                                 Whabouchi                                154.0         158.6        264.4            71.7%      66.7%
                                                                 Shawinigan                               230.2         347.3        518.3           125.2%      49.3%
                                                                 Sub-Total Direct                         384.2         505.9        782.7           103.7%      54.7%
                                                                 Indirect Costs
                                                                 Whabouchi                                  63.3             81.8     127.4         101.3%      55.7%
                                                                 Shawinigan                                 45.6            114.3     176.6         287.3%      54.5%
                                                                 Sub-Total Indirects                       108.9            196.1     304.0         179.2%      55.0%
                                                                 Nemaska Corporate
                                                                 Whabouchi                                      0              0       27.8            NAp        NAp
                                                                 Shawinigan                                     0              0       28.3            NAp        NAp
                                                                 Sub-Total Nemaska Corp.                        0              0       56.1            NAp        NAp
                                                                 Contingency
                                                                 Whabouchi                                  21.7             29.7      18.3         -15.7%      -38.4%
                                                                 Shawinigan                                 34.5             69.7      92.3         167.5%       32.4%
                                                                 Sub-Total Contingency                      56.2             99.4     110.6          96.8%       11.3%
                                                                 Others
                                                                 Labor Cost Escalation (1)                      0               0       5.9           NAp        NAp
                                                                 Closure/Rehabilitation (2)                   3.7             2.5       9.2         148.6%     268.0%
                                                                 Sub-Total Others                               0               0      15.1           NAp        NAp
                                                                 Totals By Site
                                                                 Whabouchi                                 242.7            272.6      447.1         84.2%      64.0%
                                                                 Shawinigan                                310.3            531.3      821.4        164.7%      54.6%
                                                                 Project Totals                            553.0            803.9    1,268.5        129.4%      57.8%
                                                                 (1) Shawinigan.

                                                                 (2) Whabouchi.

                                                                 Sources: Nemaska Technical Reports: 2016, 2018 and 2019.

Copyright © 2019 Samuel Engineering, Inc. All rights reserved.
SCHEDULED CAPITAL COSTS FOR 2019-2021 (C$ MILLIONS)

                                                                 Description                                     Year
                                                                 Whabouchi Mine-Plant                  2019        2020     2021      Totals
                                                                 Mine Development                         7.7       3.9      0.0       11.6
                                                                 Infrastructure                          21.4      49.9      0.0       71.3
                                                                 Mine Equipment                           2.0       4.6      0.0         6.6
                                                                 Crushing                                 0.7       1.6      0.0         2.3
                                                                 Process Plant                           39.8      92.9      0.0      132.7
                                                                 Sub-Total Whabouchi                     71.6     152.9      0.0      224.5
                                                                 Shawinigan Plant
                                                                 Process Plant                             8.8    268.3     162.7     439.8
                                                                 Buildings                                 3.1     95.1      57.7     155.9
                                                                 Infrastructure                            2.2     66.1      40.1     108.4
                                                                 Sub-Total Shawinigan                     14.1    429.5     260.5     704.1
                                                                 Totals                                   85.7    582.4     260.5     928.6

                                                                 Excludes: Working Capital, Sunk Costs, Tailings and Sustaining. Source:
                                                                 Table 22.5 - Cash Flow Statement (Base Case); NI 43-101 Technical Report,
                                                                 Report on the Estimate to Complete for the Whabouchi Lithium Mine and
                                                                 Shawinigan Electrochemical Plant"; prepared for Nemaska Lithium, Inc.
                                                                 Effective Date: May 31, 2019

Copyright © 2019 Samuel Engineering, Inc. All rights reserved.
SUMMARY AND CONCLUSIONS
                                  The topic of capital cost overruns in the mining industry has been examined for over 50 years from the mid-1960s
                                  to now. Recent studies have shown average capital cost overruns between 25% and 60%. Major contributing
                                  factors to the capital cost overruns are under-estimation in the Feasibility Study as well as the project completion
                                  costs during project development/construction for:
                                  • Owner’s (Corporate) Costs
                                  • Contingency
                                  • Indirect Costs
                                  • Costs for external factors
                                  • Labor Costs (EPCM, engineering, management and construction)

                                  The amount of capital cost overrun appears to be a function of different variables such as project
                                  locations/execution and commodity. Available data also indicate a correlation between commodity prices and
                                  capital cost overruns, but not at the same rates.

                                  In summary, ?? Is the real answer to ask one-self ?? ?? Are capital cost overruns actually a manifestation of
                                  inadequate engineering definitions and estimates at the various study stages (PEA, PFS and FS) -- resulting in the
                                  capital cost overruns during project development schedule, plan of execution and construction ?? I think YES and
                                  NO! Most important here, the mining industry and its engineering companies/consultants have not learned from
                                  its mistakes, or made the necessary corrections to its estimating methodologies and will continue to have capital
                                  cost overruns into the future.

Copyright © 2019 Samuel Engineering, Inc. All rights reserved.
THANK YOU

www.samuelengineering.com
WHO WE ARE
                                                   Multi-Disciplinary                  200+
                                                         Team                      Professionals

                                                      Debt Free                 Average of 23+ Years
                                                                                    Experience

                                               PE's Active in all Disciplines        Privately
Samuel Engineering Headquarters – Denver, CO                                          Owned
WHAT WE DO
You can also read