Mobile app trends 2021 - A global benchmark of app performance - Storyblok
←
→
Page content transcription
If your browser does not render page correctly, please read the page content below
Mobile app
trends 2021
A global benchmark of
app performance

Mobile app trends 2021                                                                                                                                                                  2

       Contents
       Introduction...................................................................................................................................................3
             The verticals....................................................................................................................................................4
             Fintech...............................................................................................................................................................4
             Gaming..............................................................................................................................................................6
             E-commerce....................................................................................................................................................8

       Top 3 takeaways..................................................................................................................................... 10

       Methodology............................................................................................................................................... 11

       Installs................................................................................................................................................................ 12
             Fintech.............................................................................................................................................................14
             Gaming (non-hyper casual and hyper casual).................................................................................15
             E-commerce..................................................................................................................................................16
             Key Findings..................................................................................................................................................16
             Paid vs. organic.............................................................................................................................................18
             eCPI..................................................................................................................................................................19
             Number of partners per account.........................................................................................................20

       Sessions and in-app patterns.................................................................................................... 21
             Sessions........................................................................................................................................................... 21
                 Fintech....................................................................................................................................................... 22
                 Gaming...................................................................................................................................................... 23
                 E-commerce............................................................................................................................................ 24
             Sessions per user per day........................................................................................................................25
             Average session length............................................................................................................................ 27
             Time spent in-app...................................................................................................................................... 28
             Key findings ................................................................................................................................................. 29

       Retention and reattribution....................................................................................................... 31
             Retention rates............................................................................................................................................. 31
             Reattributions share.................................................................................................................................. 33

       Conclusion...................................................................................................................................................34
Mobile app trends 2021                                                                           3

       Introduction
       The way we use apps evolved in 2020, with more users turning to digital solutions for
       entertainment and daily tasks than ever before. As lockdowns were introduced across
       the globe, users downloaded and opened apps at rates that eclipsed previous years
       and projections. Global spend on mobile apps hit USD $112 billion in 2020 — and iOS
       represented 65% of that spend. While growth is continuing into 2021, mobile marketing
       is going through a seismic evolution as iOS 14 is set to be the next industry-defining
       moment. For app developers and marketers, this year will once again look very different
       from the one that preceded it.

       Our report draws on internal data and industry-wide insights to help marketers and
       developers better understand their audiences through actionable data.

       “The app economy experienced immense growth in 2020 as people all
         over the world realized the benefits of mobile in many aspects of their lives.
         For mobile marketers, the potential to reach new users is at an all-time high,
         but so is competition. As we move through 2021 and begin a new era with
         iOS 14, the importance of enhancing marketing through automation and
         understanding how users behave in-app throughout their entire journey is
         more pivotal than ever,”

                          Paul H. Müller,
                          Co-Founder and CEO
Mobile app trends 2021                                                                                        4

       The verticals

       In this report, we drill down into fintech, e-commerce and gaming, placing a focus on everything
       from trends in installs and sessions, to how much time users are spending in apps, how often they’re
       reinstalling and how they’re being reattributed.

       Fintech:

       Fintech continued its march into mobile in 2020 as more legacy banks partnered with
       fintechs and more users adopted neobanks.
Mobile app trends 2021                                                                                                        5

                     Banking app revenue reached                               By mid-2020, 25% 2 of all banking app
                              USD $3.6 billion                                 downloads were digital banks, up from
                                                                                               1% in 2017.

                                                    The average user now has 2.5 finance apps installed, and global
                                                    payments reached USD $1.390 billion in 2020 and are projected
                                                    to reach USD $1.680 billion this year 1.

                                                    Adoption rates for mobile payments surged globally, with China
                                                    reaching as high as 81.1% — followed by India at 37.6%, Japan at 25.3%
                                                    and Italy at 21.1%. France and Germany continue to show potential, with
                                                    adoption rates growing but still hovering around 20%.

       1
            https://www.businessofapps.com/data/fintech-app-market/
       2
           https://go.sensortower.com/state-of-fintech-apps-report-2020.html
Mobile app trends 2021                                                                                                          6

       Gaming:

       For the purpose of this report, we’ve split gaming into hyper casual and
       non-hyper casual, as the two have continued their extremely different
       trajectories in terms of user behavior.

       Gaming held onto its crown as the biggest mobile vertical, with 33% 3 of all
       downloaded mobile apps now games.

       3
           https://techcrunch.com/2019/06/11/mobile-games-now-account-for-33-of-installs-10-of-time-and-74-of-consumer-spend/
Mobile app trends 2021 7
The mobile gaming industry was valued at Asia is still the biggest marketplace, making up
USD $165 billion in 2020, and with increased USD $41 billion of the total value. The number
projected growth is predicted to hit of mobile gamers grew from 1.2 billion to 1.75
USD $180 4 billion in 2020. billion, marking an increase of 46% 5.
Of these gamers, 620 million are in China, 213 Of the total global gaming industry, mobile
million are in the U.S., and 38% are willing to pay games now make up 51% 6 of revenue with hyper
for the games. casual projected to hit the USD $2.5 billion mark
in 2021 7.
The overall vertical has a market forecast of USD $219.9 billion by
2023, with Google Play revenue continuing to increase faster than
App Store revenue, at a rate of 19.6% to 13.2% 8.
4
https://www.blog.udonis.co/mobile-marketing/mobile-games/mobile-gaming-statistics
5
https://www.is.com/blog/resources/mobile-gaming-trends
6
https://www.statista.com/topics/1906/mobile-gaming/
7
https://www.pocketgamer.biz/news/75766/pgc-digital-hypercasual-market-estimated-to-reach-25-billion-from-2021/
8
https://www.is.com/community/blog/resources/mobile-gaming-trends/Mobile app trends 2021 8
E-commerce:
With a 58% 9 increase in in-app transactions from 2019 to 2020 and years of growth
trumped in Q1 of 2020 10 following the introduction of lockdowns, e-commerce also
reported its biggest year ever.
9
https://www.enterprisetimes.co.uk/2020/11/10/retailers-see-increase-in-mobile-app-downloads-and-growth-in-in-app-purchases/
10
https://www.shopify.com/enterprise/the-future-of-ecommerce/omnichannelMobile app trends 2021 9
Overall e-commerce penetration in the U.S. Convenience and seamless cross-device
boomed from around 12% in 2019 to almost 40% experiences are the two user priorities, with
in 2020, and is set to reach 50.8% in 2021 and 76% 12 reporting that ease-of-use is their main
63.1% by 2025, with the average revenue per focus when choosing an app.
user expected to amount to USD $714.11 . 11
It was also reported that goods bought online in 2020
grew by 24% while store-based purchases declined 7%.
By the end of 2021, 17% of global purchases will take place online.
Combine this with Adjust data 13, which shows that engagement rates
increased by 40% in shopping apps and the picture of the boom in
e-commerce becomes clear.
11
https://www.statista.com/outlook/dmo/ecommerce/worldwide
12
https://www.linnworks.com/the-effortless-economy
13
https://www.adjust.com/blog/mobile-shopping-apps-report-2020-announcement/Mobile app trends 2021 10
Top 3 takeaways
Mobile growth has continued strongly into 2021,
1 with installs up 31%.
Hyper casual games need to get the maximum revenue
2 per user in the first two days, as retention rates slip
heavily after that.
E-commerce installs only increased by 6% in 2020,
3 but sessions saw a growth of 44%, showing how
engaged users became.
“Across the gaming, fintech and e-commerce verticals, 2020 drove home
the importance of balancing user acquisition with reengagement. Swathes
of users turned to apps, making it the perfect time to acquire those seeking
solutions on mobile for the first time, but encouraging users to return and
stay engaged is also vital. Many marketers achieved this by creating
engaging ad experiences and optimizing with a data-first approach.”
Dennis Mink,
SVP of MarketingMobile app trends 2021 11
Methodology
Verticals:
Fintech
Gaming - hyper casual & non-hyper casual
E-commerce
Dataset:
A mix of Adjust’s top 2,000 apps and the total dataset of all
apps tracked by Adjust. Our data comes from two sources,
one including a list of 45 countries and one with approximately
~250 based on the ISO 3166-1 standard.
Date:
01.01.2019 - 14.03.2021Mobile app trends 2021 12
Installs
Across all verticals, we see a 50% increase in installs comparing 2019 to 2020. In March
and April 2020, around the time that the first lockdowns were coming into place globally,
installs were particularly impressive, performing at 74% and 76% higher than 2019 YoY.
While installs trended down following this peak, growth is continuing into 2021, with the
first quarter up 31% compared to the same time frame in 2020.
Installs all verticals 2019 vs. 2020
2020
2019
ar
y ry h ril ay ne ly s t er
be
r e r er
nu ua arc Ap M Ju Ju gu mb to mb mb
br M Au te ve ce
Ja Fe e p Oc o e
S N DMobile app trends 2021 13
“The pandemic has illuminated the power of visual communication to connect
us when apart. From sending pictures to experiencing the world through
augmented reality, the Snapchat Generation enjoys new ways of engaging
with friends and brands alike. They are a new kind of shopper, one excited for
native, social and immersive brand experiences from the palm of their hand.”
Skye Featherstone,
Global Product Marketing ManagerMobile app trends 2021 14
Fintech
Installs for fintech apps increased 51% from 2019 to 2020 and are up again by 12% at
the beginning of 2021, compared to the 2020 average. March and April 2020 were the
highest performing months, starting in the first week of March at 34% above the yearly
average and peaking in the first week of April at 41% up. Another spike took place in the
first week of July at 19% above average.
Installs fintech 2020
ar
y ry h ril ay ne ly s t er
be
r e r er
nu ua arc Ap M Ju Ju gu mb to mb mb
br M Au te ve ce
Ja Fe e p Oc o e
S N D
Investing and stock-related app searches have grown 115% YoY 14. Robinhood set off
the trading apps wave, with new challengers setting their commissions and fees lower
to compete. Other tops apps are Cash App, Revolut, Gatsby, Coinbase, Binance, Kraken,
eToro and Freetrade, all of which enjoyed record growth of new customers in 2020 15.
Cryptocurrencies saw unprecedented trading, with Bitcoin hitting several big milestones
in the past 12 months, breaking the $30,000 barrier on January 2 and then $40,000 just
10 days later 16. This was combined with a surge in crypto app downloads, with 81% growth
YoY. With innovations such as non-fungible tokens (NFTs) also driving the market 17,
there is a lot of excitement in the crypto-app ecosystem.
14
https://www.thinkwithgoogle.com/consumer-insights/consumer-trends/search-statistics-for-investing-stock-apps/
15
https://tradingplatforms.com/blog/2021/02/03/trading-platforms-enjoy-record-growth-of-customers-in-2020/
16
https://www.forbes.com/sites/cbovaird/2021/01/14/bitcoin-has-climbed-above-40000-again-whats-next/
17
https://www.businesswire.com/news/home/20210305005012/en/S%21NG-Launches-Free-NFT-ready-App-for-CreatorsMobile app trends 2021 15
Gaming (non-hyper casual and hyper casual)
Non-hyper casual games increased by 26%, while hyper casual saw a 43% uptick in
installs from 2019 to 2020. The best performing period for non-hyper casual in 2020
was the last week of March and first week of April, which was 51% above the yearly
average and 90% higher than the 2019 average. The number of installs decreased
slowly throughout 2020 but started to pick up again in December.
For hyper casual games, the beginning of 2020 saw exponential growth, peaking at the
end of February at 129% above the yearly average. This drops down throughout March
and remains steady for the rest of the year. If we remove the massive growth seen in the
first quarter of 2020, hyper casual still performs slightly higher than in 2019, and starts
trending up again in 2021.
Installs gaming (non-hyper casual) 2020
ar
y ry h ril ay ne ly s t er
be
r
be
r
be
r
nu ua arc Ap M Ju Ju gu mb to
br M Au te em em
Ja Fe e p Oc ov ec
S N D
Installs gaming (hyper casual) 2020
ar
y ry h ril ay ne ly s t e r
be
r
be
r
be
r
nu ua arc Ap M Ju Ju gu mb to
br M Au te em em
Ja Fe e p Oc ov ec
S N DMobile app trends 2021 16
E-commerce
E-commerce performed exceptionally well in 2020, despite installs only increasing by 6%
compared to 2019. Sessions and engagement is where we see the huge uptick happen,
which we explain in detail below. In contrast to 2019 where installs grew steadily, 2020
showed ups and downs, with a trough in the last week of March at 10% below the yearly
average. Things start to pick up throughout May and into the beginning of July, with
those months combining to be 10% above average. The biggest growth period starts in
the second week of November, at 19% above the yearly average, and decreases over the
remainder of the year, suggesting a pre holiday season rush. 2021 is looking strong so far,
with the first quarter 11% above the 2020 average.
Installs e-commerce 2020
ar
y ry h ril ay ne ly s t er
be
r e r er
nu ua arc Ap M Ju Ju gu mb to mb mb
br M Au te ve ce
Ja Fe e p Oc o e
S N D
KEY FINDINGS
• Installs increased across all verticals, with fintech posting the best YoY growth of 51%.
• Gaming reached new heights in 2020, particularly in hyper casual, where installs
increased 43% — compared to 26% for non-hyper casual.
• E-commerce’s install growth was relatively small at 6%, but performed consistently
throughout the year, not showing the huge peaks and falls of many other verticals as
shops were closed for most of the year, and people consistently made online purchases.Mobile app trends 2021 17
“2020 was a game-changing year for the mobile app economy,
which highlighted the importance of multi-channel campaigns more
than ever. More users were turning to mobile but the competition
was strong. It continues that the better tailored and adapted campaigns
are for users, based on specific channels, the better performance marketers
and developers see when it comes to installs, sessions and gaining high
LTV users.”
Momchil Kyurkchiev, Co-Founder
and Chief Product OfficerMobile app trends 2021 18
Paid vs. organic
The highest overall share of paid installs took place in Q1 and Q3 of 2020, where there
were 0.45 paid installs for every organic. It remains relatively consistent throughout the
year, however, with the 0.39 in Q2 the lowest point. Hyper casual has the highest ratio of
paid installs to organic installs, reaching 3.17 by Q4, a massive difference to the 0.69 that
the overall gaming vertical posted in the same quarter.
There are also large differences to note within the e-commerce vertical. Shopping
had its largest share of paid installs in Q1 at 0.85. In the same quarter, marketplace and
classifieds came in significantly lower at 0.32. Fintech has a comparably low share of
paid installs, with payment slightly higher than banking, hovering from 0.1 to 0.13 and
0.8 to 0.2, respectively.
Paid / organic ratio 2020
Q1 Q2 Q3 Q4
Marketplace
Shopping
Gaming
Hyper casual
Banking
Payment
All verticals
Number of paid installs for every organic installMobile app trends 2021 19
Effective cost per install (eCPI)
Q4 was the most expensive quarter to acquire users overall at a median of $1.88 per
install. E-commerce came in at $1.56 — up from $1.06 in Q1. Fintech on the other hand,
had its most expensive period in Q1 at $1.57, and dropped as low as $0.53 in Q2. Hyper
casual is very low while gaming overall is comparatively high. Q4 was hyper casual’s
cheapest at $0.27 per install while gaming came in at $2.52, its most expensive quarter
by contrast.
Effective cost per install by quarter in USD
Q1 Q2 Q3 Q4
3
2.5
2
1.5
1
0.5
0
All verticals E-commerce Games Hyper casual FintechMobile app trends 2021 20
Number of partners per app
The median number of partners per app hovers at around five for all verticals combined,
increasing to six in Q4 of 2020. Games is above the median of the other verticals at seven
overall, with hyper casual even higher, at nine. The median e-commerce app works with
four while fintech comes in lowest, with three. This shows a huge opportunity for the
e-commerce and fintech verticals to diversify the number of partners they work with to
potentially find their next pocket of new users.
Number of partners per app 2020
10
9
8
7
6
5
4
3
2
1
0
All verticals E-commerce Games Hyper casual FintechMobile app trends 2021 21
Sessions and in-app patterns
“All verticals are surging as consumers shift their focus and time to digital
touchpoints. The marketing teams that can make sense of this explosion
in behavioral data, and rapidly turn insights into improved, personalized
experiences, will win. Sometimes taking action will involve building, but more
often than not action will involve using machine learning to automatically
adapt experiences. It is a game of increasing customer loyalty and increasing
customer LTV. The funnel has flipped.”
John Cutler,
Head of Product Education
Sessions
Sessions increased by 30% overall from 2019 to 2020, and are continuing to grow in 2021,
up by another 4.5% so far. April 2020 was the highest performing month, enjoying a
45% YoY increase, with May almost as impressive, at 40%. May was the best-performing
month of 2020 overall, however, posting 9% more sessions than the yearly average.
Sessions all verticals 2019 vs. 2020
2020
2019
ar
y ry h ril ay ne ly s t er
be
r e r er
nu ua arc Ap M Ju Ju gu mb to mb mb
br M Au te ve ce
Ja Fe e p Oc o e
S N DMobile app trends 2021 22
Fintech
Fintech sessions boomed in 2020, increasing 85% compared to 2019, and is already
up 35% in 2021. Sessions grew steadily throughout 2020, with the biggest weeks at
the beginning of October (22% above average) and the end of November (24% above
average). Another peak took place in the first week of July, which was up 15%.
Sessions fintech 2020
ar
y ry h ril ay ne ly s t er
be
r e r er
nu ua arc Ap M Ju Ju gu mb to mb mb
br M Au te ve ce
Ja Fe e p Oc o e
S N DMobile app trends 2021 23
Gaming
Sessions for non-hyper casual games increased by 27% from 2019 to 2020, picking up
in the second week of March. It peaked in the last week of April at 22% above the yearly
average and stayed high until mid-June. Sessions for 2021 are currently 9% below 2020
but up 4% if we only compare with the last quarter of 2020. If we look at the end of
February and beginning of March, the vertical is starting to perform similarly to 2020 —
even 1.5% higher.
Hyper casual sessions increased 36% when comparing 2019 to 2020. The 2020
sessions-boom started at the end of January, peaking in mid-March at 72% above
the yearly average. The entire end of January to May combined is 49% up. Sessions
for 2021 are down 21% so far, but if we remove the huge “first-lockdown” spike, the
performance is roughly the same. But sessions within 2021 are growing steadily,
with February outperforming January by 47%.
Sessions gaming (non-hyper casual) 2020
ar
y ry h ril ay ne ly s t e r
be
r e r e r
nu ua arc Ap M Ju Ju gu mb to mb mb
br M Au te ve ce
Ja Fe e p Oc o e
S N D
Sessions gaming (hyper casual) 2020
ar
y ry h ril ay ne ly s t er
be
r e r er
nu ua arc Ap M Ju Ju gu mb to mb mb
br M Au te ve ce
Ja Fe e p Oc o e
S N DMobile app trends 2021 24
E-commerce
Considering that e-commerce installs only increased 6% between 2019 and 2020,
the 44% surge in sessions is remarkable. They increased gradually throughout the
year, except for a dip in March at 17% below the yearly average. Q4 was the strongest
performing time frame, up 18% at the end of November. 2021 is off to a very strong
start — 14% above the 2020 average so far — and the vertical’s highest weeks ever
took place at the end of February and beginning of March — up 23% compared to
2020 and 76% compared to 2019.
Sessions e-commerce 2020
y ry h ril ay ly t r r r r
ar arc ne Ju
s e be e e
nu br
ua Ap M Ju gu mb to mb mb
Ja Fe
M Au pte Oc ove e ce
S e N D
“Many app marketers and developers have realized the need for program-
matic advertising as a pivotal part of their strategy - which has helped drive
the industry-wide increase of installs and sessions we’ve seen over the last 18
months. Mobile is growing, which is exciting, and that growth is being driven
by empowering those in the industry to unlock incremental growth through
UA and retargeting.”
Tomas Yacachury,
Head of PartnershipsMobile app trends 2021 25
Sessions per user per day
Combined with the huge increase of sessions and installs in 2020, users were also highly
active in-app. We saw an impressive number of sessions per user per day, which hovered
around two a day for users in a 30 day cohort.
Sessions per active user per day 2020
Q1 Q2 Q3 Q4
2.4
2.2
2
1.8
1.6
1.4
1.2
1
0 1 2 3 4 5 6 7 8 9 10 11 12 13 14 15 16 17 18 19 20 21 22 23 24 25 26 27 28 29 30
Day after install
Q1 and Q4 were the strongest for day 0 (or the day the app is installed) across all verticals,
with the median user logging 1.9 sessions per day. The median session per user on day
3 and day 7 sessions grew throughout the year, also reaching their highest point in Q4,
at 2.1 sessions per day. Median sessions per user on day 30 also trended upward in Q4,
reaching 2.14 sessions per user per day.
The most significant thing to pay attention to is the stark difference between hyper
casual and gaming as a whole. Hyper casual starts out strong, with the median user
logging 1.9 sessions per day, not far below other verticals. However, this dips to 1.3 by
day 30 — a much sharper decline than seen elsewhere. The other gaming verticals start
with the median user logging around 2 sessions per day and landing on 2.2 by day 30.Mobile app trends 2021 26
Sessions per active user per day (gaming)
Q1 Q2 Q3 Q4
2.6
2.4
2.2
2
1.8
1.6
1.4
1.2
1
0 1 2 3 4 5 6 7 8 9 10 11 12 13 14 15 16 17 18 19 20 21 22 23 24 25 26 27 28 29 30
Day after install
Sessions per active user per day (hyper casual gaming)
Q1 Q2 Q3 Q4
2.5
2
1.5
1
0.5
0
0 1 2 3 4 5 6 7 8 9 10 11 12 13 14 15 16 17 18 19 20 21 22 23 24 25 26 27 28 29 30
Day after installMobile app trends 2021 27
Average session length
Likely the result of spending more time at home, users in 2020 had longer sessions
than in 2019, and spent more time in-app overall, though how we measure the success
of the latter varies greatly depending on the vertical. Gaming posts longer session
lengths because it’s based on entertainment, whereas banking and payment apps
may only be needed for a few seconds to fulfil a requirement.
Session lengths overall grew from 19.09 minutes in 2019 to 20.04 in 2020, and is up
to 20.31 in 2021 so far. All verticals grew from 2019 to 2020, with only payment
dropping slightly. Casual gaming and sports gaming post the highest session lengths
at 21.19 and 22.77 minutes each. Hyper casual sits at 18.78 in 2020, below average but
up considerably when compared to its own 2019 performance of 14.95 minutes per
session. Overall, users spend 42% more time on casual games than on hyper casual.
Average session length
2019 2020
Marketplace
& classifieds
Shopping
Hyper casual
gaming
Sports games
Casual gaming
Payment
Banking
All verticals
0 5 10 15 20 25
Minutes spent in app per sessionMobile app trends 2021 28
Time spent in-app
Between day 0 and day 1, the time spent in-app overall roughly doubles when looking at
all verticals, increasing from around 10 to 20 minutes for every 24 hour period. By day 3
it creeps back down to 17, hits 16 on day 7 and settles at 14 by day 30. In 2020, the median
user spent the most time in-app in Q4. Following the same pattern, we see that day 0 - 1
climbs from 13 to 27 minutes, day 3 is 25 minutes, day 7 is 23 and day 30 is 22.
The median numbers for the gaming vertical are much higher than in the comparison
verticals, with the day 0, 1, 3, 7, 30 pattern performing at 24, 53, 48, 47 and 45 minutes
in Q4.
Time spent in-app (all verticals)
25
20
15
Minutes
10
5
0
0 1 2 3 4 5 6 7 8 9 10 11 12 13 14 15 16 17 18 19 20 21 22 23 24 25 26 27 28 29 30
Day after install
Hyper casual is a completely different story, dipping down significantly faster. Q4 day 0
is 8, day 1 is 15, day 7 is 9 and day 30 is 7. E-commerce also differs from the norm and is
below the comparison verticals, with Q2 the best performing period of the year, following
a 6, 13, 10, 10, 30 pattern. Fintech performs roughly the same throughout the year, with
day 0 and 30 very similar. In Q4, the pattern gives us 3, 5, 4, 3.5, 3, making it the only
vertical to finish exactly where it starts.Mobile app trends 2021 29
Median time spent in app by vertical Q4
Vertical Day 0 Day 1 Day 3 Day 7 Day 30
All Verticals 10 20 17 16 14
Gaming 24 53 48 47 45
Hyper casual 8 15 11 9 7
E-commerce 6 13 10 10 30
Fintech 3 5 4 3.5 3
KEY FINDINGS
• The average session length remained consistent in terms of verticals from 2019 to
2020, but all verticals grew.
• The difference in the way hyper casual games, and gaming as a whole, perform shows
how important it is to approach these as separate verticals.
• Fintech sessions increased 85%, representing a significant move towards digital
banking and payments in 2020.
• E-commerce sessions are up 44% compared to installs at only 6%, indicating that users
familiar with the vertical are more active than ever.Mobile app trends 2021 30
“During lockdown, people’s way of living, working, and playing moved
from the real world to the digital world, particularly to mobile in-app.
Today, app developers are challenged with finding new ways to reach,
acquire, and monetize these valuable users. Unique ad creative that
melds with the user experience becomes even more important to grab
user attention.”
Kevin Albano, Sr. Manager,
Partnership DevelopmentMobile app trends 2021 31
Retention, reattribution and
returning users
Retention rates
Retention rates were very stable throughout the year, with Q4 performing slightly
better than the previous three quarters. This shows how robust the industry remained,
succeeding in hanging onto the huge new swathes of users that came as a result of
lockdowns. Day 1 hit its peak at 28% while day 7 reached 15%. Day 30 retention rates
for Q4 were just over 8% — up from a low of just under 6% in Q3.
Retention rates all verticals 2020
Q1 Q2 Q3 Q4
100%
90%
80%
70%
60%
50%
40%
30%
20%
10%
0%
0 1 2 3 4 5 6 7 8 9 10 11 12 13 14 15 16 17 18 19 20 21 22 23 24 25 26 27 28 29 30
Day after installMobile app trends 2021 32
Putting a lens on Q4, the best performing quarter of the year, for the purpose of
comparing verticals, we see that games retain best on day 1 at roughly 30%, closely
followed by hyper casual at 27%. Hyper casual drops sharply from day 3, with just 7.5%
of users returning by day 7 (compared to a median rate of 15.2% for all verticals). The
hyper casual vertical is characterized by lower retention rates, in part due to the simple
game mechanics, and the “snowball effect” 18 hyper casual developers employ to funnel
users into the next game in their portfolio. By day 30, retention rates hover at just 1.75%.
Fintech apps on the other hand, come out on top with the highest amount of returning
users: 18% on day 7 and 12% on day 30. E-commerce apps also retain well, with 13% on day
7 and 8% on day 30, so even though installs only increased by 6%, the users that came in
were high quality.
Retention rates by vertical Q4 2020
All verticals Games Hyper casual games E-commerce Fintech
100%
90%
80%
70%
60%
50%
40%
30%
20%
10%
0%
0 1 2 3 4 5 6 7 8 9 10 11 12 13 14 15 16 17 18 19 20 21 22 23 24 25 26 27 28 29 30
Day after install
18
https://indvstrvs.com/adjust-shares-hyper-casual-gaming-tips-for-app-developers/Mobile app trends 2021 33
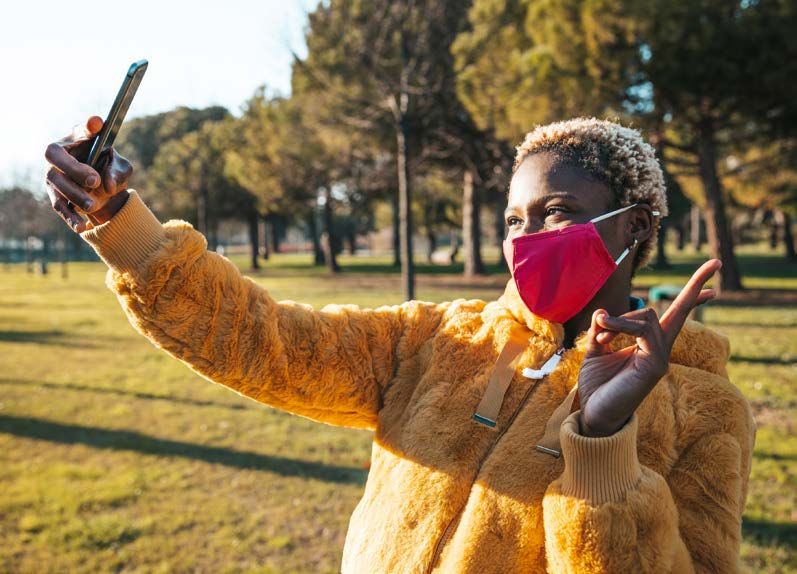
Reattributions share
Overall, the reattributions share, or number of reattributions for every install, increased
throughout 2020, starting at 0.06 in Q1, reaching 0.077 in Q3 and settling at 0.072 in Q4.
Reattributions share averages 2020
Q1
Q2
Q3
Q4
0 0.01 0.02 0.03 0.04 0.05 0.06 0.07 0.08
Number of reattributions for every install
Banking and e-commerce had very high reattributions shares comparatively. Banking
peaked at 0.83 in Q1 and decreased slowly throughout the year. E-commerce hit its
highest point in Q3 at 1.22, while payments stuck at around 0.03 throughout the entire
year, until increasing to 0.055 in Q4. Gaming’s lowest period was Q2, at 0.02, with Q4
the highest at 0.074. Hyper casual posted the lowest share of all verticals, but did climb
to 0.04 in Q3.
Reattributions share by vertical 2020
Q1 Q2 Q3 Q4
E-commerce
Hyper casual
gaming
Gaming
Payment
Banking
0 0.2 0.4 0.6 0.8 1 1.2 1.4
Number of reattributions for every installMobile app trends 2021 34
Conclusion
Understanding the nuances of a vertical is the key to successfully marketing an app
within it. Looking at the stark differences between gaming and hyper casual gaming is
one way to frame this, but the subtle differences within a vertical can also be capitalized
on to yield impressive results. It’s not just installs and sessions that marketers and
developers should focus on, it’s how users are behaving in-app, when they’re returning
and why.
By drilling down into your retention rates, you can troubleshoot onboarding issues,
work out if you’re providing enough content to keep users engaged and test the
success of introductory offers or specials.
Your break even point can also differ. Depending on your risk profile, you can float
different amounts while you wait for the LTV of your acquired users to start returning
on your investment. By tracking eCPIs, you can project how long it will take for a user to
turn profitable, and figure out where you want to invest — and how much you want to risk.
More consumers than ever are using apps as their source of entertainment and to
complete daily tasks. To be competitive, you have to be smart, data-driven and UX-
focused, and as the entire mobile ecosystem grows, so does competition.
With iOS 14 set to further emphasize the importance of A/B testing and deep user
understanding, having a well-rounded strategy incorporating highly personalized
campaigns and communication, automation and real-time measurement is more
critical than ever before.ABOUT ADJUS T Adjust is a global app marketing analytics platform committed to ensuring the highest privacy and performance standards. Adjust's solutions include attribution and measurement, fraud prevention, cybersecurity, as well as automation tools. The company's mission is to make mobile marketing simpler, smarter and more secure for the more than 50,000 apps working with Adjust. Want to learn how we can help you? Contact us now to find out how we can fit your specific use case. www.adjust.com adjust.com @adjustcom
You can also read