Mobile Phone Location Data for Disasters: A Review from Natural Hazards and Epidemics
←
→
Page content transcription
If your browser does not render page correctly, please read the page content below
Mobile Phone Location Data for Disasters: A Review
                                                 from Natural Hazards and Epidemics
                                                 Takahiro Yabe1 , Nicholas K. W. Jones2 , P. Suresh C. Rao1,3 , Marta C. Gonzalez4,5 , and
                                                 Satish V. Ukkusuri1,*
                                                 1 LylesSchool of Civil Engineering, Purdue University, 550 Stadium Mall Avenue, West Lafayette, Indiana 47907
                                                 USA
                                                 2 Global Facility for Disaster Reduction and Recovery, The World Bank, 1818 H Street, N.W. Washington, DC 20433
arXiv:2108.02849v1 [physics.soc-ph] 5 Aug 2021

                                                 USA
                                                 3 Department of Agronomy, Purdue University, 550 Stadium Mall Avenue, West Lafayette, Indiana 47907 USA
                                                 4 Department of Civil and Environmental Engineering, UC Berkeley, 760 Davis Hall, University of California,

                                                 Berkeley, California 94720, USA
                                                 5 Department of City and Regional Planning, UC Berkeley, 228 Bauer Wurster Hall, Berkeley, California 94720, USA
                                                 * sukkusur@purdue.edu

                                                 ABSTRACT

                                                 Rapid urbanization and climate change trends are intertwined with complex interactions of various social, economic, and
                                                 political factors. The increased trends of disaster risks have recently caused numerous events, ranging from unprecedented
                                                 category 5 hurricanes in the Atlantic Ocean to the COVID-19 pandemic. While regions around the world face urgent demands
                                                 to prepare for, respond to, and to recover from such disasters, large-scale location data collected from mobile phone devices
                                                 have opened up novel approaches to tackle these challenges. Mobile phone location data have enabled us to observe, estimate,
                                                 and model human mobility dynamics at an unprecedented spatio-temporal granularity and scale. The COVID-19 pandemic has
                                                 spurred the use of mobile phone location data for pandemic and disaster response. However, there is a lack of a comprehensive
                                                 review that synthesizes the last decade of work leveraging mobile phone location data and case studies of natural hazards and
                                                 epidemics. We address this gap by summarizing the existing work, and pointing promising areas and future challenges for
                                                 using data to support disaster response and recovery.

                                                     With population growth in many of the developing countries and concentration of resources and opportunities in urban
                                                 areas, many cities around the world are experiencing rapid urbanization. The United Nations, Department of Economic and
                                                 Social Affairs (UN DESA) estimates that by 2050, 68% of the people in the world is projected to be living in cities, compared
                                                 to 55% in 20181 . In addition to rapid urbanization, continued anthropogenic emissions of greenhouse gases will cause further
                                                 changes in the climate system, increasing the likelihood of severe and pervasive climate related hazards, including hurricanes,
                                                 tropical cyclones, river floods, heat waves, and droughts2 . Taken together, rapid urbanization and climate change, combined
                                                 with complex interactions of various social, economic, and political factors, have increased and could further increase the risks
                                                 of disasters across the globe. For example, urbanization could lead to more population living in vulnerable locations to hazards,
                                                 and more frequent disasters could widen the economic gap due to disproportionate impacts, which could then lead to political
                                                 divide and instability. A “disaster” is a condition or event that leads to an unstable and dangerous situation for human society,
                                                 and covers a wide range of shocks, including climate related hazards such as hurricanes, non-climate related natural hazards
                                                 such as earthquakes and epidemics including COVID-19. Regions around the world need to urgently prepare for, respond to,
                                                 and to recovery from these multitude of disasters for sustainable development.
                                                     The pervasiveness of mobile devices (mobile phones, smartphones) across the globe has opened up massive opportunities to
                                                 collect large-scale location data from individual users at an unprecedented scale compared to previous approaches (see Figure 1
                                                 for number of publications on human mobility and mobile phone data). Human mobility (for a review, see Barbosa et al.3 ) is
                                                 a critical component to understanding various disaster events. Large scale natural hazards cause severe damage to housing
                                                 structures and infrastructure systems, triggering mass evacuation, displacement, and migration from affected areas. For agencies
                                                 who aim to aid those who fled their homes with essential services and supplies, locations of such movement destinations
                                                 serve as crucial input information. Infectious diseases are by definition, transmitted between humans. Understanding the
                                                 inter-regional mobility flows could assist epidemiologists predict the outbreak of the disease. Mobile phone location data are
                                                 pertinent for responding to and recovering from such disaster events.
                                                     Prior to the availability of mobile phone location data, household surveys have been the primary source of information on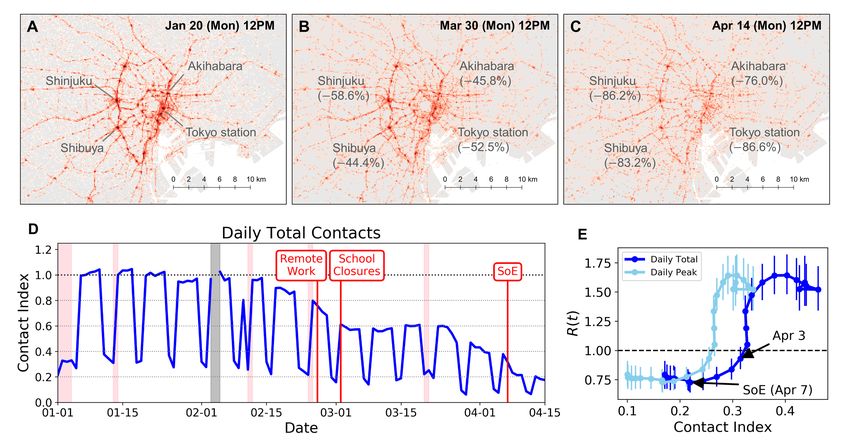
Figure 1. Number of research articles returned by searching “human mobility” and “mobile phone” in Google Scholar by year.
Research has substantially increased over the years and was further spurred in 2020 due to the COVID-19 pandemic. The count
for 2021 was computed on July 12th, 2021.

understanding human mobility. Household surveys, compared to mobile phone location data, are advantageous in collecting
detailed information about respondents’ socio-demographic and economic characteristics, and knowing the reasoning of why
the respondents behaved in a certain manner. Mobile phone location data, despite its drawbacks in data governance and quality
uncertainties (discussed in Section in detail), is able to provide us with location information of a massive number of samples
(often millions), a rapid manner (minimum a few days; e.g.,4 ), at a high frequency (e.g., around 50 data points each day),
longitudinal time frame (e.g., 6 months before and after the disaster event5 ), and high spatial granularity (∼100 meters in spatial
error). More recently, the coronavirus disease (COVID-19) pandemic has spurred and accelerated the use of mobile phone
location data for pandemic disaster response6 . The attention and interest towards mobile phone location data from government
agencies, researchers, and the public, has never been higher.
    Despite such interest in the analysis of mobile phone location data for disaster management, currently we lack a compre-
hensive review of literature that synthesizes the progress that has been made in the past decade. Cinnamon et al.7 reviews the
progress using mobile phone call detail record (CDR) data. Yu et al.8 and Akter et al.9 review the usage and applications of
various types of novel big data, including social media data and satellite image data. Wang et al.10 reviews the usage of various
mobile phone location data (including smartphone GPS data), and is the most recent and closest to our review. However, with
the spread of COVID-19, more types of mobile phone location data has become increasingly available in research. Pressing
social and technical issues around mobile phone location data, including the opaqueness of the data generative process and data
governance, comparisons between different types of data (e.g., CDR vs GPS from location intelligence firms vs GPS from
major tech firms), applications in COVID-19 response, and recent progress in collaborations between academia, government
agencies, and the industry, are important topics that need to be reviewed for further progress in this area.
    The increasing use of mobile phone location data in disaster management and social good, recently spurred by global
efforts in COVID-19 response, has highlighted the usefulness of these datasets for assisting response and recovery6 . However,
at the same time, concerns about personal privacy, data governance, and potential malicious uses of mobile phone location
data have been raised as well11 . To organize and understand what can be achieved using mobile phone location data for
disaster management, and also its limitations, as well as methodological, societal, and data-related issues, this article conducts
a comprehensive and interdisciplinary literature review on efforts that have used mobile phone location data for disaster
management. This review will not cover, however, the other types of data that are more frequently being used in disaster
management, including social media data (for a review, see e.g., Muniz et al.12 , Kryvasheyeu et al.13 ) and satellite imagery
data (for a review, see e.g.,14 ). In Section 2, we review the typology of mobile phone location data, Section 3 covers the
scientific progress, applications, and case studies in natural hazards and epidemics. Section 4 and 5 discusses and concludes
with opportunities and future challenges of using mobile phone location data for disaster response and recovery.

Types of Mobile Phone Location Data
Mobile phone location data can be classified into three main categories: mobile phone call detail records (CDR), smartphone
GPS location data collected by location intelligence companies, and smartphone GPS location data collected and processed by

                                                                                                                              2/18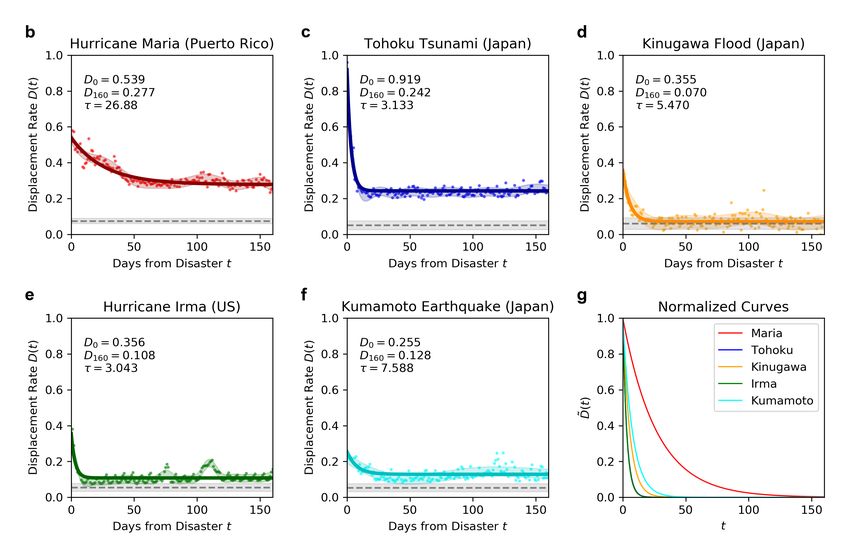
Data type                 Description                       Pros and Cons                        Providers (e.g.)
                                                                  (+) substantial coverage of the
                                Location information of cell
      Mobile phone call de-                                       population (-) Low spatial and       NCell, Orange, Voda-
                                phone towers when users
      tail records (CDR)                                          temporal resolution compared to      fone, Turkcell
                                make calls or text messages
                                                                  GPS datasets
                                                                  (+) precise location information
                                GPS data collected and ag-        of users (-) No transparency in
      Smartphone GPS lo-
                                gregated from several third       data generation process; covers      Cuebiq, Veraset, Safe-
      cation data (Location
                                party smartphone applica-         a small sample of population         graph, Unacast
      Intelligence firms)
                                tions                             compared to CDR; available for
                                                                  fewer countries
                                                                  (+) Available in standardized for-
      Smartphone GPS lo-        GPS data collected and ag-        mats across multiple countries
                                                                                                     Google, Facebook,
      cation data (Major        gregated from their own plat-     and across time (-) Outputs re-
                                                                                                     Apple, Yahoo Japan
      Tech firms)               forms                             stricted to selected metrics pro-
                                                                  duced by the tech firms

Table 1. Brief descriptions and applications of the four novel types of data: mobile phone location data, social media data,
web search query data, and satellite imagery night time light data.

major tech companies. Table 1 organizes how they are collected, the pros, cons, and examples of providers for each dataset.

Mobile Phone Call Detail Records (CDR)
During the last decade, mobile phone call detail records (CDR) have become one of the primary data sources for analyzing
human mobility patterns on the urban scale15 . Call detail records typically contain the unique ID of the user, timestamp, and
location information of the observed cell phone tower. Note that unlike smartphone GPS data introduced later, the location
information of CDRs are not the actual location of the user, thus contains typically around couple 100 meters to several
kilometers in the rural areas where cell phone towers are sparsely located. Using large-scale datasets of CDR data, a seminal
paper by Gonzalez et al. unraveled the basic laws of human mobility patterns16 . Several more papers have used CDR data to
understand spatio-temporal patterns of urban human mobility, routine behavior, and their predictability (e.g.,17, 18 ). Moreover,
human activity patterns and land use patterns have been studied using CDR data (e.g.,19 ). In addition to understanding human
behavioral laws, such data has enabled us to obtain dynamic and spatially detailed estimations of population distributions
(e.g.,20 ), social integration and segregation of mobility (e.g.,21 ), and macroscopic migration patterns (e.g.,22 ). Moreover, these
datasets have been applied to solve various urban problems such as preventing disease spread23–25 , estimating traffic flow
(e.g.,26, 27 ), and estimating socioeconomic statistics (e.g.,28 ) and impacts of shocks29 (for a full review, see30, 31 ).

Smartphone GPS Location Data from Location Intelligence Firms
More recently, we have seen an increase in the availability of mobile phone GPS location datasets collected by location
intelligence companies, such as Cuebiq (https://www.cuebiq.com/), Unacast (https://www.unacast.com/),
and Safegraph (https://www.safegraph.com/). Location intelligence companies collect location data (e.g., GPS data)
from third-party data partners such as mobile location-based application developers. Typically for each data point, a user
identifier, timestamp of observation, and the longitude and latitude information are included in the dataset. More recently, these
firms have started provided more aggregate (e.g., aggregated for each point-of-interest) data to preserve the privacy of the users.
Compared to CDR, GPS logs have higher spatial preciseness, and moreover, higher observation frequency, allowing us to
understand mobility patterns in more detail. However, often the specific sources of the location data nor the process in which
the data are collected and combined from several application services are undisclosed to the users. Therefore, using such data
requires a rigorous analysis of checking the representativeness of the mobile phone location dataset.

Smartphone Location Data from Major Tech Firms
Similar to the smartphone GPS location data collected by location intelligence firms, major tech firms such as Facebook,
Google, and Apple, also collect GPS location data from their users. The major difference in the data generative process is that
these major tech firms use data collected from their own platform, not by third party services. Often, these data are provided in
a pre-processed form, aggregated by both time and space. Facebook, through its “Data for Good” program, provides various

                                                                                                                                3/18
Figure 2. Population displacement after the Puebla Earthquake in Mexico City. Anomaly score (z score; number of
standard deviations more/less than the pre-earthquake mean) of population density during the day (left) and night (right) on
September 19th, 2017 in Mexico City. Significant displacement is observed during the night time of the day of the earthquake
(Source:38 )
types of location information products to researchers, agencies, and non-profits (https://dataforgood.fb.com). In
particular, the “Facebook Disaster Maps” provides detailed density maps of the population density and movement patterns
before, during, and after disaster events. The data is temporally aggregated (usually every 24 hours), spatially aggregated
(usually into 360,000 square meter tiles), and spatially smoothed, to anonymize and protect the users’ privacy32, 33 . The
Maps have been utilized by many significant nonprofit organizations and international agencies in disaster response, including
the International Federation of the Red Cross, the World Food Programme, the United Nations Children’s Fund (UNICEF),
NetHope, Direct Relief, and others.
Applications and Methodologies
Natural Hazards
Recently, mobile phone data has been utilized in many applications for disaster response and recovery, given its high spatial
and temporal granularity, scalability to analyze millions of individuals’ mobility, and increasing availability. In this section, the
studies using mobile phone data for natural hazard response and recovery are categorized into 3 categories of applications:
population displacement and evacuation modeling, longer-term recovery analysis, and inverse inference of damages to the built
environment. The required inputs, methodologies, obtained outputs, and case studies are presented for each application.
Population Displacement and Evacuation Modeling
The most widely studied applications of mobile phone location data in disaster response and recovery is to estimate the
population displacement and evacuation dynamics after disasters. In their seminal paper, Lu et al. used CDR to study the
predictability of displacement mobility patterns after the Haiti Earthquake in 201034 . Using data collected from 1.9 million
mobile phone users during the period from 42 days before to 341 days after the shock, the study estimated that 23% of the
population in Port-au-Prince had been displaced due to the earthquake. Despite the substantial displacement, they also found
that the destinations of the displaced people were highly correlated with their pre-earthquake mobility patterns. This finding
shed light on the possibility of predicting post-disaster mobility patterns, and had significant implications on relief operations
including the pre-positioning of distribution centers35 and evacuation shelters. Another seminal disaster event that highlighted
the use of mobile phone location data was the Gorkha Earthquake (intensity of 7.8Mw) which struck Nepal in 201536 . Wilson
et al. rapidly analyzed the displacement movements of 12 million de-identified mobile phone users after the earthquake within
nine days from the event4 . It was estimated that over 390,000 people left the Kathmandu Valley after the earthquake. These
results were released as a report with the United Nations Office for the Coordination of Humanitarian Affairs (UN OCHA) and
a range of relief agencies. This effort by Flowminder, a non-profit foundation for analyzing mobile phone location datasets, was
the first significant practical use-case of large scale mobile phone location data in disaster relief and response37 .
Following the aforementioned two seminal works after the Haiti Earthquake and Gorkha Earthquake, several studies have
developed methods to estimate population displacement and post-disaster evacuation patterns using mobile phone location
4/18data. A general framework for the spatio-temporal detection of behavioral anomalies using mobile phone data was proposed by
Dobra et al.39 . Using smartphone location data from before and after disasters, population displacement can be quantified by
measuring the anomaly score (z-score; the number of standard deviations more or less from the mean population on a typical
day) of the daytime and nighttime population in highly granular (1km x 1km) grid cells, as shown in Figure 238 . During the
night time after the earthquake, blue-colored clusters with z scores below -2, indicating a likelihood of less than 1% on a typical
day, can be observed in central Mexico City, showing significant decrease in nighttime population. Yabe et al. used smartphone
GPS location data collected by Yahoo Japan Corporation to analyze the evacuation rates after five earthquake events in Japan40 .
Cross-comparative analysis of five earthquakes and over 100 affected communities revealed similar relationships between
evacuation rates and seismic intensity levels, where evacuation rates significantly increased in communities that experienced
magnitudes above 5.5. Several computational frameworks have been proposed to estimate the spatial patterns of evacuation
destinations and hotspot locations using anomaly detection techniques on large-scale mobility data41 . Just after the Kumamoto
Earthquake in April 2016, population distribution and evacuation hotspot maps were produced jointly by researchers at the
University of Tokyo and Yahoo Japan Research, and were delivered to city governments for relief and response42 . Duan et al.
studied the evacuation patterns after a train collision incident in China using mobile phone location data, identifying a two-stage
evacuation process, and also behavioral changes in commuters’ travel route choices43 . Ghurye et al. study the displacement
patterns after the Rwanda Flood in 2012 using Markov Chain models and CDR44 . The study compares the observed human
behavior during a disaster with the behavior expected under normal circumstances to understand the causal effects of the disaster
event. Yin et al. combined mobile phone location data with agent based simulations (which are widely used in evacuation
analysis; e.g.,45 ) to improve the estimation accuracy of evacuation movement, proposing a hybrid approach46 .
More computational approaches using data assimilation techniques have been explored for online, near real-time predictions
of post-disaster mobility patterns. Song et al. proposed a mobility prediction model based on a Hidden Markov Modeling
framework, and tested its validity using data collected from 1.6 million mobile phone users in Japan before, during, and after
the Great East Japan Earthquake in 201147 . Sudo et al. developed a Bayesian data assimilation framework by combining
the particle filter and Earth Mover’s Distance algorithms, that updates the urban-scale agent based mobility simulation in an
online manner using spatially aggregate mobile phone location data provided in real time48, 49 . Several online algorithms have
been proposed since these seminal works, including CityMomentum50 that uses a mixture of multiple random Markov chains,
CityCoupling51 that aims to perform cross-city predictions, and inverse reinforcement learning approaches that attempt to learn
the behavioral patterns of human mobility during disasters from large scale data52, 53 . Although these computational, online
approaches are shown to be effective in experimental and post-hoc settings, none have been utilized in real-time after real-world
disaster events.
Policy applications: Evacuation and displacement estimation could be used for making various policy decisions during
the response and preparation stages of the disaster risk management cycle, including quick identification of post-disaster
needs, planning of emergency supply distribution networks, and pre-positioning of evacuation shelters and supplies.
Longer-term Analysis: Migration and Recovery
One advantage of mobile phone location data is the ability to track the movements of users over a long period of time (several
months ∼ year) with high frequency (e.g., hourly ∼ daily), which are extremely difficult to perform using household survey
data. Therefore, in the normal setting, there have been attempts to use mobile phone location data to estimate population
migration dynamics22, 54, 55 . In the disaster setting, Lu et al. studied the migration patterns in regions stressed by climate shocks
in Bangladesh using CDR56 . In addition to analyzing the short term human mobility patterns after Cyclone events (hours
∼ weeks), the study quantifies the incidence, direction, duration and seasonality of migration in Bangladesh. Acosta et al.
quantified the migration dynamics from Puerto Rico after Hurricane maria using mobile phone, showing a shift from rural to
urban areas after the disaster57 . Yabe et al. studied the population displacement and recovery patterns after five disaster events,
including Hurricanes Maria and Irma, earthquakes, floods, and tsunami using mobile phone GPS datasets from Japan and the
US (Figure 3)5 . Cross-comparative analysis of five major disasters revealed general exponential decay patterns of population
recovery, and predictability using a small number of key socio-economic factors including population density, infrastructure
recovery patterns, wealth indexes, and spatial network patterns. Marzuoli et al. used mobile phone data to analyze the recovery
dynamics of residents in South Texas after Hurricane Harvey58 . The study provided detailed statistics of population movement
and origin destination patterns for different zipcodes in Texas. In addition, the role of social networks59, 60 , hedonic behavior61 ,
and post-disaster spatial segregation62 have been tested using mobile phone location data after disasters. Apart from population
recovery and migration analysis, mobile phone location data has been used to quantify the recovery of business firms as well,
using foot traffic counts as a proxy for revenue63 . Regional and sector differences in disaster impacts have been quantified via a
Bayesian structural time series framework, using data collected from over 200 business entities in Puerto Rico before and after
Hurricanes Irma and Maria. Although mobile phone location data provide significant advantages in analyzing longer-term
phenomena (e.g., migration and recovery after disaster events) compared to household survey data, most studies focus on shorter
5/18Figure 3. Similarity of macroscopic population recovery patterns across the five disasters. a. Location, spatial scale,
and severity of disasters that were studied. Red colors indicate the percentages of houses that were severely damaged in each
community. b-f. Macroscopic population recovery patterns after each disaster. Raw observations of displacement rates were
denoised using Gaussian Process Regression and were then fitted with a negative exponential function. D0 , D160 and τ denote
the displacement rates on day 0, day 160, and recovery time parameter of each fitted negative exponential function. Black
horizontal dashed line shows average displacement rates observed before the disaster. g. Normalized population recovery
patterns all follow an exponential decay. (Source:5 )
term displacement and evacuation analysis, leaving substantial room for research in understanding the long term recovery and
resilience of urban and rural areas to disasters.
Policy applications: Analysis of migration and recovery estimation could be used for developing policies that focus
on longer term recovery and mitigation of hazards. Such tasks include longer term infrastructure investment plans for
building-back-better from disasters, strategies for harnessing community social capital for community resilience, and
planning of urban land use master plans to prepare for longer term migration dynamics.
Inverse Inference of Damage to the Built Environment
The studies introduced in the previous two subsections studied the anomalies in human mobility patterns disrupted by shocks
(e.g., hurricanes, earthquakes, tsunami) inflicted to the built environment. However, several studies have approached the
problem in an inverse manner, by using anomalies observed in the mobile phone location data and human mobility dynamics to
inversely estimate the damage to and recovery of the built environment, which have traditionally been estimated using hazard
simulations and structural mechanics (e.g.,64 ). Andrade et al. propose a novel metric “reach score” that quantifies the amount
of movement of mobile phone users, and finds that the reach score has significant correlation with the damage inflicted to
infrastructure systems by the earthquake at the canton level in Ecuador65 . Pastor-Escuredo et al. show that by analyzing the
anomalous patterns in mobile phone communications, we are able to conduct infrastructure impact assessment due to flooding
events, using retrospective data collected from a flood in Mexico66 . Finally, Yabe et al. propose a machine learning algorithm
that combines mobile phone location data with terrain information to conduct a rapid and accurate estimate of the inundated
areas during a flood event67 . These studies show the potential of using mobile phone location data to infer the abnormal states
of the built environment. Mobile phone location data has several advantages compared to conventional methods in data quality,
including satellite imagery which are often observed sparse in time (e.g., once a day at most), and social media data which are
more sparsely observed. While the application potential of these studies are promising, we lack comprehensive analysis of its
real-time feasibility and accuracy under different types of events.
6/18Policy applications: Detecting anomalies in human behavior and mobility patterns could provide rapid assessment of
damage inflicted to the built environment under data scarcity, and be applied for various downstream tasks including the
preparation of real-time flood inundation maps and identifying dysfunctional mobile phone tower locations.
Epidemics
Over the past decade, mobile phone location data have been utilized in modeling the outbreaks and spread of infectious diseases,
including cholera, malaria, and Ebola. Many studies have used mobile phone CDR to extract mobility inter-regional fluxes, and
have integrated such network dynamics with disease models to predict the spread of diseases and social dynamics68 . Moreover,
the coronavirus disease 2019 (COVID-19) has spurred the use of mobile phone location data for disease modeling. In this
section, we review the methods and case studies of the use of mobile phone location data for epidemic modeling.
Mobility Network Estimation for Epidemiological Modeling
The majority of the research have used mobile phone location data (mainly CDR) to extract the intra-regional mobility (origin
destination) patterns, and integrates such insights into epidemiological models (e.g., SIR, SEIR models) to predict disease
outbreaks. The seminal work on this topic performed by Wesolowski et al. used CDR from Kenya to quantify the importation
routes that contribute to malaria epidemiology on regional spatial scales24 . The identification of the sources and sinks of
imported infections due to human mobility showed significant potential in improving malaria control policies. Combined with
rapid risk mapping, mobile phone location data based approaches could aid the design of targeted interventions to maximally
reduce the number of cases exported to other regions while employing appropriate interventions to manage risk in places that
import them69 . A review and comparison of using survey based travel data and mobile phone data revealed that survey data
produces lower estimates of travel, however, provided demographic information and motivations of travelers, which could be
further utilized for modeling. On the other hand, mobile phone data provides a refined spatio-temporal description of travel
patterns, although it lacks demographic information about the travelers70 . Bengtsson et al. estimated the mobility network using
movements of 2.9 million anonymous mobile phone users (CDR) in Haiti during the 2010 cholera outbreak. The prediction
accuracy of the outbreak were compared with gravity model estimates, and it was shown that mobility networks generated
from mobile phone data had comparable accuracy with gravity models, however, mobile phone data was advantageous since
it required no model parameter calibration, unlike gravity models71 . Finger et al. used a mobile phone CDR dataset of over
150,000 users in Senegal to extract human mobility fluxes Qi j (t) ∀i, j across regions i and j, where Qi j (t) represents the
community-level average fraction of time that users living in region i spend in region j during day t. By directly incorporating
the mobility fluxes into a spatially explicit, dynamic epidemiological framework, they identified mass gatherings to be a key
driver of the cholera outbreak23 .
Similar studies have been conducted in other regions, on other types of diseases, with several improvements to the epidemic
modeling methodologies. For example, Wesolowski et al. used seasonal fluctuations in travel patterns estimated from mobile
phone data to characterize seasonal fluctuations in risk across Kenya for rubella disease73, 74 . Moreover, seasonal asymmetric
mobility patterns were used to refine the epidemiological models in Kenya, Namibia, and Pakistan75 . Panigutti et al. assessed
the stochasticity in the epidemic modeling outcomes, and showed that model estimates are become more adequate when
epidemics spread between highly connected and heavily populated locations76 . Similarly, Tizzoni et al. compared the use
of mobile phone location data and census information in epidemiological models, and found that phone data matches the
commuting patterns reported by census well but tends to overestimate the number of commuters, leading to a faster diffusion of
simulated epidemics (shown in Figure 4)72 . Rubrichi et al. used mobile phone data and epidemiological models to evaluate
the effects of various spatial-based targeted disease mitigation strategies77 . In other regional and disease contexts, Vogel et al.
estimated the Ebola outbreak in Western Africa by using CDR in a simulation framework78 , Ihantamalala et al. estimated the
sources and sinks of malaria parasites in Madagascar79 , and Kiang et al. improved forecasts of Dengue fever in Thailand by
integrating human mobility data80 .
During the coronavirus pandemic (COVID-19), we saw a rapid increase of the use of mobile phone smartphone GPS
location data to estimate mobility networks for epidemiological modeling81 . Schlosser et al. analyzed the structural changes
in the mobility network during mobility restrictions in Germany, and found that long-distance travel trips were reduced
disproportionately, enabling the flattening of the epidemic curve and delaying the spread to geographically distant regions82 .
Lai et al. used mobility data-driven travel networks combined with an SEIR model to evaluate the effects of various non-
pharmaceutical interventions on the spread of COVID-19 in China83 .
Policy applications: Estimating human mobility networks in spatial and temporal granularity can be used to not only
understand migration patterns, but as crucial input for epidemiological models (e.g., SIR, SEIR models), which can be
used to predict the outbreak of the diseases, and the effects of various policies (e.g., lockdown, inter-regional mobility
restrictions) in containing the spread.
7/18Figure 4. Epidemic invasion trees. Full invasion trees for R0 = 3 are shown for Portugal (top row) and France (bottom row)
in the cases of the census network (a, d), the mobile phone network (b, e) and the radiation network. (Source:72 )
Monitoring and Forecasting of Non-Pharmaceutical Intervention Effects
While mobile phone location data has been shown to be an adequate data source to estimate the inter-regional mobility networks
which are crucial inputs for epidemiological models, they can also be used to evaluate the effects of non-pharmaceutical
interventions, including regional and national lockdowns and inter-regional travel restrictions, in restricting human behavior.
Prior to the COVID-19 pandemic, Peak et al. used mobile phone CDR data to evaluate the effects of a lockdown in Sierra
Leone during the Ebola epidemic84 . As many countries adopted non-pharmaceutical interventions (NPIs) during the COVID-19
pandemic, mobile phone location data (mainly GPS data) were used to evaluate the effects of such orders85 . Researchers from
academia, industry, and government agencies (e.g.,86 ) have utilized large-scale mobility datasets to estimate the effectiveness
of control measures in various countries. Such analyses were conducted and often frequently updated to monitor mobility
reduction situations87 . Kraemer et al. used mobile phone-generated mobility data from Wuhan and detailed case data including
travel history to show that especially during the early stages of the outbreak, the spatial distribution of the COVID-19 cases
were explained well by mobility data88 . Pepe et al. quantified three different aggregated mobility metrics (origin-destination
movements between provinces, radius of gyration, and average degree of a spatial proximity network) during the lockdown in
Italy using mobile phone location data89, 90 .
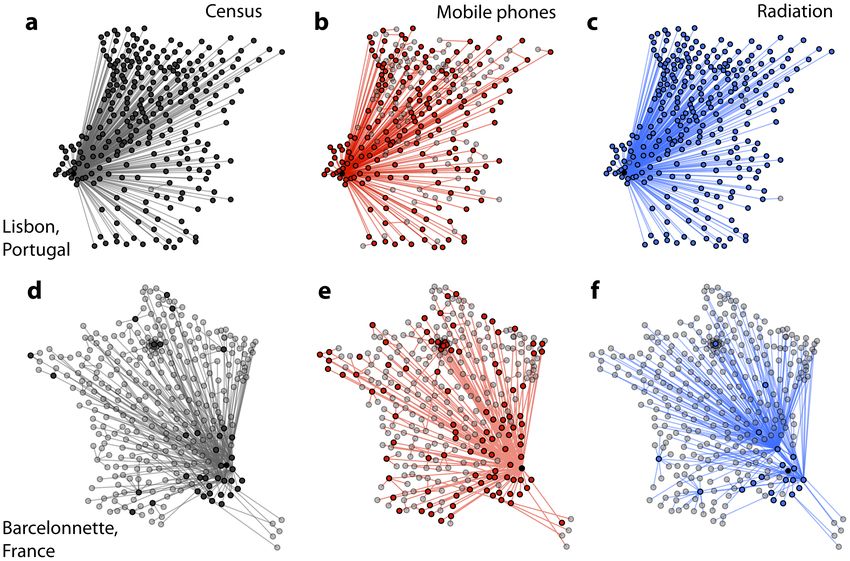
In our past work in Japan as shown in Figure 5, human mobility metric including the social contact index was quantified
before, during, and after non-compulsory lockdowns91 . Analysis showed that even after non-compulsory orders, mobility
significantly dropped (70% reduction) and the effective reproduction number had decreased to below 1. Such analysis has been
conducted in the United States as well, assessing the effects of state-level interventions on mobility reduction92 , significant
geographical variations in social distancing metrics93 , and income inequality in social distancing94 . Similar studies on mobility
monitoring during non-pharmaceutical interventions were performed in Sweden95 , the United Kingdom96 , Italy97 , France98 ,
Spain99 , Switzerland100 , Finland101 , Taiwan102 , and Hong Kong103 .
In addition to monitoring the effects of non-pharmaceutical interventions, there has been an increasing number of studies
focusing on forecasting and providing early warning of outbreaks. Kogan et al. used multiple sources of data including mobile
phone location data, social media data, and web search data, to prodive early warning signals of COVID-19 outbreaks. The
study showed that combining disparate health and behavioral data may help identify disease activity changes weeks before
observation using traditional epidemiological monitoring104 . Similarly, Yabe et al. used mobility data and web search data
provided by Yahoo Japan Corporation to develop risk indexes for microscopic geographical areas, and showed that such
metrics could predict local outbreaks two weeks beforehand105 . Chang et al. integrated human mobility network data into a
metapopulation SEIR model to simulate the spread of COVID-19, and identified specific points-of-interest which are if closed,
8/18Figure 5. Macroscopic mobility dynamics. (A)-(C) show the population distributions on 3 different dates at same times
(12PM), each on the same day of week (Mondays). We observe substantial decrease in the population density at stations and
cities. (D) shows the amount of contacts an individual potentially encounters outside home for each time period. (E) shows the
non-linear relationship between the mobility metrics and R(t). (Source:91 )
could be effective in suppressing the disease spread106 . The use of mobile phone location data has become prevalent in the
field of economics, for example, Chetty et al. developed a platform to track the impacts of COVID-19 on businesses and
communities in real-time, using various types of data including Google Mobility Report data107 .
Policy applications: Quantifying various human mobility metrics (e.g., stay-at-home rates, average travel distance, social
co-location index) in near-real time, in high spatial and temporal granularity, can be used to assess the effects of various
non-pharmaceutical interventions on human behavior.
Discussion
Opportunities
Increasing Availability of Data Products
As reviewed in Section 3, many studies have already utilized the various kinds of mobile phone location data for disaster
management. However, these were often enabled by direct partnerships or collaborations between researchers and private
companies who own the data, making the data extremely difficult to access for researchers outside the agreement. Due to
the increased attention and interest on mobile phone location data during the COVID-19 pandemic, there has been several
notable efforts where mobile phone location data, in their anonymized forms, are being made openly available for the public
use. For example, the PlaceKey community (https://www.placekey.io/) have contributed to this effort by providing
a semi-open platform where researchers can freely access aggregated mobile phone location data for analysis. The data are
spatially and temporally aggregated to point-of-interests, and also made sure that a substantial small number of visit counts are
masked, so that the individual users are unidentifiable. There are cases where researchers have led the efforts in anonymizing
the data and making the mobility data open source. The team of researchers from The Robert Koch Institute and Humboldt
University of Berlin have developed a dataset which contains mobility data collected from mobile phones in Germany during
the first half of 2020 (January-July), and mobility data from March 2019, which can be used to study changes in mobility during
the COVID-19 pandemic in 2020 (https://www.covid-19-mobility.org/).
In addition to these efforts, various organizations including major tech firms have made significant contributions in
publishing aggregate statistics of mobility (e.g., social distancing, travel distance) during the COVID-19 for various regions
around the world. The Google COVID-19 Community Mobility Reports, which contained the time series data of travelled
distance in various cities around the world, was used by practitioners to monitor the effects of non-pharmaceutical policies on
9/18mobility restrictions108 . A similar report on mobility patterns was also issued by Apple109 . Camber Systems developed the
county-level social distancing tracker based on aggregated and anonymous location data to understand how populations are
engaging in social distancing over time (https://covid19.cambersystems.com/). The COVID-19 Mobility Data
Network (CMDN) is a network of infectious disease epidemiologists at universities working with technology companies to use
aggregated mobility data to support the COVID-19 response. The CMDN developed the Facebook Data for Good Mobility
Dashboard, which visualizes the aggregate mobility trends, computed from Facebook mobility data, at the regional levels for
various countries around the world (https://visualization.covid19mobility.org/).
Data for Development
With the availability of various types of novel datasets including social media data, mobile phone location data (call detail
records, GPS), web search query data, and satellite imagery data, there has been significant efforts to utilize big data analytics
for tackling challenges in development110 . Several open data challenges have been initiated by collaborations between academia
and industry data providers, such as the Data4Development Challenge held by Orange, which provided mobile phone data
from Ivory Coast for analysis111 . Large tech firms, including Google, Facebook, Apple, and Microsoft, have all boosted
their efforts in utilizing the enormous amount of collected data for development and disaster management. Google.org, the
is the charitable arm of Google, has committed roughly US$100 million in investments and grants to nonprofits annually to
tackle various issues including disaster response, improving accessibility to education, and more recently, recovering from
COVID-19 impacts (https://www.google.org/). International agencies have also accelerated their engagement in
utilizing such big data sources for development projects. The World Bank has initiated the Development Data Partnership
(https://datapartnership.org/), which is a partnership between international organizations and companies, created
to facilitate the use of third-party data in research and international development. The Partnership includes more than 20
private companies, including location intelligence companies such as Google, Cuebiq, Safegraph, and CARTO, and social
media companies including Twitter and Facebook. To assist the utilization of these datasets, recently, the Global Facility for
Disaster Reduction and Recovery (GFDRR) - a partnership hosted within the World Bank - has undertaken efforts on using
GPS location data collected from smartphones to analyze post-disaster population displacement for disaster relief and urban
planning policy making. GFDRR has published working papers and publications on several case studies using smartphone
location data accessed through the Development Data Partnership initiative, including the population displacement patterns
and income inequality in Mexico City after the Puebla Earthquake38 and socioeconomic gaps in mobility reduction during the
COVID-19 pandemic in Colombia, Mexico, and Indonesia112 .
Open Source Toolkits for Mobility Analytics
To assist policy makers and non-data experts to leverage the increasing availability of mobile phone location datasets,
there has also been several efforts to develop open source toolkits for mobility data analytics. scikit-mobility is a
Python-based library that enables various operations and analyses on large-scale mobility data113 . Compared to previous
Python based mobility analysis libraries such as Bandicoot114 and movingpandas115 , scikit-mobility is most
comprehensive, containing functions for pre-processing, stop detection, computation of mobility metrics (e.g., displacements,
characteristic distance, origin-destination matrix), trajectory synthesis, visualizations, and privacy risk quantification. There
exists several libraries to conduct trajectory analysis in the R ecosystem, however, none of the libraries are optimized for
human mobility data, thus lacks functions for generating synthetic trajectories and producing advanced visualizations (for a
review, see116 ). OSMnx is a powerful library for acquiring, constructing, analyzing, and visualizing complex street networks
from OpenStreetMap117 . In combination with human mobility data, OSMnx enables users to perform various spatial analysis
including route estimation and point-of-interest visit estimation. More recently, the GFDRR developed an open-source location
data analytics toolkit in Python MobilKit in collaboration with Purdue University and MindEarth (a non-profit based in
Switzerland https://www.mindearth.org/), which extends the functions in scikit-mobility to conduct post-
disaster mobility analysis (https://github.com/GFDRR/mobility_analysis). To enable non-experts to use the
softwares, the codes are optimized using Dask118 for parallel computing, so that analysis on massive mobility datasets can be
conducted under constrained resources, on local laptop or desktop computers.
Challenges
Despite the enormous opportunities in using mobile phone location data for disaster management as reviewed in the previous
sections, the rise of novel mobile phone location data produced by location intelligence companies and the wide spread use
of the data by various stakeholders, pose new challenges in utilizing the dataset in an inclusive, transparent, and sustainable
manner. Here, we touch upon the main key challenges that we face in the usage of mobile phone location data, related to
assuring the data quality, governance, and open research directions in developing advanced analysis techniques.
10/18Understanding the Data Generative Process
One of the key drawbacks of using the more recently available smartphone GPS location data is the lack of our understanding
in how these data are collected and processed. Several studies have conducted investigations on the representativeness of these
datasets (e.g.,5 ) using raw data, by quantifying the correlation between the number of mobile phone users estimated to be living
in each geographical region, and the census population information. This metric, however, is far from comprehensive, and
we have pressing demand for a more thorough investigation on various aspects of socio-demographic and socio-economic
characteristics, and to ensure that the observation samples in the data are not biased towards a specific population group of
wealth, region, ethnicity, gender, etc. This procedure becomes even more difficult when only aggregate information, such as
the total number of daily users in a specific region or the daily number of visitors to a specific point-of-interest, are provided
by the data providers. In addition to the uncertainties in the sample representativeness, the data collection procedure is not
transparent. For example, some softwares and applications collect location data when the device detects substantial movement,
therefore, only a very small number of points would be observed if the user stays at one location (e.g., home) during the entire
day. Other algorithms collect location information in extremely high frequency (e.g., every minute), irrespective of the amount
of movement. This is partly the reason why we observe such a large variance (i.e. truncated power law) in the number of
observation points per user5 . In the absence of methods and algorithms for correcting the bias in the data, the trustworthiness of
the data products and analysis will be undermined. A more open discussion between data users – researchers and practitioners –
and data providers to further understand the process of dataset generation, and a standardized way of quantifying and reporting
the representativeness biases and the potential errors present within the dataset are essential for more inclusive, fair, and
trustworthy data products for disaster response.
Data Governance
As we experience an increase and universal accessibility to large scale mobile phone location data, the protection of personal
privacy has never been more important11 . Previous studies have revealed that a very few number of data points could reveal the
identity of the user with high accuracy, highlighting the importance of anonymization techniques119 . Following such public
concerns, data providers have started to provide processed data, aggregated by space and time. For example, the Disaster Maps
data in the Facebook Data for Good program aggregates population density and flow into each day, into 6 kilometer size grid
cells, and further applies spatial smoothing algorithms to anonymize the data. This process, although effective in anonymizing
the data and protecting the users’ privacy, comes with a price in the data granularity and uncertainties in the data quality, as
explained in the previous Section. To address this issue and to balance out the data quality with privacy protection, the concept
and techniques of differential privacy are gaining attention. Differential privacy is a criterion, which tools are devised to satisfy.
It enables the collection, analysis, and sharing of statistical estimates using personal data while protecting the privacy of the
individuals in the dataset120 . Techniques such as differential privacy may serve as one baseline to ensure the safety of personal
privacy, but we are still amidst the search for a holistic framework that integrates technical solutions, ethical guidelines, and
regulations on the use of mobile phone location data.
Translating Analysis into Disaster Risk Management Policy and Operations
Mobility data has been shown to be effective in various applications that can be used for policy inputs, including conducting
rapid post disaster damage and needs assessment, business disruptions and recovery monitoring, and dynamic population
mapping. Key areas of opportunity include: (i) increasing situational awareness of emergency response managers through timely
information on the number and geographic location of displaced persons; (ii) improving damage and needs assessments through
quantification of foregone economic activity in business sectors; (iii) informing finance and policy support for post-disaster
recovery efforts by quantifying business recovery rates in affected districts. While there has been many successful cases of
translating the mobility data analysis into policy decision making, such as the population displacement maps after the Gorkha
Earthquake4 , there is still a limit to the number of organizations and research groups that are capable of conducting such an
end-to-end, analysis-to-policy translation. As many regions face an increasing likelihood of experiencing disaster events due to
urbanization and climate change, there is a pressing demand for expanding these mobility data-driven solutions across regions
and disaster events. One attempt to localize these data-driven solutions is to develop open source toolkits (as introduced in
Section 4.1.3) to increase the capacity of local stakeholders and data scientists to conduct such analysis. In addition to the
analytics tools, stakeholders require an effective scheme to share experiences, knowledge, and know-how across different
regions and stakeholders. To foster strong uptake of insights derived from human mobility data, further methodological research
is needed to address key challenges such as quantifying the representativeness and socio-economic bias of human mobility
datasets; and accounting for impact of network outages during disaster events on observed population numbers. Exploring a
way to expand the mobility data analytics into various local contexts is a critical operational challenge.
11/18Future Research Directions
Cross-Comparative Analysis across Events
Mobile phone location data, with its global coverage and spatio-temporal scale in data size, allows us to conduct cross
comparisons across locations, disaster types and time scales, as shown in previous studies (e.g.,5, 40 ). Comparing the response
and recovery dynamics across different disaster events across regions, allows us to extract essential dynamics that govern
the disaster recovery process, as demonstrated in Yabe et al., where general patterns of recovery of population displacement
(i.e., negative exponential decay) were discovered5 . In addition, such parsimonious models allow us to show and explain the
differences/variability that exist across the regions, using socio-demographic and -economic factors. Such type of transferable
and universal models are much needed in the disaster science literature. Using such insights, we are able to build parsimonious
models of disaster response and recovery, which were difficult to do before using conventional household survey data.
Modeling the Disaster Recovery Process
As pointed out in Section 3.1.2, although we have a large collection of case studies that conduct displacement analysis using
mobile phone location data, the literature is still limited in studies that perform analysis and modeling of the long-term recovery
process after natural hazards. This is partly due to the lack of availability in long term data (over 6 months) in the same
region and data provider. As a result, one limitation in natural hazard response and recovery process modeling is the lack
of a standardized parsimonious model that captures the dynamics of population movement and recovery, similar to what the
SIR, SEIR models achieve in epidemiological modeling. Mobile phone location data, either independently or by fusing with
other data types, allows us to model correlations and interdependencies across various systems that compose cities. Modeling
these interdependencies will allow us to build dynamic and causal models that show how the social, built environment and
economic forces contribute to the response and recovery of communities after disasters. Recently, a system dynamics modeling
approach that captures the interdependent dynamics between social and technical systems has been proposed and tested using
the case study of recovery after Hurricane Maria in Puerto Rico121 . Despite its capability in replicating the recovery process
and understanding the system interdependencies that play a role in disaster recovery, we still lack parsimonious models that
capture the various aspects of disaster recovery including population migration.
Fusion with Other Data Sources
While we have seen a rapid increase of the usage of mobile phone location data, there are several other types of data that have
been used frequently in disaster management, including satellite imagery (for a review article, see14 ) and social media data (for
review articles, see12, 122 ). Satellite imagery, despite its low frequency of data collection, enables the observation of damages to
the natural and built environments in a detailed spatial scale. On the other hand, social media data contains rich information on
the peoples’ opinions, ideas, and sentiments at a high temporal granularity. Moreover, combining mobile phone location data
with household surveys could allow us to analyze both the post-disaster mobility patterns as well as the motivations behind such
behavior. More recently, credit card transaction data has become more available for research purposes (e.g.,123 ). Using credit
card data, we are able to understand the economic impacts of disasters and epidemics at a spatially and temporally granular
level. Combining these datasets with mobile phone location data and human mobility analytics (e.g., application in poverty
estimation124 ) could enable a more holistic understanding of the social, physical, and economic dimensions of the disaster
response and recovery dynamics.
Conclusions
Due to rapid urbanization, climate change, and complex interactions with various social, economic, and political factors, the
risks of disasters – natural hazards and pandemics – are continuing the increase across the globe. The comprehensive literature
review of research and efforts that have used mobile phone location data for (natural and pandemic) disaster management
throughout the past decade has shown that such data enables the implementation of various rapid, high-precision, large-scale
approaches to assist disaster management (response, recovery, and preparation), compared to conventional approaches using
household surveys. More specifically, applications in natural hazard response include population displacement and recovery
analytics, quantifying economic disruptions, and inferring the physical damage inflicted to critical infrastructure systems
through behavioral changes. Dynamic and high-resolution origin destination matrices are critical inputs for epidemiological
models, and have already been applied to predict the spread of a wide range of communicable diseases. The COVID-19
pandemic spurred the use of mobile phone location data for pandemic disaster response, showcasing the usefulness of the data
in pandemic response and recovery.
With both the increase in demand and supply of location-based intelligence platforms and applications both from public
and private entities, we anticipate that the availability of location and human mobility datasets to continue its increasing trend.
The review of available data products, data-sharing ecosystems (e.g., Development Data Partnership of The World Bank), and
open source toolkits for the analysis of human mobility data for disaster response and recovery applications highlighted the
12/18You can also read