Montville Public Schools - 2020-21 Budget Presentation February 25, 2020
←
→
Page content transcription
If your browser does not render page correctly, please read the page content below
Montville Public
   Schools
2020-21 Budget
 Presentation
 February 25, 2020

                     1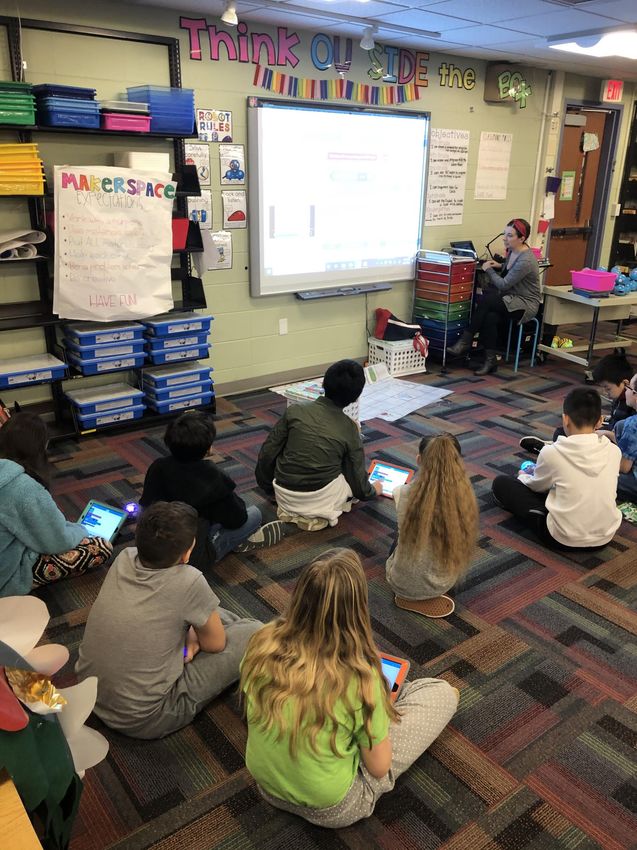
OUR VISION AND CONTEXT:
BACKDROP FOR THE BUDGET

                          2
Our Vision

    At Montville Public Schools all students will be engaged in
     purposeful and challenging learning experiences that are
  responsive to individual differences. As a community we share
 accountability for student success and social and emotional well-
being. Through strong relationships with students, parents and the
 community, we will promote civic responsibility, development of
           personal identity, and respect for diversity.

By providing an environment where it is safe to take risks, students
 will learn to take pride in who they are and what they accomplish.
  The Montville Public Schools will deliver on the promise of high
  achievement for all students and eliminate opportunity gaps to
   ensure every graduate is a critical, creative, and collaborative
problem-solver ready to enter college and career in a global society.

                                                                        3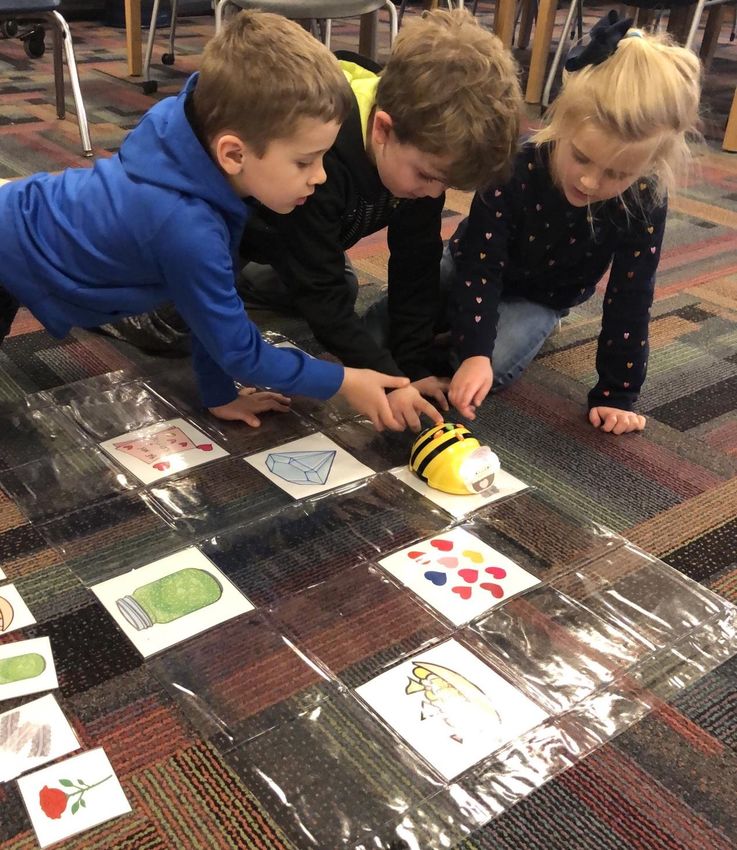
District Profile

              6 Schools                                    2077 Students
        224 Certified Staff
        13 Administrators                                4% English Learners
      63 Paraprofessionals                             16.4% Special Education
                                                   42.2% Free/Reduced Meals

     ~$38.7 M FY19 Budget
$15.5 K FY19 Per Pupil Spending
 (from CT School and State Finance Data)

                                                                                 4
Recent Recognitions Based on Our Investments
• National Blue Ribbon School – Oakdale was one of five schools in CT
and 342 schools nationwide to be honored for students’ growth and
achievement as measured by SBA.
• CSDE Schools of Distinction – Oakdale recognized for past 4 years;
Mohegan recognized for 2 years, Murphy recognized this year
• Smarter Balanced Scores – Percent of students meeting proficiency in
math increased by 20.4% over the past four years.
Oakdale was ranked second in the state for ELA growth among high-
needs students
• Next Generation Accountability - Murphy was one of 5 area schools with
the largest increases in school index scores; it increased by 17.7%
• ECC Championship Teams – Basketball and Cheerleading
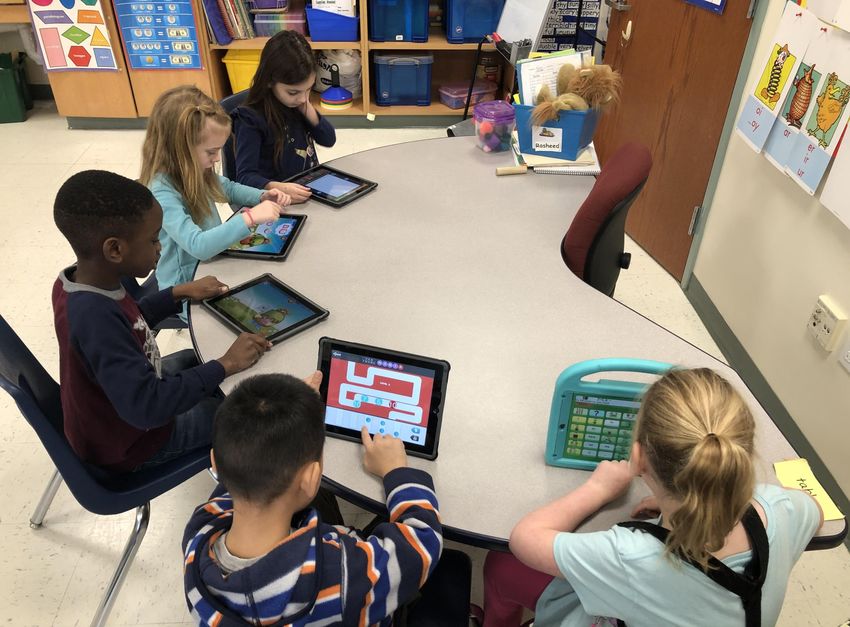
• Vex Robotics Tournament – Tyl students make Tournament Finalists
• CMEA Honors Choir and Eastern Music Festival – Tyl students accepted
5
to both of these events
Historical Enrollment by Grade – NESDEC Study
In prior years MPS was able to cut costs by reducing staff aligned to declining student enrollment; however, our
                       current enrollment projections do not afford the same flexibility.

                                                                                                                   6
Projected Enrollments – NESDEC Study

                                       7
Special Education Trend Report
8Special Education Costs
92021 Projected Elementary Enrollment –
Class Sizes with No Net Change in Faculty
Mohegan Elementary School
Grade Projected Projected Average Size Change in
Enrollment Number of Number of
Classes Classes
K 59 4 14.75 0
1 51 3 17.00 0
2 50 3 16.67 0
3 49 3 16.33 0
4 64 3 21.33 +1
5 49 3 16.33 0
TOTAL 319 19
Dr. Charles E. Murphy Elementary School
K 49 3 16.33 0
1 41 3 13.67 0
2 42 2 21.00 -1
3 41 2 20.50 -1
4 60 3 20.00 0
5 51 3 17.00 +1
Total 282 17
Oakdale Elementary School
K 57 3 19.00 0
1 44 2 22.00 -1
2 49 3 16.33 0
3 50 3 16.67 0
4 52 3 17.33 +1
5 42 2 21.00 0 10
TOTAL 294 17Secondary Enrollment Projections
Leonard J. Tyl Middle Scohol
Grade Projected Current Difference Number of
Enrollment Enrollment Sections /
Class Size
6 149 191 -42 7 / 21.3
7 191 170 +21 9 / 21.2
8 170 165 +5 8 / 21.3
TOTAL 510 526 -16
Montville High School
9 147 118 +29
10 120 145 -25
11 146 144 +2
12 142 130 +12
Total 555 537 +18
Palmer Building
TOTAL 34 38 +1
Transition Academy
TOTAL 13 7 +6 11History of BOE Funding
Fiscal Year Budget % Change
2012 $36,632,735
2013 $36,632,735 0.00
2014 $36,632,735 0.00
2015 $37,200,441 1.55%
2016 $37,598,668 1.07%
2017 $37,698,667 0.27%
FY 2018 (Jul.) $37,660,619 -0.10%
FY 2018 (Nov.) $36,660,619 -2.75%
Net
FY 2019 $37,660,619
0.00
FY 2020 38,691,433 +2.74%
12History of Past Reductions in Our Budget
• Failure to replace technology
• Reduction in administration and teacher-leaders
• Loss of online subscription programs
• Elimination of Tyl regular ed. summer school program and Oakdale
afterschool program
• Reductions to library books and supplies
• Inability to restore K-8 English Language Arts leader
• Inability to offer a second World Language at Tyl and MHS
• Loss of elective teachers at Tyl and MHS (Technology Education, Art,
Business, PE, LMS)
• Loss of Certified Nursing Assistants program at MHS
• Reduction in field trips, Project Oceanology
• Reduction in professional development
• Reductions to custodial, secretarial, library media, paraprofessional, and
monitor staffing
• Reductions in supplies, textbooks, property, and online resources
13State ECS Funding
$11,960,140 FY 2018 Original ECS Appropriation
• Decrease from FY 2017 Appropriation of $12,589,621
$10,936,376 Revised Final FY 2018 Appropriation
• Combined Loss for ECS and Excess Cost was $1,186,948
$12,630,507
FY 2019 Appropriation
$12,690,954
FY 2020 Appropriation
$12,779,336 Proposed FY 2021 Appropriation
• Increase of $88,382 14Board Goal
Engage the greater community, town officials, parents and students
through a communications strategy.
Ensure public support for education budget passage.
Understand the financial climate of the Town and the impact to the
taxpayers.
Engage in open communications and operations with other municipal
boards and the community throughout the budget process
Communicate with the Town the importance of the capital plan
Identify the necessary capital improvement requests and determine
ramifications to the operating and capital budget.
COMMUNITY INVOLVEMENT
IN THE BUDGET PROCESS
15Community Involvement
Budget Input Technology Survey
• January 3, 2020 Meeting at the • 542 total respondents
Montville Senior Center
Parents – 48.2%
• January 6, 2020 forum for Secondary
Schools community Other Community Members – 9.2%
• January 10, 2020 forum Oakdale and Teachers – 10.1%
Murphy Communities Students – 32.5%
• January 21, 2020 Presentations by
Principals to Board about school needs
• January 28, 2020 forum for Mohegan
Community
• February 4, 2020 Joint Meeting of the
Board of Education and the Town
Council
• February 4, 2020 Presentation by the
16
School and State Finance Project2019 Survey Input around Current Services
Survey Question:
Please indicate your support for the additional funding required
to maintain current services due to inflation.
Support for Funding to
Category
Maintain Current Services
Academic programs 99%
School security and
97%
safety
Building maintenance 96%
Technology 94%
Class size 94%
Athletics 88%
17Budget without Additional Services – $39,744,736
Represents an Increase of $1,053,303 or 2.72% above 2020 Appropriation
Includes:
0.57% Increase in Salaries (+ $600,240)
0.14% Increase in Benefits (+ $143,207)
0.19% Increase in Purchased Services (+ $202,400)
0.06% Increase in Tuitions (+ $67,328)
0.03% Increase in Supplies (+ 32, 226)
18Overview of the Rollover Budget
Review of the Format of the Budget Binder
Brief explanation of changes to:
• Salaries
• Health Insurance
• MERS
• Property, liability and workers’ comp. insurance
• Purchased services
• Effect of solar project
• Effect of licensed maintenance workers
• Special Education
• Transportation
19Major Themes from Budget Forums
• Small class sizes are important; cuts to Tyl staff have affected
students
• Improved technology is a priority (computers for all students
at middle and high school level, increased access to
technology)
• Increased services of social workers are required to meet
students’ mental health needs
• School safety should continue to be a focus
Other Comments:
The reintroduction of middle school sports combined with the
late bus has provided students with an important opportunity
20Principals’ Needs Presented at Jan. Board Meeting
Secondary Principals’ Requests:
Updated technology and increased availability of computers
Full time social worker at each school
Creation of an additional alternative classroom for Tyl
students who don’t function well in the larger general setting
Reinstatement of the Head Teacher position
Elementary Principals
Replacement of part time paras with full time paras in the
Pathways and special needs classrooms at CEM and Mohegan
Increase in the time the social worker is in each building
Maintenance of small class sizes
21RECOMMENDATIONS FROM
THE SUPERINTENDENT
22Identified Needs
Need 2019-2020 2020-2021 2021-2022 Future
Maintenance Position $95,600
Custodial Position $77,000 $77,000
3 Certified Teacher Positions $90,900 $210,000
(social worker and classroom
teachers)
SAT Prep Course 0
Middle School Sports $36,000
Elementary Field Trips $6,000
Full-Time Paraeducators $50,000
One-to-One Computing, MHS $30,000 $140,000
Additional Leadership at Tyl 0 $16,000
ELA Coach $80,000 $80,000
Security Officers $30,000
ea.
23Board Goal
Promote all aspects of the Montville Public schools using
available technology
The budget will include the necessary funding to maintain and
enhance technology in order to retain current students and attract
new students to the District.
The budget will include the necessary funding to support District
technology
24Secondary Technology
MHS MHS
Desktops Current/Age Laptops Current Age
Computer Lab 108/110 52 8 yrs. CW 1 23 10 yrs.
Media Center 37 11 yrs. CW 2 24 7 yrs.
Art 317 18 11 yrs. CW 3 25 7 yrs.
Science Labs 11 11 yrs. CW 4 23 7 yrs.
Computer Lab 19 11 yrs. Room109 5/3 3/10 yrs.
Tech Ed 804 18 2 yrs. w/ Perkins Robotics 11 8 yrs.
Tech Ed 806 18 1 yrs. w/ Perkins Reading 9 10 yrs.
Business Replaced with 24
Chromebooks w/
Tyl
Perkins
Laptops Current / Age
Tyl Dell Cart 1 25 7 yrs.
Desktops Current / Age
Dell Cart 2 25 5 yrs.
CL 1 25 12 yrs.
Mac Airs (PC) 25 9 yrs.
CL 2 27 12 yrs.
HP Chrome 1 25 3 yrs.
Prof Lib 18 11 yrs.
HP Chrome 2 20 2-3 yrs.
Mac Lab (PC) 22 11 yrs.
Dell Chrome 4 2-3 yrs.
TR7 8 11 yrs.
Library 12 11 yrs.
Music (iMac) 15 11 yrs. 25Replacement Options
Purchase 2020-2021 2021-2022 2022-2023 2023-2024 Total
Desktops $51,255 (85) $45,975 (75) $62,712 (104) 0 $159,942
(264)
Laptops (200) $45,000 (75) $30,000 (50) $30,000 (50) $15,000 (25) $120,000
Total: (464) $96,255 $75,975 $92,712 $15,000 $279,942
Lease 2020-2021 2021-2022 2022-2023 2023-2024 Total
Desktops $40,992 $40,992 $40,992 $40,992 $163,968
(264)
Laptops (200) $30,900 $30,900 $30,900 $30,900 $123,600
Total (464) $71,892 $71,892 $71,892 $71,892 $287,568
Lease 2020-2021 2021-2022 2022-2023 2023-2024 Total
Chromebooks $56,993 $56,993 $56,993 $56,993 $227,972
(1070)
Laptops $165,315 $165,315 $165,315 $165,315 $661,260
(1070)
26Technology Survey Input
Question Percent Agree
All: I am interested in the district pursuing a 1:1 program for students. 90.8
All: Given that we could buy three Chromebooks for the cost of one
laptop, I believe Chromebooks would meet our academic needs. (11.6% 81.5%
unsure)
Students: Having a 1:1 device will increase my ability to complete
93.1%
school work.
Students: I am in favor of going to a 1:1 computing environment 77.8%
Community members: I am in favor of going 1:1. (24% oppose) 70.0%
Parents: I would opt to have my child bring his own device. 13.4%
Parents: We have an internet connection at home. 98.1%
Parents: We have a working device at home which students can use. 91.2%
Teachers: If students had 1:1 devices, I would not need textbooks.
34.5%
(45.5% said maybe)
Teachers: Having 1:1 computing would positively impact my classroom
85.0%
instruction
Teachers: I anticipate students would use 1:1 devices at least 25% of
83.6%
their class time.
Teachers: I believe Chromebooks would meet students’ needs.
84.6%
94% of MS teachers; 90% of HS teachers who do not teach art / Tech Ed 27Board Goal
Maintain a comprehensive K-12 curriculum and electives that
link to personalized learning.
The budget will include existing programs and services.
Overall certified and non-certified staffing levels will be adjusted
based on enrollment and programming needs.
Additional staff members may be proposed to address issues of
student academic achievement and research based
interventions, behavior, and student health, safety and
security.
The budget will be reviewed and adjusted to provide
administrative, instructional and support staffing, Pre K – Grade
12, to address student, program, curriculum, and supervision
needs, as well as issues regarding safety and security.
28Addition of a Third Social Worker
Current ratio is 2 social workers to 2,000 students (not including Palmer)
Ratio in responding districts ranges from 1:300 to 1:675.
Role of a Social Worker
• Support students’ growth and development by fostering home to school
connections
• Identify nonacademic barriers to a students’ educational success
• Strategize plans address children’s unmet physical and emotional needs
• Focus on mental health and behavioral concerns including attendance
• Develop intervention and treatment plans that link school, home, and
community resources
• Provide early intervention services for students at risk
29Increase in Certified Staff to Maintain Class Size
Secondary
• To manage class sizes at Tyl, the maintenance budget requires shared
staff with MHS (0.4 SS, 0.2 Science, 0.2 PE, 0.2 WL, and it means the
Tyl math coaching block will be lost.
• Services requested by Principal Dix and mentioned by parents at the
budget forum for struggling Tyl students cannot be provided
• MHS teaching staff does not have any flexibility in science and math
departments. We are currently paying teachers in those areas to
teach extra classes.
• Dual Language Magnet School is closing at the end of this year which
means up to 12 students may be returning to grades 7 and 8.
Elementary
• Any incoming students in Murphy grade 2 or Oakdale grades 1 will
make those already large primary classes too large.
• PreKindergarten numbers are volatile and we may be understaffed
• Our Special Needs classrooms at Mohegan and Tyl are above
30
capacity. Any additional students would require a new classroomParaeducator Staffing Currently, district-wide, we have 13 Full Time Paraeducators and 100 Part Time Paraeducators At Mohegan Elementary School alone from 9/1/18 through 2/5/20, seventeen part-time paraeducators have resigned. Of 40 part-time positions, currently 2 are filled by substitutes and 4 are vacant. Only seven of the 16 paras hired since 9/18 are still employed at Mohegan. Proposal – 8 part-time paraeducators be replaced by 4 full-time paras. These full time paras would be used in the Mohegan Special Needs program and the Murphy Pathways program where consistency of 31 services is especially important
Need for an ELA Coach
                SBA ELA Proficiency from 2015 to 2019
                                                                                                Change from
                                                55.7%                                           2015 to 2019:
                                           55.3%
    State                               54.2%                                                      State:
                                            55.6%
                                                                                                 +3.3 Points
                                52.4%

                                                                                62.6%
                                                                 59.5%
Montville                                                       59.2%
                                                                       60.4%                     Montville:
                                                                                                 +7.2 Points
                                            55.4%

        46.0%   48.0%   50.0%    52.0%    54.0%     56.0%      58.0%    60.0%   62.0%   64.0%
                         2019      2018     2017        2016     2015

                                                                                                                32
SBA Math Proficiency (State and MPS)
48.10% Change from
46.80% 2015 to 2019:
45.60% State:
44.0% +8.0 Points
40.1%
57.90%
56.00%
51.70% Montville:
46.4% +20.4 Points
37.5%
30.0% 35.0% 40.0% 45.0% 50.0% 55.0% 60.0%
2019 2018 2017 2016 2015
33Security Officers
Estimated daytime pay rate: $20.50 / hour
Estimated after hours pay rate: $19.80 / hour
MHS staffed from 6 a.m. to 3 p.m.: $33, 600
MHS staffed from 3 p.m. to 9 p.m.: $21,600
Tyl and Elementary Schools, 7.3 hours / day: $27,400
Potential of investigating use of the SRO model in
partnership with the police force
34Identified Needs
Need 2019-2020 2020-2021 2021-2022 Future
Maintenance Position $95,600
Custodial Position $77,000 $77,000
3 Certified Staff Positions $90,900 $210,000
(social worker and classroom
teachers)
SAT Prep Course 0
Middle School Sports $36,000
Elementary Field Trips $6,000
Full-Time Paraeducators $50,000
One-to-One Computing, MHS $30,000 $140,000
Additional Leadership at 0 $16,000
Tyl/MHS
ELA Coach $80,000 $80,000
Security Officers $30,000
35
ea.Cost of 2020-2021 Proposed Additions to the Budget
$39,744,736 Budget without Additions
$290,000 Additions
$40,034,736 Total
3.47% Increase from FY2020 Appropriation
36Proud of our Focus
on Improvement!
37You can also read